
TradingView Stock Screener: How to Use It and What It Costs


Contents
- TradingView stock screener in 30 seconds
- What is the TradingView stock screener?
- Which screeners TradingView offers
- How to use the TradingView screener: step by step
- Three popular screens tested
- What the screener can do for free and where Basic ends
- Pine Screener: your own indicators as filters
- TradingView screener on your phone: app or browser
- Strengths and limits of the TradingView screener
- Conclusion: the best free starting point, but no substitute for thinking
- Frequently asked questions about the TradingView stock screener
- About the author
Out of 8,250 US stocks, the TradingView screener kept 104 in our test, and one of them only because its earnings had jumped 899 percent after a weak year. That is the strength and the trap of this tool. It filters fast and for free, but it takes every number literally.
I have paid for TradingView since August 2017, and I use the Ultimate plan today. For this guide, we opened the screener on October 8, 2026 without an account, ran three popular screens and checked every plan limit against TradingView’s own pricing page and help center. This article follows our editorial policy.
TradingView stock screener in 30 seconds
The key points as of October 8, 2026:
- What it is: a free filter tool on the charting platform TradingView for stocks, ETFs, bonds and cryptocurrencies.
- What is free: The screener works on the free Basic plan. Without an account, only the popular screens open; every custom filter asks you to sign in.
- Where Basic ends: fields only on the daily, weekly and monthly timeframe, no CSV export, no auto-refresh and no Pine Screener.
- What costs more: Essential starts at $14.95 a month ($12.95 a month billed yearly). The Pine Screener needs Premium at $69.95.
- On your phone: According to TradingView, the screener is not in the iOS and Android apps. It works in the mobile browser.
- Our verdict: the strongest free screener for the first selection. You have to check every result yourself afterwards.
What is the TradingView stock screener?
The TradingView stock screener is a free filter tool on the charting platform TradingView. It searches stocks, ETFs, bonds and cryptocurrencies by fundamental and technical criteria and shows only the symbols that meet all the conditions you set.
A screener works like a sieve. You set conditions, for example a P/E ratio below 15, and the screener removes every stock that does not fit. On TradingView, the stock screener is the most detailed of several screeners, and it also contains the AI screener.
TradingView’s own numbers on the data differ. According to the pricing page, the screener covers more than 500 fields from more than 150 exchanges in over 50 countries. The company’s features page names more than 400 filter fields. Both numbers come from TradingView; the company does not publish a total number of stocks.
Quick explanation: a field is a number you can filter or sort by. Examples are market capitalization, dividend yield or the distance to the 52-week high.
TradingView screener at a glance
| Provider | TradingView |
| Screeners | stocks, ETFs, bonds, crypto, Pine Screener |
| Fields | 500+ (pricing page) |
| Markets | 150+ exchanges, 50+ countries |
| Cost | Basic free, extras paid |
| Platforms | browser, desktop app |
| Current version | since December 26, 2023 |
Which screeners TradingView offers
TradingView has not one screener but six, plus the Pine Screener. That is how the help center lists them. All six share the same interface and the same controls, and you switch between them in the menu at the top left:
- Stock Screener: the most detailed one, with fundamental and technical fields. Only here will you find the AI screener.
- ETF Screener: filters exchange-traded funds with the same controls.
- Bond Screener: searches fixed-income securities.
- Crypto Coins Screener: lists individual cryptocurrencies.
- CEX and DEX Screeners: show trading pairs on centralized and on decentralized exchanges.
- Pine Screener: uses an indicator written in Pine Script as the filter. More on that below.
TradingView no longer lists a forex screener in its current overview. The page still loads, but in the old interface. The same applies to the old stock screener, which still runs under its own address.
The AI screener builds the filter from one sentence. You type, for example, “stocks with a golden cross today”, and it sets the matching fields. According to the help page on the AI screener, the feature is still in public beta, works only in the stock screener and needs a paid plan. It is not the same as the chat assistant we tested in our TradingView AI Copilot review.
How to use the TradingView screener: step by step
Using it always follows the same pattern: choose a market, set filters, adjust columns, save. The steps below refer to the stock screener in the browser.
- Open the screener: through the Products menu or directly at tradingview.com/screener. On our visit, the market was set to the US, and the table showed 8,250 stocks.
- Choose the market: The flag button switches to Germany, Japan or the whole world. You can also select several countries at once.
- Set filters: A click on a field such as “P/E” opens ready-made ranges. “Manual setup” lets you enter your own values, and the plus button adds more fields.
- Adjust the columns: The tabs Overview, Performance, Technicals, Extended hours, Valuation and Dividends change the columns. You can create your own column sets with the plus button.
- Save and share: Ctrl+S or Cmd+S saves filters, columns and sorting as your own screen. Only a saved screen can be shared, by link.
- Use the results: You can move matches straight into a watchlist and check them further on the chart.
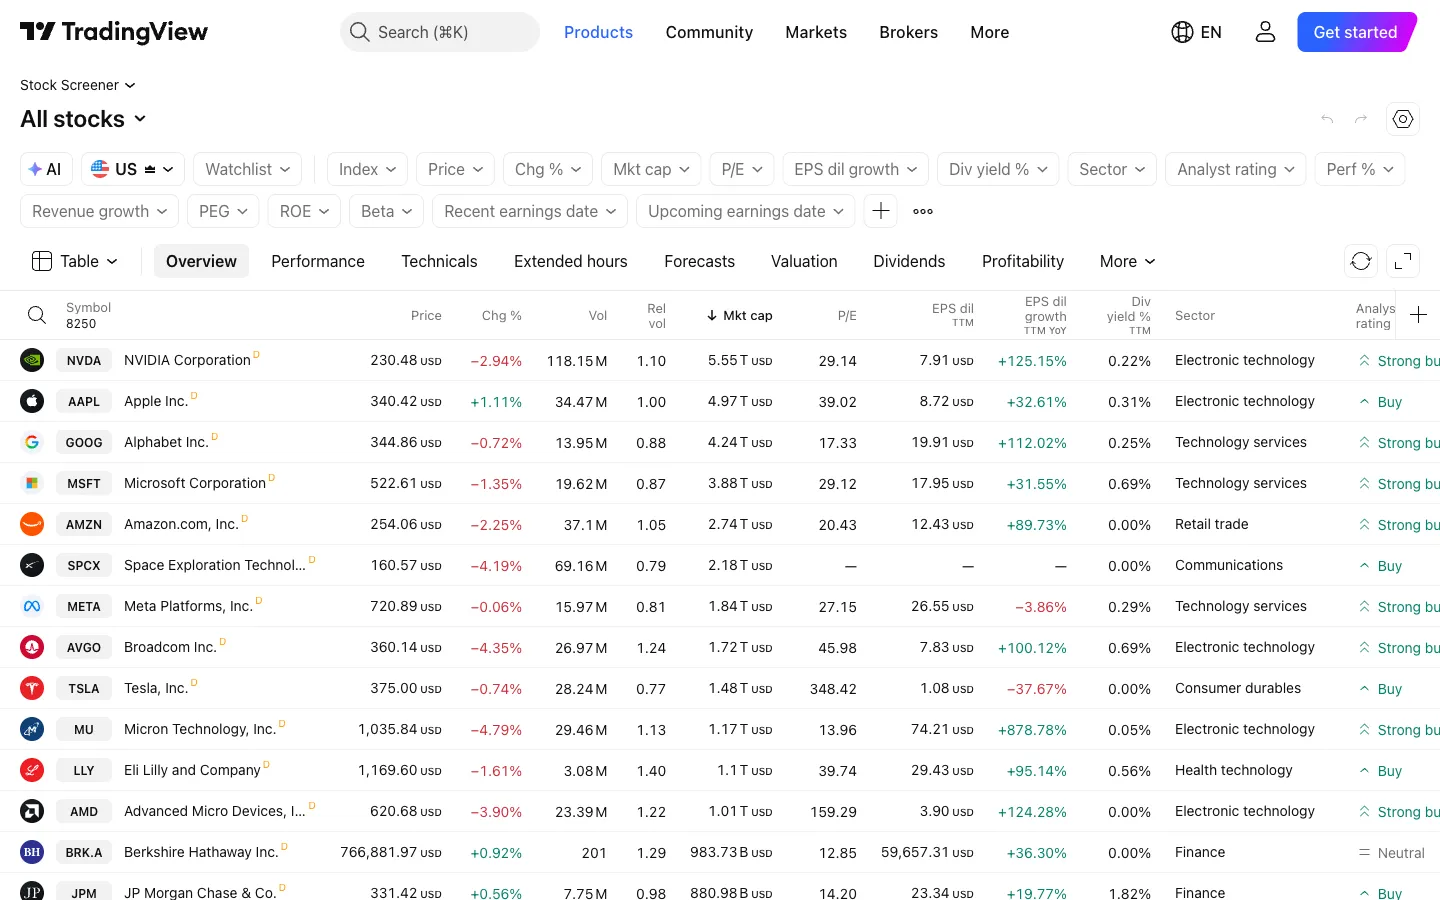 The stock screener after opening it: 8,250 US stocks, the filter bar at the top and the column tabs below. Screenshot without an account, October 8, 2026.
The screenshot above shows a small D after every name. It stands for delayed quotes; the tooltip says “Quotes are delayed by 15 min”. According to TradingView’s help page on US data, its charts show free real-time US stock data from the Cboe exchange by default. Whether the screener also does that with a free account, we could not check without one.
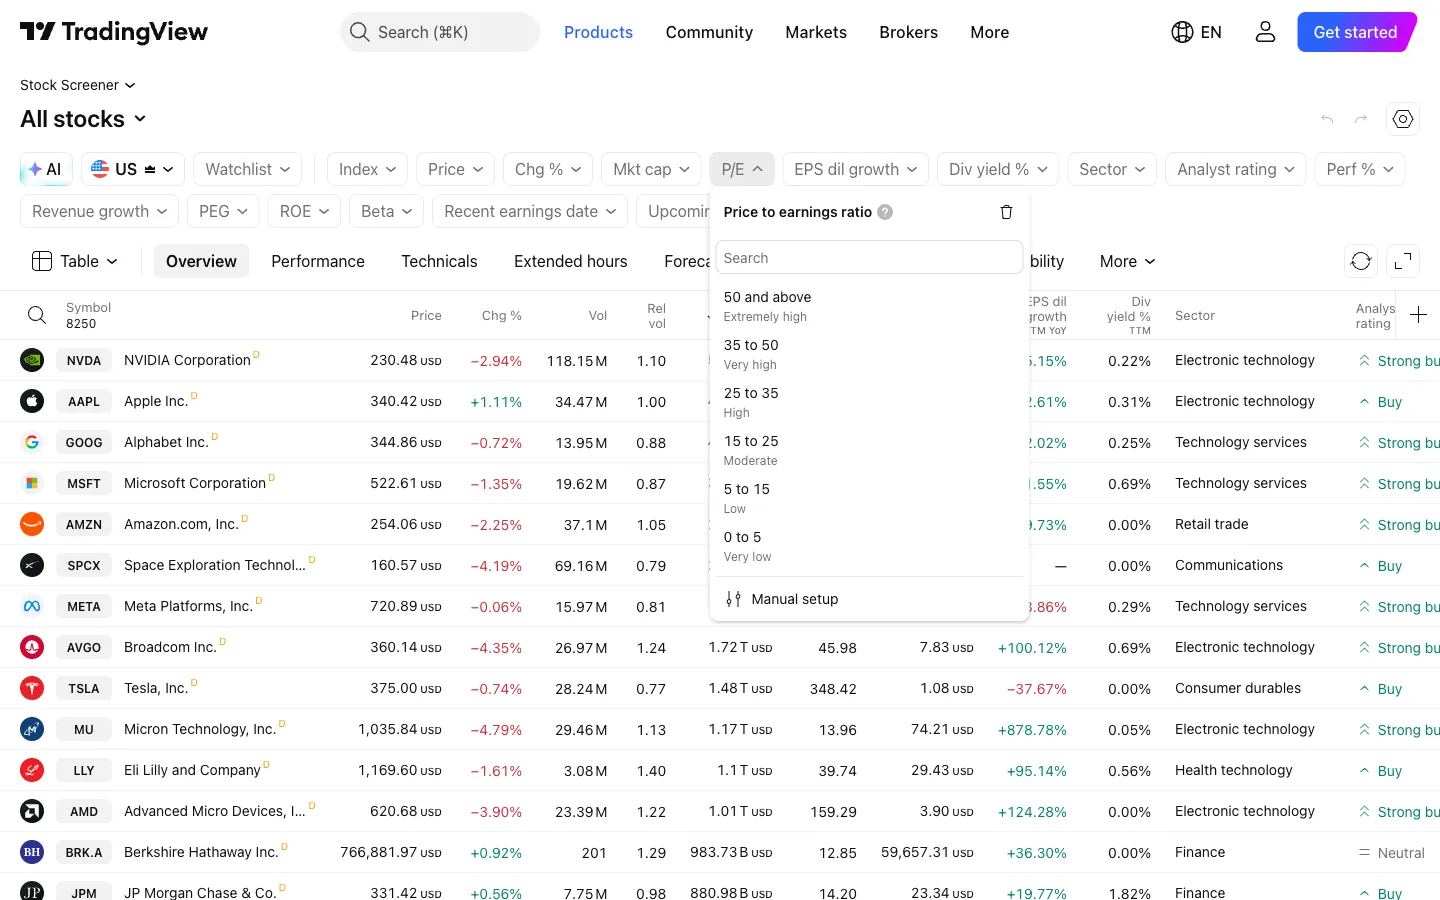 The P/E filter offers six ready-made ranges, from “Very low” to “Extremely high”, and a manual setup.
The screenshot shows how the ready-made ranges work. TradingView turns numbers into words: a P/E ratio from 5 to 15 is “Low”, one from 15 to 25 “Moderate”. This scale is a default of the platform, not a valuation of the individual stock.
Quick explanation: the P/E ratio divides the share price by the earnings per share of one year. A P/E of 10 means you pay ten times the annual earnings. A lower value is not automatically a bargain.
Three popular screens tested
Without an account, the screener does not let you set a single filter of your own. In our test, even the range “P/E 5 to 15” opened the sign-in window. What does work without an account are the ready-made screens, which TradingView calls “Popular screens”. We ran three of them on the evening of October 8, 2026.
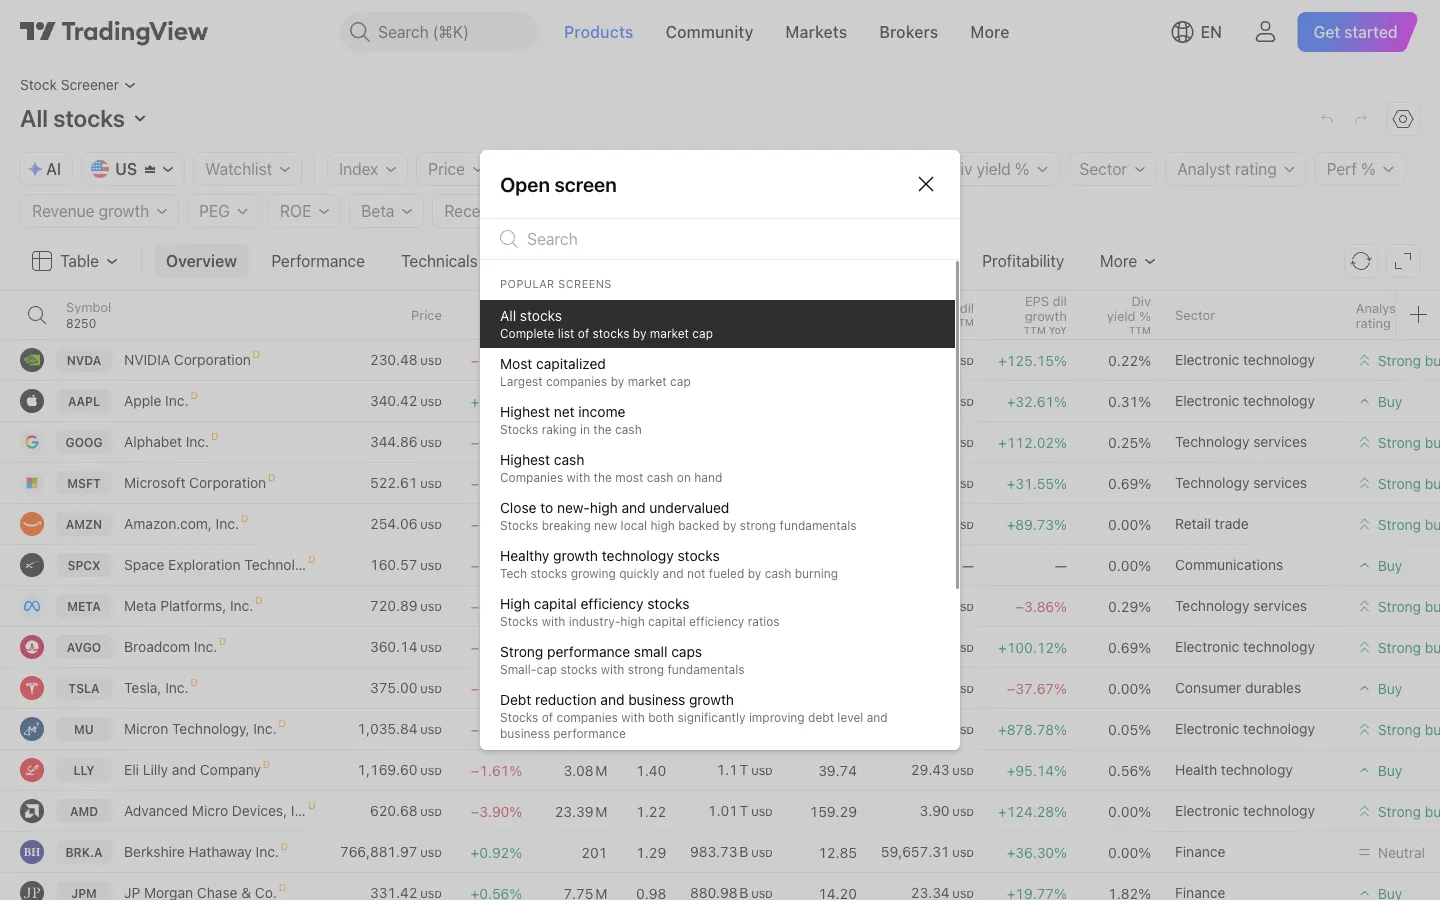 “Open screen” leads to the popular screens, including “Close to new-high and undervalued” and two dividend screens.
Close to new-high and undervalued: 104 matches, some of them base effects
This screen combines four conditions. Market cap must be above $750 million, the P/E ratio below 20, diluted earnings per share must have grown more than 25 percent year over year, and the price must be no more than 10 percent below its 52-week high.
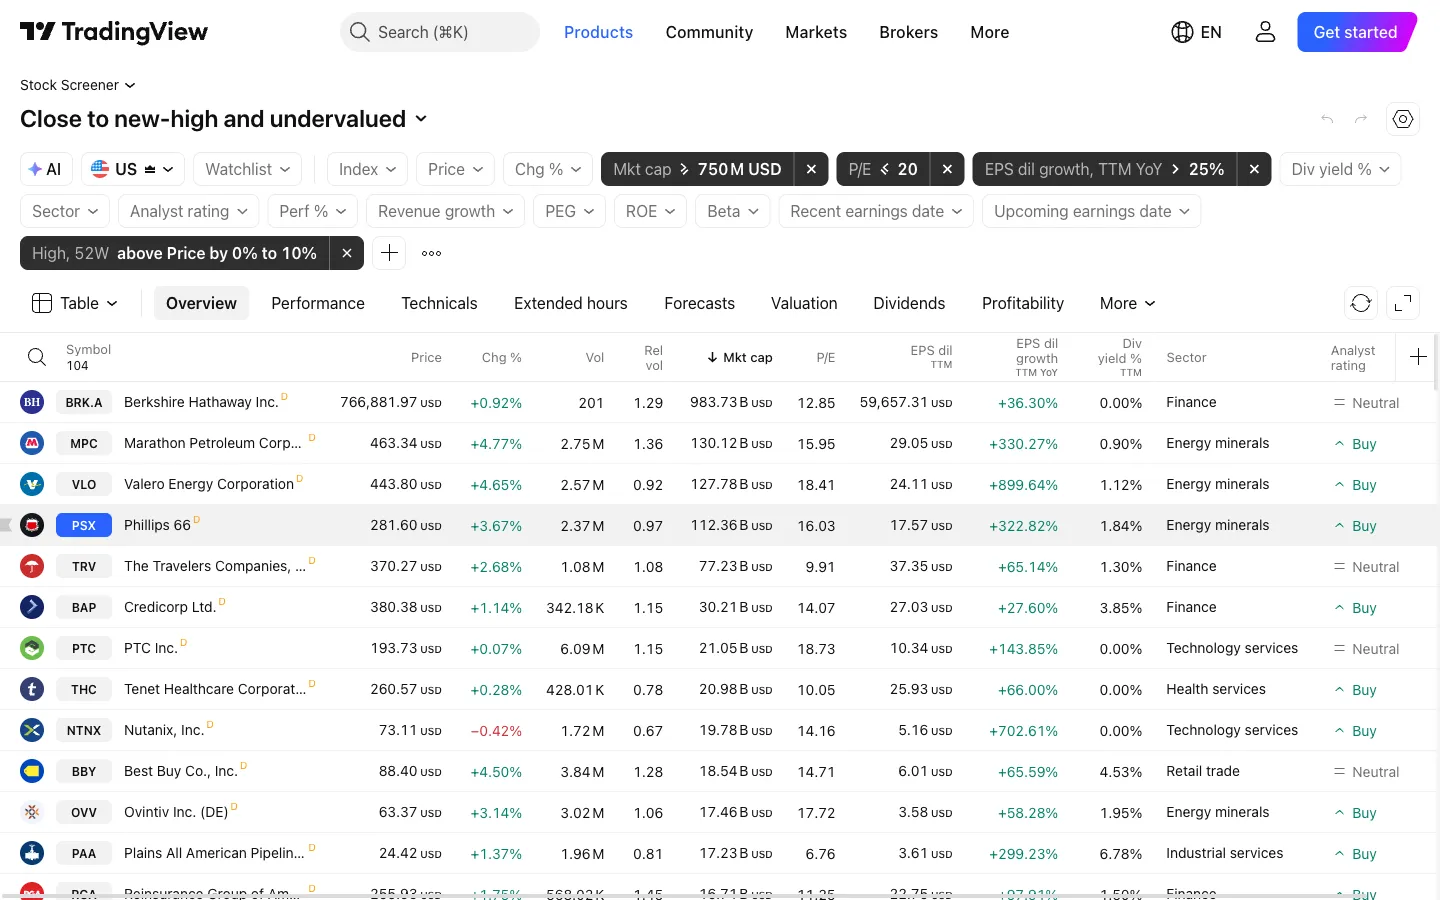 Out of 8,250 US stocks, 104 remain. Valero shows earnings growth of 899.64 percent, which comes from a weak prior year.
Out of 8,250 US stocks, 104 remained. At the top by market cap stood Berkshire Hathaway, followed by three refiners: Marathon Petroleum, Valero and Phillips 66. Their earnings growth of 330.27, 899.64 and 322.82 percent stands out. Nutanix even showed 702.61 percent.
A value like that appears when the comparison figure was very small. Valero’s trailing earnings per share were $24.11, so the prior period was roughly $2.41 by our calculation. The screener does not recognize this base effect; it only sees that the 25 percent hurdle has been cleared. Whether there is real growth or a recovery from a slump behind it, you have to read in the company’s reports.
Quick explanation: earnings per share (EPS) are a company’s profit divided by its number of shares. “Diluted” means TradingView also counts shares that could be created from options and convertible bonds.
Dividend kings: 28 matches and a counter that stops early
This screen looks for companies with more than 40 years of uninterrupted dividend growth. It also requires a market cap above $1 billion, more than 40 years of consecutive dividend payments and a payout ratio between 0 and 80 percent.
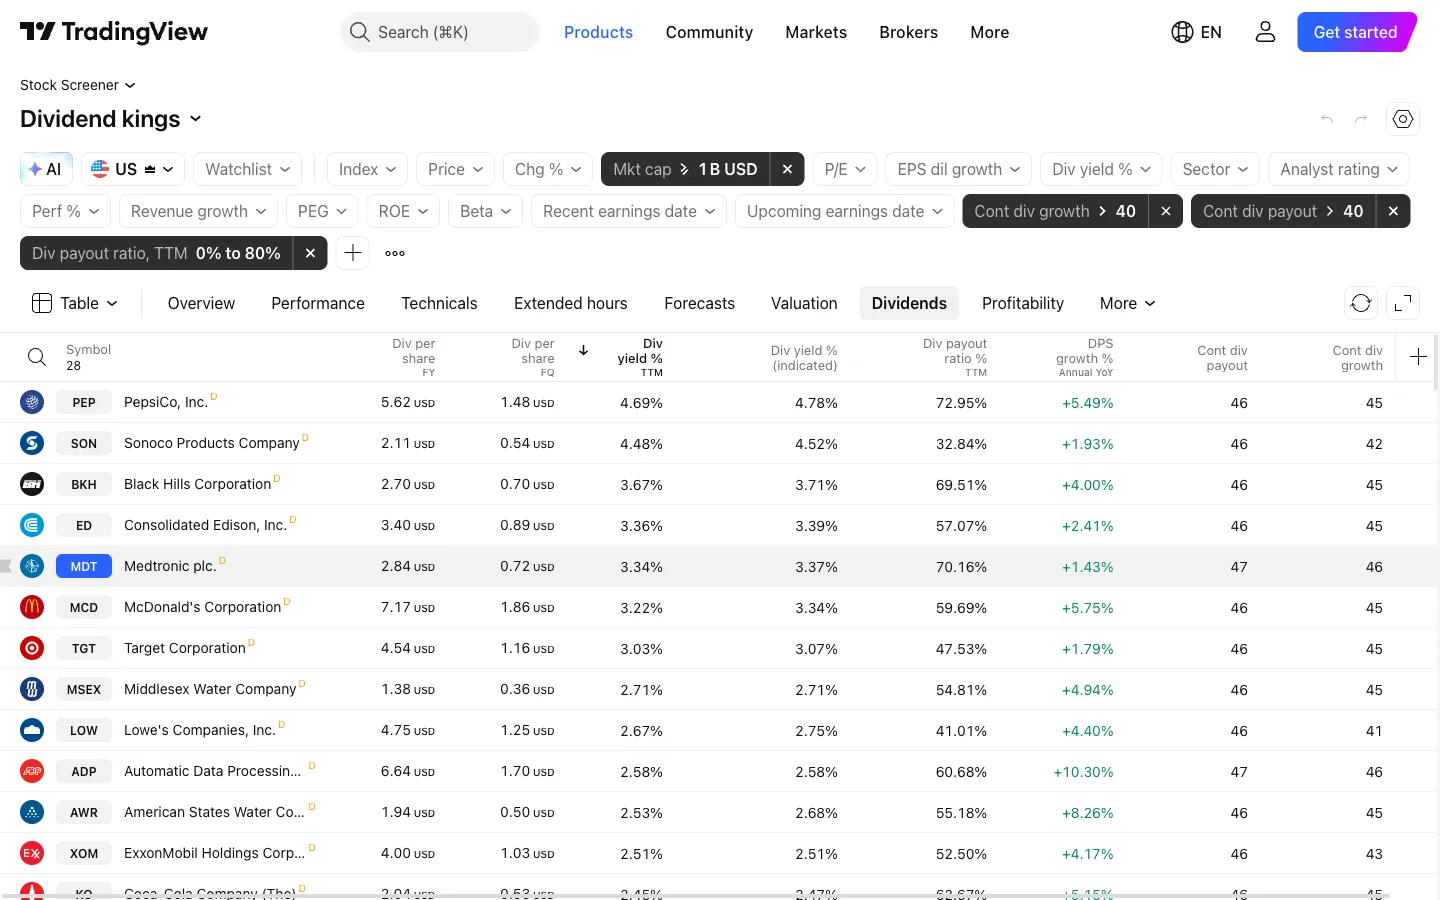 The Dividend kings screen for the US: 28 matches. The two columns on the right show the years of continuous payouts and continuous growth.
For the US, the screener found 28 companies. Sorted by dividend yield, PepsiCo came first at 4.69 percent, followed by Sonoco Products at 4.48 percent. In our German test, the same screen found no company at all in Germany.
One value in this list shows a limit of the data. Johnson & Johnson appears in the screener with 45 years of continuous dividend growth. The company itself announced its 64th consecutive increase in April 2026, according to its filing with the SEC. The counter in the screener apparently goes back only as far as TradingView’s dividend history. For a threshold of 40 years, that makes no difference; for longer streaks, it does.
Dividend princes: 27 matches and a built-in index filter
The second dividend screen contains a fixed filter for the S&P 500. It looks for 25 to 40 years of dividend growth, at least 25 years of payments and a payout ratio of up to 80 percent. That resembles the S&P 500 Dividend Aristocrats, whose members have raised their dividend every year for at least 25 years.
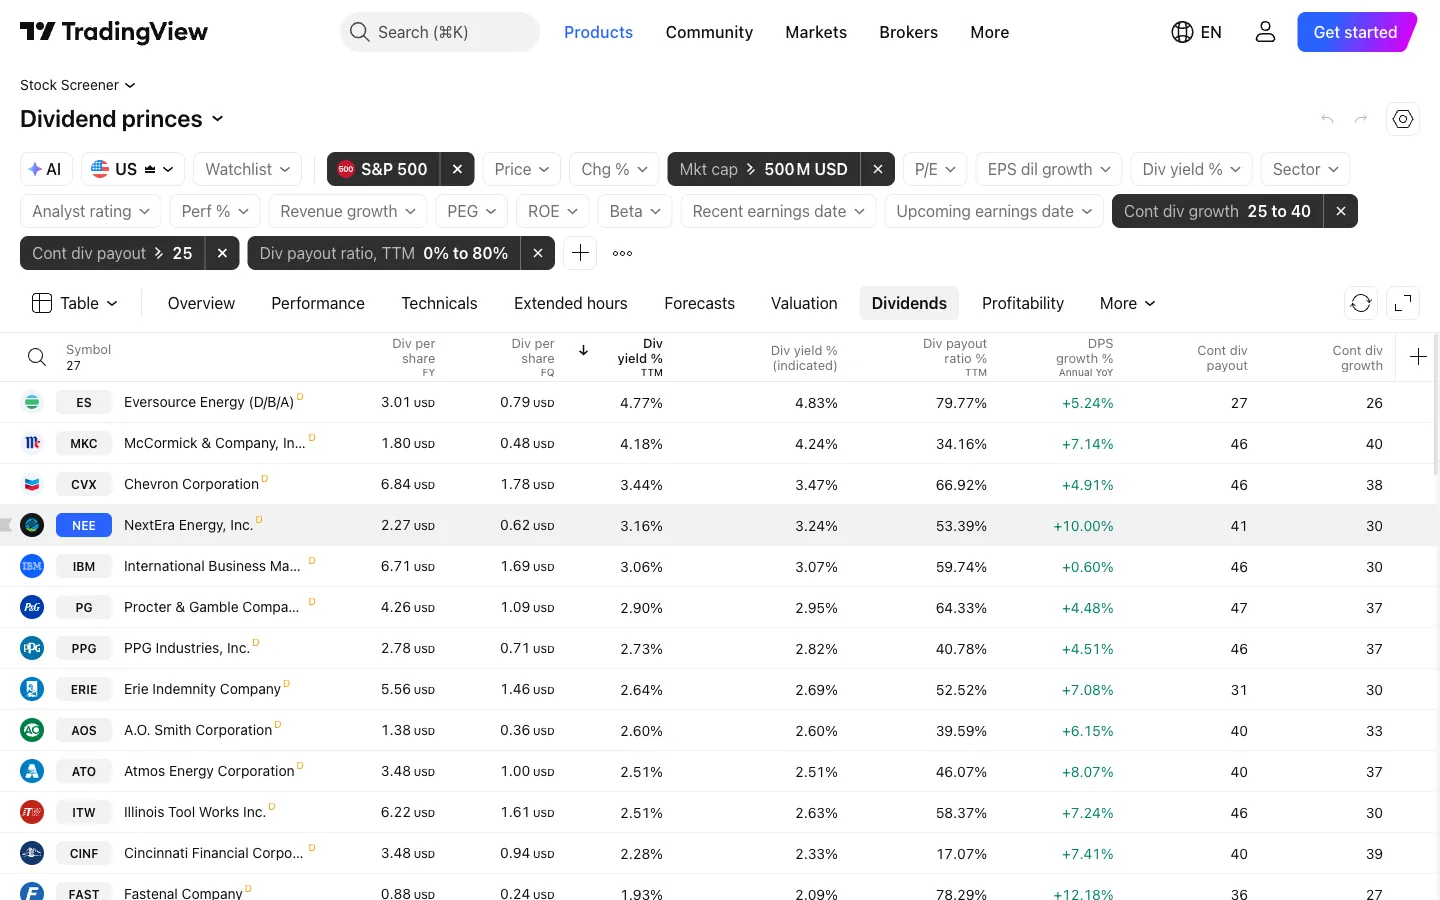 Dividend princes: 27 matches. Note the S&P 500 filter at the top left, which is part of the screen.
For the US, the screen returned 27 matches, led by Eversource Energy at a 4.77 percent yield. In our German test, it returned zero, because no German stock can be in the S&P 500 at the same time. If you switch the market and the list is suddenly empty, check the filter bar first.
The lesson from all three tests: read the filter bar before you trust a result. An empty list can mean that no stock fits, or that two filters exclude each other. A full list can contain outliers that only fit on paper.
What the screener can do for free and where Basic ends
The TradingView screener works on the free Basic plan. Paid plans cost between $14.95 and $239.95 a month and unlock all timeframes, CSV export, auto-refresh and, from Premium, the Pine Screener.
On the Basic plan, four things are missing that you notice while screening. Fields are only available on the daily, weekly and monthly timeframes, not intraday. You cannot export results as a CSV file. The table does not refresh by itself; paid plans refresh every 10 seconds or every minute. And there are no requests for the AI screener.
| Plan | For the screener | USD |
|---|---|---|
| Basic | basic features, fields on day, week, month only | 0 |
| Essential | all timeframes, CSV export, auto-refresh, 100 AI requests; yearly $12.95 | 14.95 |
| Plus | like Essential, 150 AI requests; yearly $29.95 | 34.95 |
| Premium | plus Pine Screener, 250 AI requests; yearly $59.95 | 69.95 |
| Ultimate | plus Pine Screener, 500 AI requests; yearly $199.95 | 239.95 |
How to read the table: The right column shows the price per month with monthly billing. The value after “yearly” is the monthly price if you pay for a year in advance.
The prices match our TradingView review and were unchanged on October 8, 2026. TradingView currently labels them as special prices on the pricing page, and sales tax may apply depending on where you live. The AI request limits apply per month and reset on the first of the month; during the beta, TradingView reserves the right to change them. All plans and data packages are explained in our TradingView review.
Basic is enough for most readers. If you filter by numbers in the evening and trade the next day, you will miss neither intraday fields nor real-time quotes. You can open a free Basic account on TradingView without entering payment details, as TradingView states on its pricing page.
Pine Screener: your own indicators as filters
The Pine Screener is a TradingView tool that applies a Pine Script indicator to a whole watchlist or index. It shows for which symbols the indicator’s condition is currently met.
This lets you filter by rules the regular screener does not know. According to the help page on the Pine Screener, it always scans one source, a watchlist or an index, and only one indicator per screen. It calculates on the last 500 bars.
- Plan: only on Premium and Ultimate, according to the plan comparison.
- Size: indices up to 4,000 symbols according to the help page; a watchlist holds up to 1,000 symbols on paid plans.
- Timeframes: 1, 5, 15 and 30 minutes, 1, 2 and 4 hours, and day, week and month.
- Not possible: strategies, financial data and an indicator built on another indicator.
Since September 1, 2026, choosing a script is easier. According to the TradingView blog, a script no longer has to be in your favorites; you pick it directly from your own, built-in or community scripts. How to write your own indicator is explained in our guide to Pine Script on TradingView.
TradingView screener on your phone: app or browser
There is no screener in the TradingView apps for iOS and Android. The help page says the mobile screener “is not supported at the moment”. TradingView gives no date for it, and the app descriptions in the stores do not mention the screener either.
In the mobile browser, however, the screener works. TradingView names the mobile web version explicitly for the chart view in the screener. The AI screener is not available on mobile devices, according to its help page. What the app can do otherwise is covered in the app section of our TradingView review linked above.
Strengths and limits of the TradingView screener
Overall, the screener is strong in breadth and weak where numbers need context. Our test with Valero and Johnson & Johnson showed that.
What speaks for the TradingView screener
- Free and broad: more than 500 fields from over 150 exchanges, even on the Basic plan.
- Popular screens without an account: ready-made screens you can open right away and rebuild.
- Technicals and fundamentals: ratios, indicators and 44 candlestick patterns in one query.
- Save and share: your own screens with autosave and a sharing link.
- Your own rules: the Pine Screener scans whole lists with your own indicator.
What speaks against it
- No custom filter without an account: every selection opens the sign-in window.
- Basic works on daily data only: no intraday fields, no export, no auto-refresh.
- Delayed quotes without an account: US stocks showed a 15-minute delay in our test.
- Numbers without context: base effects and short data histories go unnoticed.
- No app: on your phone, only through the browser.
If you have other priorities, there are alternatives. Complete charting platforms are compared in our TradingView alternatives, and stocks that gap before the open are covered in our guide to pre-market and after-hours trading.
Conclusion: the best free starting point, but no substitute for thinking
For a first selection, there is hardly a better free tool. The TradingView screener covers stocks, ETFs, bonds and crypto, combines ratios with chart signals and costs nothing on the Basic plan. A paid plan only pays off if you want to filter intraday, export results or run your own indicators through the Pine Screener.
My most important advice after this test: treat every list of matches as a list of questions, not a shopping list. The screener reported Valero because of a base effect, it cut 19 years off Johnson & Johnson’s 64-year dividend record, and a German version of a screen stayed empty because two filters excluded each other. If you check the matches against the company reports afterwards, you get the best out of the tool. This is a guide to a tool, not investment advice.
Frequently asked questions about the TradingView stock screener
Is the TradingView stock screener free?
Yes, the screener works on the free Basic plan. Without an account, only the popular screens open; for your own filters you need a free account. Basic lacks intraday fields, CSV export, auto-refresh and the Pine Screener.
How do I create a screener in TradingView?
Choose the market first, then the filters. A click on a field such as P/E or dividend yield opens ready-made ranges or a manual setup. The tabs change the columns, and Ctrl+S or Cmd+S saves the screen.
Is the TradingView screener available in the app?
No, according to TradingView it is not in the iOS and Android apps at the moment. You can open the screener in your mobile browser. The AI screener is not available on mobile devices.
What is the Pine Screener on TradingView?
The Pine Screener applies a Pine Script indicator to a watchlist or an index. It shows for which symbols the condition is currently met. It is only available on the Premium and Ultimate plans, with one indicator per screen.
Is the TradingView screener real-time?
Without an account, our test showed 15-minute delayed quotes for US stocks. TradingView’s charts show free real-time US stock data from Cboe by default. Whether the screener also does that with a free account, we could not check without one.
How much does the TradingView screener with all features cost?
All screener features including the Pine Screener start with the Premium plan. It costs $69.95 a month or $59.95 a month billed yearly (as of October 8, 2026). For export, intraday fields and auto-refresh, Essential from $14.95 is enough.
This US edition is based on our German edition on kagels-trading.de and has been adapted for US readers.
More TradingView guides
- Choose a plan
TradingView Review 2026: Plans, Pricing and Is It Worth It?
Prices of all plans in US dollars, real-time data costs, Black Friday and whether it is worth it.
- Save on a plan
TradingView Black Friday 2026: Dates, Deals and Best Plan
Expected 2026 timing, verified past deals and what to check before buying a plan.
- Practice without risk
TradingView Paper Trading: Setup, Limits and Tips (2026)
Set up the free paper trading account, place your first orders and learn where the simulation falls short.
- Compare platforms
TradingView Alternatives 2026: 7 Platforms Tested
Seven platforms compared, with a decision aid for when switching makes sense.
- Connect a broker
Best Brokers for TradingView 2026: A Guide for US Traders
Which US brokers work with TradingView and what to check before you connect one.
- Test a strategy
TradingView Backtesting: Test a Strategy Without Real Money
Manual testing with Bar Replay and automatic testing with the strategy report.
- Write an indicator
Pine Script in TradingView: Basics, Editor and Version 6
Pine Script basics, the editor and version 6, with code you can copy.
- Use the AI Copilot
TradingView AI Copilot Review: 7 Tests, Price and Limits
Seven real tasks for the paid AI add-on: what it costs, what it got right and where you must check it.
- Use VWAP
VWAP Indicator: Formula, Anchored VWAP and TradingView Setup
The VWAP formula, trend day versus range day, Anchored VWAP and the right settings in TradingView.