
Does the 50-Day Moving Average Act as Support? A Test


Contents
- The 50-day moving average in 30 seconds
- What the 50-day line is
- The question: does price really bounce off the 50-day line?
- How I tested it
- Results: how often the 50-day line held
- Is the 50 special? 40, 60 and a control line
- Touches against ordinary uptrend days
- One test that held, one that failed
- When it broke: the worst cases
- Limits of this test
- My conclusion: a reference, not a floor
- Frequently asked questions about the 50-day moving average
- About the author
Many traders say the 50-day moving average acts as support in an uptrend, so I tested it. I took every pullback to the line in an S&P 500 uptrend since 1962, 157 of them, and checked whether the line held. Then I ran the same test on the 40-day line, the 60-day line and a control line: not an average itself, but placed with the help of the 50-day SMA.
The result is less exciting than the claim, and that is useful to know. The 50-day line held in about every second case, and it did not hold better than its neighbours. Below you see the rules, the numbers and two examples from 2026. This article follows our editorial policy.
The 50-day moving average in 30 seconds
- Definition: the 50-day moving average is the average of the last 50 daily closes, about ten trading weeks; most charts show the simple version (SMA).
- The claim: in an uptrend, pullbacks often stop at the line, so traders treat it as support.
- My test: 157 touches of the 50-day SMA in S&P 500 uptrends from 1962 to October 2026, with rules fixed before the calculation.
- The line held in 47.1% of cases: no close more than 1% below it on the touch day and the next 10 sessions.
- Not better than other lines: the 40-day line held in 50.6%, the 60-day line in 42.9%, a control line calibrated on the 50-day SMA in 44.2%; none of the gaps was clear enough to call a difference.
What the 50-day line is
The 50-day simple moving average adds the last 50 daily closes and divides them by 50. It moves with every new close and covers about ten trading weeks. That makes it slower than a 20-day line and faster than the 200-day line. How the simple and the exponential version are calculated, and which periods traders use, is explained in the guide to moving averages.
This article answers one question only. Does the line stop pullbacks in an uptrend more often than chance and more often than other lines? The crossover of the 50-day and the 200-day line is a different signal; it has its own guide on the golden cross.
The question: does price really bounce off the 50-day line?
You will read the support claim almost everywhere, but rarely with numbers. Google’s AI summary for “50 day moving average” says that in an uptrend the line “frequently acts as a support level” (checked on November 12, 2026). In the search results I looked at, I found no quantified test of that statement.
A bounce on a chart proves little on its own. In an uptrend prices tend to rise anyway, so a pullback that stops somewhere is not surprising. The real question is whether it stops at the 50-day line more often than at a line slightly above or below it. That is why the test compares four lines on the same days.
How I tested it
I wrote all rules down before I calculated anything, and a second reviewer checked them. The data are daily bars of the S&P 500 price index from Yahoo Finance, from January 2, 1962 to October 15, 2026. Earlier years are left out because the high and low of each day equal the close there, so a touch during the day cannot be measured.
- Uptrend: the prior close is above the 200-day SMA, and the 200-day SMA is higher than 20 sessions earlier. The same rule applies to every line.
- Approach from above: for ten sessions in a row, the daily low stayed above the line.
- Touch: the daily low reaches the level the line had at the prior close. That level is known before the session opens.
- Held: on the touch day and the next 10 sessions, no close falls more than 1% below that fixed level.
- Comparison: the 40-day and 60-day SMA, and a control line: the highest close of the last 50 days minus the typical gap between that high and the 50-day SMA over the past year. It sits where the 50-day line usually sits but is not an average itself. Because its distance comes from the 50-day SMA, it is an SMA50-calibrated comparator, not a fully independent line.
- Base rate: all 7,835 uptrend days that met the same conditions, with or without a touch. Days too close to October 15, 2026 drop out of the longer windows, which leaves 7,814 days for 21 sessions and 7,772 for 63 sessions.
Touches overlap in time, so I did not treat them as independent. The ranges in the tables are 95% intervals from a block bootstrap: whole stretches of history are drawn again and again, so that calm and wild years stay together. I tested three block lengths (about three months, one year and four years). A difference only counts if all three ranges exclude zero and both halves of the period, 1962 to 1993 and 1994 to 2026, point the same way.
Results: how often the 50-day line held
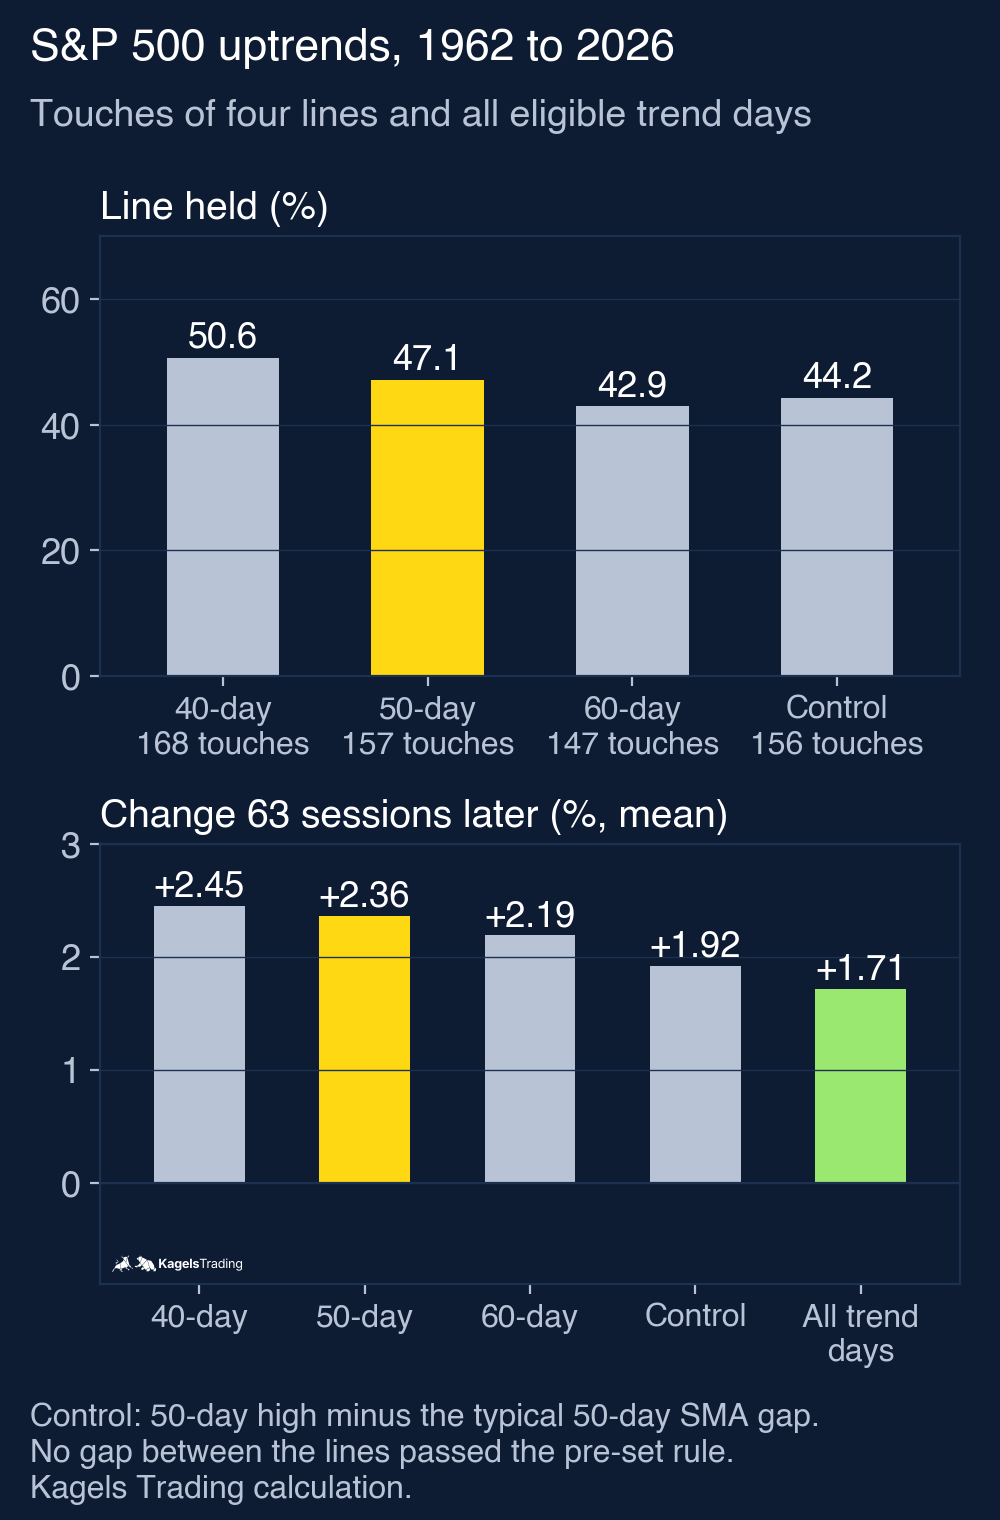
The 50-day line held in 74 of 157 touches, or 47.1%. In the other cases, the index closed more than 1% below the line within the next ten sessions. With a stricter rule (0%: no close below the line at all) the share falls to 18.5%; with a looser one (2% allowed) it rises to 65.6%. “Moving line” compares each close with the line of that day instead of the level fixed at the touch.
 Click to enlarge
| Line, 1962 to 2026 | Touches | Held (1% rule) |
|---|---|---|
| 40-day SMA | 168 | 50.6% |
| 50-day SMA | 157 | 47.1% |
| 60-day SMA | 147 | 42.9% |
| Control line | 156 | 44.2% |
| Held, other rules | 0% | 2% | Moving line |
|---|---|---|---|
| 40-day | 14.3% | 69.0% | 43.5% |
| 50-day | 18.5% | 65.6% | 40.8% |
| 60-day | 13.6% | 63.9% | 40.8% |
| Control | 17.9% | 71.8% | 44.2% |
The share did not depend much on the period. From 1962 to 1993 the 50-day line held in 50.0% of 68 touches, from 1994 to 2026 in 44.9% of 89. When I keep only one touch per 63 sessions, it held in 44.9% of 98. Touch days that traded entirely below the line were rare (0.6%); without them, the 50-day line held in 47.4% of 156 touches.
Is the 50 special? 40, 60 and a control line
No, not in this test. The 50-day line held 3.5 percentage points less often than the 40-day line and 4.3 points more often than the 60-day line. Both gaps are small next to the uncertainty.
| Held, 50-day minus | 40-day | 60-day | Control |
|---|---|---|---|
| Gap | −3.5 | +4.3 | +2.9 |
| Range, 1-year blocks | −9.8 to +2.8 | −1.2 to +9.8 | −5.2 to +11.1 |
| Range, 3-month blocks | −9.7 to +2.9 | −2.0 to +10.6 | −5.1 to +11.0 |
| Range, 4-year blocks | −9.4 to +2.1 | +0.1 to +8.2 | −5.6 to +10.3 |
All values in the table are percentage points, and the ranges are 95% intervals. Only the 4-year blocks put the gap to the 60-day line just above zero; the other two block lengths do not, so it fails the pre-set rule.
So the honest conclusion is: no demonstrated advantage for the 50 under these rules. That does not prove that all lines are equal, and it says nothing about why prices turn where they do. The lines also overlap: on 51.6% of the days the 50-day line was touched, the 60-day line was touched as well, and on 42.7% the 40-day line.
Touches against ordinary uptrend days
After a touch of the 50-day line, the index rose a bit more than on an average uptrend day. 63 sessions after the touch it was up 2.36% on average (156 touches with a complete window), against 1.71% for all uptrend days (7,772). After 21 sessions the figures were 0.88% (157) and 0.53% (7,814).
| Mean change | Uptrend days | 50-day touches | Gap |
|---|---|---|---|
| 21 sessions later | +0.53% | +0.88% | +0.35 |
| 63 sessions later | +1.71% | +2.36% | +0.64 |
| Deepest low, 21 sessions | −2.90% | −3.17% | −0.28 |
The 95% intervals of the gap are wide, even with one-year blocks. In percentage points: 21 sessions −0.23 to +0.86, 63 sessions +0.04 to +1.23, deepest low −0.80 to +0.16. Zero sits inside two of the three ranges.
The 63-session gap looks positive, but it did not pass the rule. With three-month blocks the range runs from −0.08 to +1.33, so zero stays inside. On the way there, the index also fell slightly deeper after a touch than on an ordinary day. These are changes measured from the close of the touch day. They are not trading returns, and “held” does not mean a trade made money.
One comparison out of 24 did pass the rule, and I report it anyway. After touches of the 40-day line, the index was up 0.74 percentage points more than on ordinary uptrend days 63 sessions later. No correction for multiple comparisons was applied; this is a single observation among 24 comparisons, and one hit can easily be chance. I treat it as an observation, not as a finding.
One test that held, one that failed
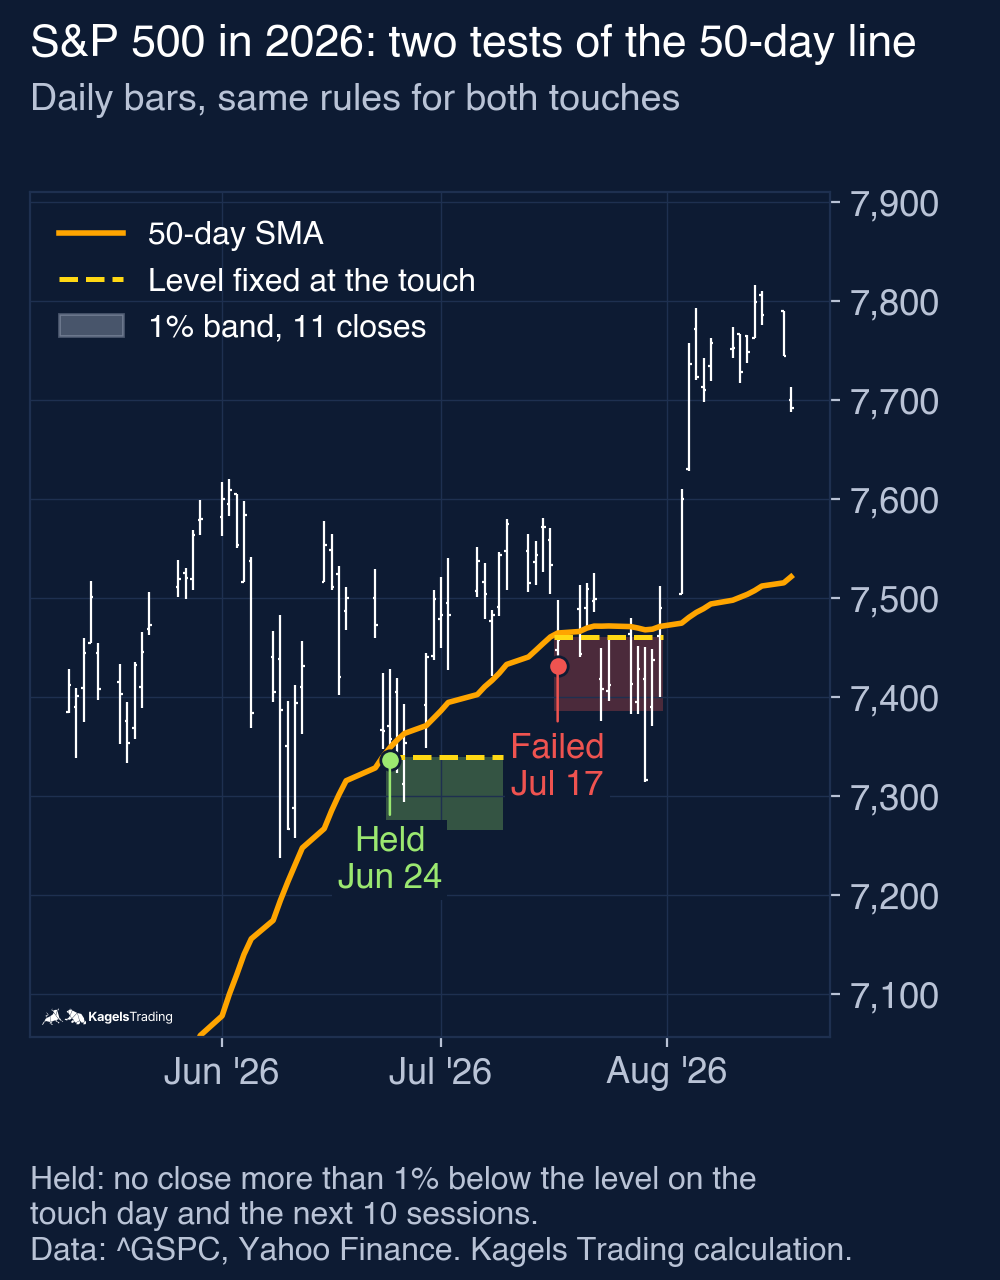
Two touches from 2026 show what the rules mean on a chart. On June 24, 2026, the low reached the 50-day level of 7,339.57. The lowest close in the next ten sessions was 7,354.02, still above the level, so the line held. On July 17, the low touched the line at 7,460.91, and on July 29 the index closed at 7,316.15, 1.94% below it. That counts as failed.
 Click to enlarge
The failed test is a good warning against reading too much into the label. 21 trading sessions after July 17 the index was 3.85% higher than at the close of the touch day. That is one example, not a rule. “Held” in this test only describes the daily closes: whether any close on the touch day or the next ten sessions fell more than 1% below the fixed level. It says nothing about intraday prices, stop orders or execution.
When it broke: the worst cases
The worst failures came right before the deepest sell-offs. I ranked the failed touches by the lowest close within 63 sessions, measured against the level of the line. All failed touches had a complete window.
| Touch of the 50-day SMA | Lowest close within 63 sessions, below the line |
|---|---|
| February 24, 2020 | −31.7% (Covid crash) |
| September 3, 1987 | −29.4% (before the October 1987 crash) |
| March 26, 1962 | −24.9% (the 1962 market break) |
Each of these started as an ordinary touch in an uptrend. The rules were met, the 200-day line was rising, and a few weeks later the index was a quarter or more below the line. A touch of the line said nothing in advance about these moves, and this test does not show what any exit rule would have done.
Limits of this test
This is one index, one data provider and one set of rules. The highs and lows of the early years come from the provider and may be less exact than today’s. 38 days in the period had no real range, which removed one or two touches per line. Single stocks behave differently from an index, and other markets were not tested.
The rules were fixed in advance, and that cuts both ways. I did not search for the best tolerance or the best length, so the result is not curve-fitted. But other reasonable rules, such as a different trend filter, could give other numbers. How many results you can produce by trying settings is shown in the guide to backtesting.
My conclusion: a reference, not a floor
The 50-day line is a reasonable reference for the medium-term trend, but not a floor. In S&P 500 uptrends since 1962 it held in about every second touch, and it held no better than a 40-day line, a 60-day line or a control line calibrated on the 50-day SMA. The number 50 is a convention, not a market law.
I draw my levels from price itself, and that is where I would look first. Highs, lows and congestion zones show where buyers and sellers actually traded; the guide to support and resistance shows how to find them. If a pullback runs into such a zone near the 50-day line, the area gets more interesting. On its own, a touch of the 50-day line held in 47.1% of cases in this test, and no other line did clearly better or worse.
This article is market analysis, not investment advice. Past results of an index do not show future returns.
Frequently asked questions about the 50-day moving average
Does the 50-day moving average act as support?
In S&P 500 uptrends since 1962, the line held in 47.1% of 157 touches. Held means no close more than 1% below it on the touch day and the next ten sessions. The 40-day and 60-day lines did about as well, so the test shows no special support at 50.
What happens when the S&P 500 closes below its 50-day moving average?
This test did not measure how often the index recovered after a failed touch, but the worst cases were severe. In one example, the failed touch of July 17, 2026, the index was 3.85% higher 21 trading sessions later. In February 2020 and September 1987, failed touches led to closes about 30% below the line within 63 sessions. A break of the line alone tells you little; the death cross of the 50-day and the 200-day line is covered in the guide to the death cross.
More Technical Indicators guides
- Judge a golden cross
Golden Cross: Definition and S&P 500 Test Results
How the 50-day and 200-day averages cross, and what 38 signals in the S&P 500 since 1950 did against the base rate and buy and hold.
- Judge a death cross
Death Cross: What 38 S&P 500 Signals Since 1950 Show
How deep the S&P 500 fell after 38 death crosses since 1950, how late the signal comes, and what shorting it on SPY did since 1993.
- Judge a Hindenburg Omen
Hindenburg Omen: What 21 Signal Clusters Since 2017 Show
How the breadth signal is calculated, why trackers disagree on its rules, and how often SPY fell 10% after 21 signal clusters since 2017.
- Use moving averages
Moving Averages: SMA, EMA and a 76-Year 200-Day Test
SMA, EMA and WMA formulas with a worked example, common periods, and what the 200-day line showed on the S&P 500 since 1950.
- Trail a stop with the Supertrend
Supertrend Indicator: Settings, Strategies and an ETF Test
How the ATR-based line is calculated, common settings, five strategies, and what 654 completed flip trades in SPY, QQQ and GLD since 1993 showed.
- Read the Ichimoku Cloud
Ichimoku Cloud: The Five Lines and a US ETF Test
The five lines and the cloud, how traders read the Tenkan/Kijun cross, and what the cloud and the crosses did in SPY (since 1993), QQQ and GLD.
- Measure trend strength with the ADX
ADX Indicator: What Trend Strength Really Tells You
How +DI, −DI and the ADX are calculated, what 20 and 25 mean, and whether a high ADX meant the trend went on in SPY, QQQ and GLD.
- Read the RSI
RSI Indicator: Formula, Settings and a 75-Year Test
The RSI formula, overbought and oversold, and what RSI signals did on the S&P 500 since 1951 against the base rate.
- Compare a stock with the market
Relative Strength: Compare Stocks with the Market
The price ratio behind every relative strength line, how it differs from the RSI, a five-step watchlist and two Dow examples from one selection date.
- Read volatility with Bollinger Bands
Bollinger Bands: Settings, Squeeze and a 76-Year Test
Settings, the three typical chart situations, five strategies with rules, and what the bands and the squeeze showed on the S&P 500 since 1950.
- Trade reversals at the bands in a range
Joe Ross's Gimmee Bar: Bollinger Bands for Sideways Markets
Joe Ross's Gimmee Bar with complete long and short rules, our added stop, target and expiry rules, and one clean and one failed trade in Procter & Gamble.
- Set stops with the ATR
ATR Indicator: Average True Range for Stops and Size
True range and Wilder smoothing, stop distance and position size, and how ATR stops behaved on SPY from 1994 to 2026 against a fixed stop.
- Trade Donchian breakouts
Donchian Channel: Breakout Rules and a 20-Year ETF Test
Channel rules, the current-bar pitfall, the Turtle systems, and what 499 breakout trades in SPY, GLD and TLT from 2006 to 2026 showed.
- Read the Stochastic
Stochastic Oscillator: Settings, Signals and a 30-Year Test
The %K and %D formula, what 14, 3, 3 means, fast versus slow, and what 785 oversold signals in SPY, QQQ and GLD did against the base rate.
- Judge a divergence
Divergence Trading: Regular and Hidden Divergence Tested
Regular and hidden, bullish and bearish divergences, when they are confirmed, and what 447 RSI divergences detected in SPY, QQQ and GLD did against the base rate.
- Read the MACD
MACD Indicator: Histogram, Divergence and a 31-Year Test
Formula, histogram, crossovers and divergences, with a 31-year test on the S&P 500 and the DAX against the base rate.
- Use VWAP
VWAP Indicator: Formula, Anchored VWAP and TradingView Setup
The VWAP formula, trend day versus range day, Anchored VWAP and the right settings in TradingView.