
XAU Gold/Silver Index Explained: Holdings, Weighting and Risks


Contents
- XAU index in 30 seconds
- What is the XAU index?
- Which stocks are in the XAU index?
- How is the XAU index weighted and calculated?
- History: from the Philadelphia Gold and Silver Index to Nasdaq
- How has the XAU index performed?
- Why does the XAU move differently from gold and silver?
- XAU, HUI and GDX: how do they differ?
- Can you invest in the XAU index?
- Strengths and limits of the XAU index
- XAU index: our conclusion
- Frequently asked questions about the XAU index
- About the author
In 2024 the gold price rose 27 percent, but the XAU index of gold and silver miners gained only 9 percent. A year later it was the other way round: gold rose 65 percent, the miners index 150 percent. If you read the XAU as an extension of the gold price, years like these make no sense.
This guide explains which 30 stocks are in the XAU, how Nasdaq weights them and why the index moves differently from gold and silver. You will see an own chart since 1983, a comparison with gold, a recalculated weighting table and whether you can buy the index at all. This article follows our editorial policy and is for education, not investment advice.
XAU index in 30 seconds
- A stock index of 30 gold and silver mining stocks, calculated by Nasdaq. Its official name is the PHLX Gold/Silver Sector Index; apart from the symbol it has nothing to do with the gold price XAU/USD.
- Weighted by market value, but with caps. At each quarterly rebalance no stock may get more than 8 percent, and outside the five largest no more than 4 percent.
- Not only miners. Five royalty and streaming companies such as Wheaton Precious Metals and the copper group Freeport-McMoRan add up to just over 28 percent, by our recalculation.
- In our ten-year weekly analysis, the index swung more than twice as much as gold. Since 1983 it has fallen by more than half four times, the deepest from 2011 to 2016 at 83 percent.
- We found no fund that tracks the XAU. Familiar miner ETFs such as GDX follow other indices; on the XAU itself there are options in the US.
What is the XAU index?
The XAU index, officially the PHLX Gold/Silver Sector Index, is a Nasdaq stock index that tracks the share prices of 30 listed companies from the gold and silver industry. It is weighted by market value with caps and calculated in US dollars.
The index is not a security you can buy; it is a yardstick for the sector’s shares, not for the metal. You can only get it through products that track it, or through its single stocks.
The symbol XAU is easy to mix up. In forex and CFD trading, XAU/USD is the gold price in dollars per troy ounce, and XAG/USD is silver. The XAU index measures stocks and is quoted in points. If you type “XAU” into a trading platform, you usually land on the metal, not the index. Our gold price forecast covers the metal itself, and the silver price forecast covers silver.
Each platform shows the index under a different symbol. At Nasdaq it is XAU, at Yahoo ^XAU, at Google INDEXNASDAQ: XAU. Many sites call it the Philadelphia Gold and Silver Index, after the former Philadelphia Stock Exchange, which today belongs to Nasdaq as Nasdaq PHLX. Besides the usual price index without dividends, Nasdaq calculates a version with dividends reinvested under the symbol XXAU. On 9 November 2026 the price index closed at 369.23 points.
Which stocks are in the XAU index?
The XAU currently has 30 members, chosen by fixed rules in Nasdaq’s methodology. The main eligibility rules are in the methodology, version of October 2026:
- Industry: the stock must be classified under the Industry Classification Benchmark (ICB) as gold mining or platinum and precious metals, and the company’s primary business must be gold or silver mining. Stocks that were already in the index on 31 October 2008 are exempt from this rule.
- Listing: the stock must be listed on a US exchange. Common stocks, American Depositary Receipts (ADRs) and some other share types qualify.
- Size and trading: at least $100 million market value to be added and $60 million to stay. On top, a monthly volume of at least 1.5 million shares in each of the last six months and six full months of trading.
- Options: the stock must have listed options in the US or be eligible for them.
A US listing does not mean the company is American. Agnico Eagle is based in Canada, Gold Fields in South Africa, Buenaventura in Peru. Several members trade in New York as depositary receipts. That is why the methodology even limits the weight of foreign stocks without exchange surveillance agreements. Of the 30 members, Nasdaq lists 24 on the NYSE, three on NYSE American and three on Nasdaq.
| Company (symbol) | Exchange | Model weight |
|---|---|---|
| Newmont (NEM) | NYSE | 8.8% |
| Agnico Eagle Mines (AEM) | NYSE | 8.7% |
| Wheaton Precious Metals (WPM) | NYSE | 8.4% |
| Barrick Mining (B) | NYSE | 8.3% |
| Freeport-McMoRan (FCX) | NYSE | 7.3% |
| Royal Gold (RGLD) | Nasdaq | 4.8% |
| Franco-Nevada (FNV) | NYSE | 4.4% |
| Gold Fields (GFI) | NYSE | 3.9% |
| AngloGold Ashanti (AU) | NYSE | 3.9% |
| Pan American Silver (PAAS) | NYSE | 3.6% |
| Alamos Gold (AGI) | NYSE | 3.5% |
| Coeur Mining (CDE) | NYSE | 3.5% |
| Kinross Gold (KGC) | NYSE | 3.3% |
| Iamgold (IAG) | NYSE | 2.9% |
| Harmony Gold (HMY) | NYSE | 2.9% |
| Hecla Mining (HL) | NYSE | 2.6% |
| Eldorado Gold (EGO) | NYSE | 2.6% |
| First Majestic Silver (AG) | NYSE | 2.0% |
| B2Gold (BTG) | NYSE American | 1.9% |
| Buenaventura (BVN) | NYSE | 1.9% |
| OR Royalties (OR) | NYSE | 1.9% |
| Sibanye-Stillwater (SBSW) | NYSE | 1.8% |
| Triple Flag Precious Metals (TFPM) | NYSE | 1.8% |
| SSR Mining (SSRM) | Nasdaq | 1.5% |
| Centerra Gold (CGAU) | NYSE | 1.2% |
| Seabridge Gold (SA) | NYSE | 0.8% |
| Novagold Resources (NG) | NYSE American | 0.8% |
| Perpetua Resources (PPTA) | Nasdaq | 0.7% |
| McEwen (MUX) | NYSE | 0.2% |
| Idaho Strategic Resources (IDR) | NYSE American | 0.1% |
All 30 members according to the Nasdaq index page (list of 10 November 2026, the same on every reference date we checked since 22 December 2025). Nasdaq shows the weights only to logged-in clients, so the weights here are our own recalculation under the methodology: market value on the reference date of 31 August 2026, caps of 8 and 4 percent, then carried forward with the prices to the close of 9 November 2026. With these weights, our model index was never more than 0.24 percent away from the official index level from 21 September to 9 November 2026. That supports the calculation but does not replace an official weighting. Share counts approximated from the market value reported by Nasdaq.
The five largest members add up to just over 41 percent, the ten largest to about 62 percent. Grouped by main business, our recalculation gives this picture: gold and silver producers about 69 percent, royalty and streaming companies 21 percent, the copper group Freeport-McMoRan just over 7 percent and three developers without current production together just over 2 percent. The groups are our own split by main business, not the official industry classification.
A royalty or streaming company finances other operators’ mines. In return it receives a fee on the mine’s revenue (royalty) or the right to buy part of the output at a price fixed in advance (stream).
Royalty and streaming companies do not run their own mines. Wheaton Precious Metals, Franco-Nevada, Royal Gold, OR Royalties and Triple Flag finance other operators’ mines and receive part of the output or revenue in return. They carry the price risk of the metals, while the operators carry the mines’ running costs.
The name promises more silver than the index holds. Only First Majestic Silver and Pan American Silver have silver in their name, together about 5.6 percent. Freeport-McMoRan earns most of its money from copper. The methodology lets stocks that were in the index in 2008 stay even if they do not meet today’s industry rule. Our silver stocks guide profiles the individual silver companies.
How is the XAU index weighted and calculated?
A market-value-weighted index gives large companies more weight than small ones. In the XAU, this weight is capped in two stages each quarter, so that a few giants cannot dominate the index.
The two stages work like this. First, Nasdaq divides each stock’s market value by the total market value of all 30. In stage 1, no stock may exceed 8 percent. In stage 2, the five largest keep their stage 1 weight, and all others are capped at 4 percent. Whatever is cut off is spread over the remaining stocks.
Without the caps, Newmont would have weighed about 15 percent on the reference date of 31 August 2026, Freeport-McMoRan almost 13 and Agnico Eagle almost 12 percent. The five largest would have reached about 56 percent; after the caps it is 40. Smaller members such as Royal Gold or Pan American Silver gain weight as a result. That makes the XAU more diversified than a pure market-value index, but less even than an equal-weighted one.
| Step | Rule | 2026 |
|---|---|---|
| Reference date | last trading day of February, May, August, November | 31 Aug, next 30 Nov |
| Announcement | after the close, six trading days before the start | about a week before |
| Start | first trading day after the third Friday of March, June, September, December | 21 Sep, next 21 Dec |
Rebalance schedule according to Nasdaq’s methodology, October 2026 version. The 2026 dates are our own reading of the trading calendar.
Between rebalances, the weights move with the prices. The caps apply only on the rebalance day. If a stock rises strongly afterwards, it can grow above 8 percent until the next rebalance cuts it back. An ongoing limit in the methodology, checked in January and July: no stock may weigh more than 30 percent, the three largest no more than 60 percent together, and the index must hold at least nine stocks.
New members join only when needed. If a stock drops out, for example after a takeover or delisting, Nasdaq picks a replacement by market value, price and price change over the last six months. On every reference date we checked since 22 December 2025, the list was the same. Between November and December 2025, New Gold left and Idaho Strategic Resources joined. Nasdaq calculates the index level from the sum of the weighted market values divided by a divisor, which offsets events such as splits and spin-offs.
The rules for options are not the rules for the index. Some sources describe the XAU using the requirements for options trading on PHLX. For the membership, only the index methodology counts. Our SOX index guide shows capped weighting in another Nasdaq sector index.
History: from the Philadelphia Gold and Silver Index to Nasdaq
According to Nasdaq, the index began on 19 January 1979 at a base value of 100 points. On 19 December 1983, options trading on the XAU started on the Philadelphia Stock Exchange. Both dates are in Nasdaq’s index description and in the options contract sheet. The base date and the start of options trading are two different dates.
Freely available daily prices go back only to December 1983. The years 1979 to 1983 therefore cannot be charted. Nasdaq’s own series also has gaps: before 18 August 1989 and in early 1996 it shows frozen values for weeks. For the period to October 2016, our charts therefore use the Yahoo daily series, which comes from Nasdaq’s data feed, and the official Nasdaq closes after that.
With the Philadelphia Stock Exchange, the index came to Nasdaq. Today Nasdaq runs the exchange as Nasdaq PHLX and calculates the XAU alongside sector indices such as the SOX. The membership has changed with the industry. Nasdaq’s factsheet from 2015 still lists Goldcorp and Randgold among the largest members, which no longer exist as separate stocks.
How has the XAU index performed?
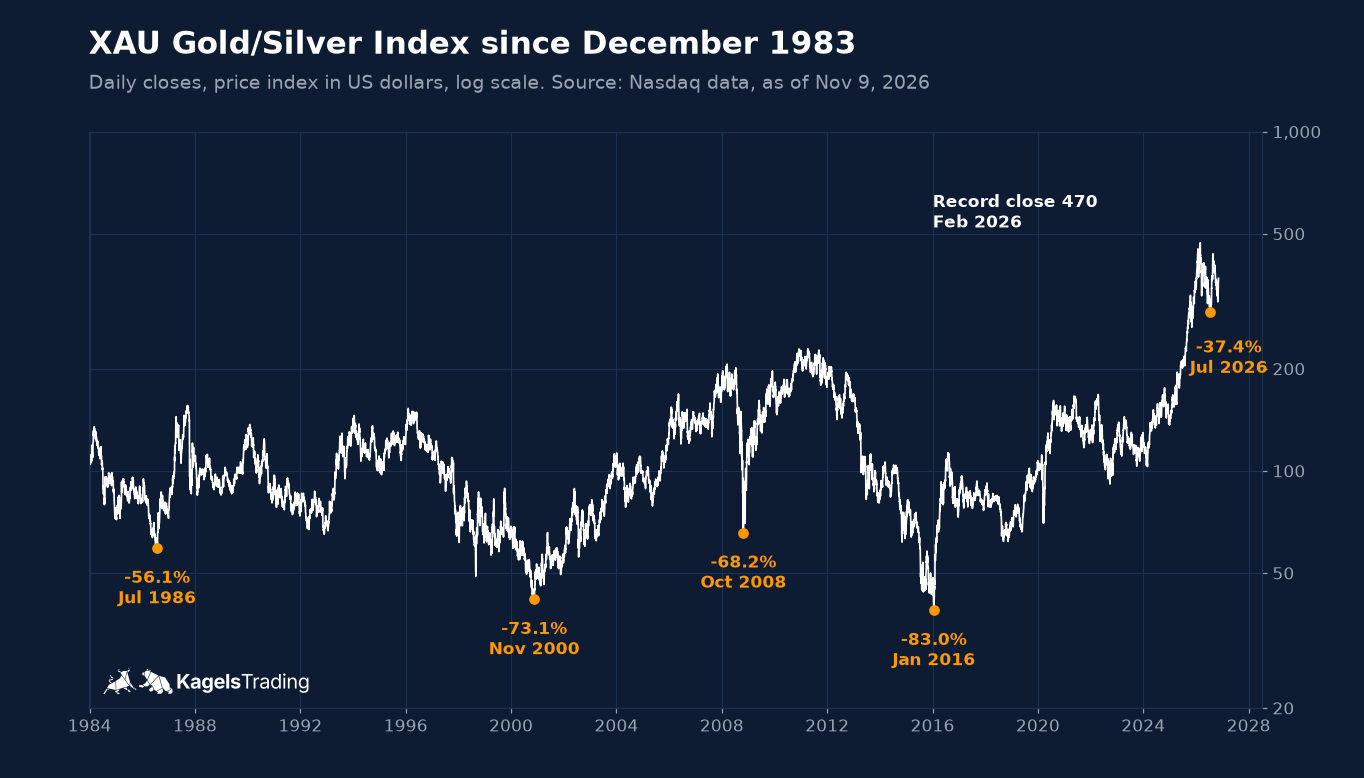
In almost 43 years the XAU has only just over tripled, with slumps of up to 83 percent along the way. Our daily series starts on 19 December 1983 at 107 points. On 9 November 2026 the index stood at 369 points, about 2.9 percent a year without dividends. The record close is 470.37 points from 27 February 2026; the latest level is just over 21 percent below it.
 Click to enlarge
A price index measures only the price changes of its stocks. Dividends paid out are not included, unlike a version with dividends reinvested such as the XXAU.
The index fell by more than half four times. The chart above marks these declines in orange. Each is measured from the highest close up to then to the lowest close before the next high. On a log scale equal percentage moves look equally large, which shows that the 2011 to 2016 decline was deeper than the slump in the financial crisis.
| High to low | Decline | Gold price at the time |
|---|---|---|
| 04/2011 to 01/2016 | −83.0% | gold fell 45% from its 09/2011 high to 12/2015 |
| 09/1987 to 11/2000 | −73.1% | long weak phase for gold |
| 03/2008 to 10/2008 | −68.2% | financial crisis, gold fell much less |
| 03/1984 to 07/1986 | −56.1% | gold weak after its 1980 high |
| 02/2026 to 07/2026 | −37.4% | running, gold also below its high |
Declines of the XAU on a closing basis (exact days: 8 Apr 2011 to 19 Jan 2016, 18 Sep 1987 to 17 Nov 2000, 14 Mar 2008 to 27 Oct 2008, 5 Mar 1984 to 25 Jul 1986, 27 Feb 2026 to 20 Jul 2026). For 2008 the Yahoo values differ from the Nasdaq series by up to 2 percent; the depth is 68 to 69 percent in both. The gold backdrop is context, not a proven cause. Own calculation as of 9 November 2026.
| Year | XAU | Gold |
|---|---|---|
| 2016 | +74.1% | +8.5% |
| 2017 | +8.1% | +13.1% |
| 2018 | −17.1% | −1.5% |
| 2019 | +51.3% | +18.3% |
| 2020 | +34.9% | +25.0% |
| 2021 | −8.1% | −3.6% |
| 2022 | −8.8% | −0.2% |
| 2023 | +4.0% | +13.1% |
| 2024 | +9.1% | +27.2% |
| 2025 | +149.5% | +64.5% |
| 2026 to 9 Nov | +7.9% | −4.2% |
Calendar-year change, close to close. XAU as a price index without dividends (official Nasdaq closes), gold as the spot price XAU/USD in dollars per troy ounce (Twelve Data, daily close in UTC) without the costs of an investment product. Own calculation.
The table shows that the miners index is neither always stronger nor always weaker than gold. The XAU led in five of the eleven years and lagged in six. In 2023 and 2024 gold rose clearly while the mining stocks rose much less. In 2025 they more than made up for it with a gain of almost 150 percent. With swings this large, your position size matters.
Why does the XAU move differently from gold and silver?
Mining stocks react to the metal price with leverage, because a large part of their costs is fixed. If the price rises, the margin grows faster than the price. If it falls, the margin shrinks faster. This effect is called operating leverage.
A simple example shows the leverage. If producing an ounce costs $1,500 and gold is at $2,000, the margin is $500. If gold rises 10 percent to $2,200, the margin grows 40 percent to $700. If gold falls 10 percent, it shrinks just as much. The numbers are an illustration, not the costs of any particular company.
In our analysis, the XAU swung more than twice as much as gold over the last ten years. On a weekly basis, annualized volatility was 36.5 percent for the XAU and 15.3 percent for gold. When gold moved 1 percent in a week, the XAU moved on average 1.9 percent in the same direction. The correlation of weekly returns was 0.80. These are ten-year averages, not a fixed factor for next week.
Correlation measures how closely two prices move together. It ranges from minus 1 (always opposite) to plus 1 (always together) and says nothing about how large the moves are.
 Click to enlarge
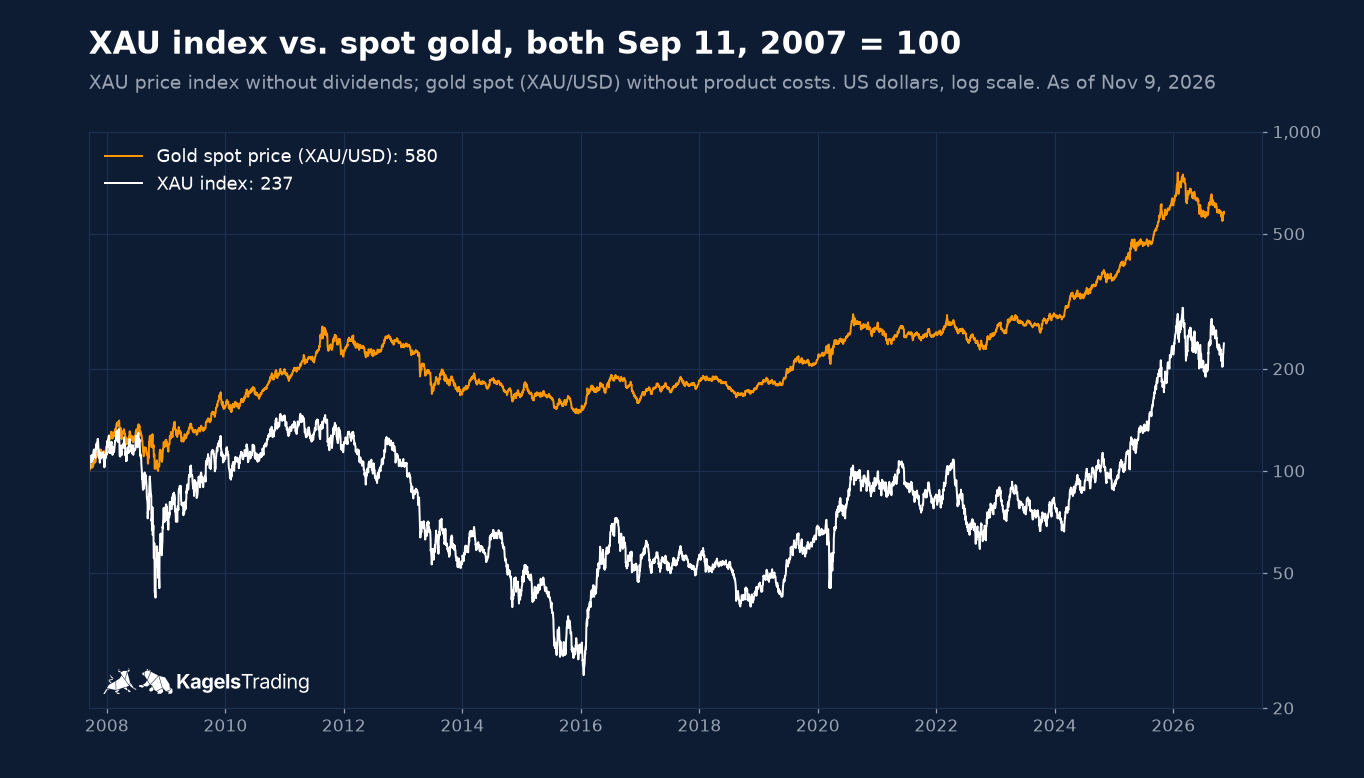
Source: XAU data from Nasdaq, gold spot via Twelve Data, chart by Kagels Trading.
Over 19 years, gold has clearly beaten the miners index, as the chart above shows. From 11 September 2007 to 9 November 2026 the gold price rose to 5.8 times its starting level, the XAU only to 2.4 times. Dividends are missing from this comparison because the price index leaves them out. We did not calculate how much they account for, since the version with dividends (XXAU) was not freely available for this period. What the chart does show is pronounced underperformance of the XAU in phases such as 2011 to 2015, when gold fell about 45 percent and the XAU more than 80 percent.
Why the leverage is not reliable comes down to the companies themselves. These factors decide whether a higher metal price reaches shareholders:
- Costs: energy, wages and materials often rise along with the gold price. Then the margin grows less than expected.
- Output and reserves: depleted mines must be replaced. New projects cost billions and are often delayed.
- Financing: interest reduces profit, and repayments use cash. A company that issues new shares spreads its profit over more shares. This dilution hits developers without current production in particular.
- Currencies: many miners pay costs in Canadian dollars, rand or soles but sell in US dollars. Exchange rates shift the margin.
- Country risk: taxes, permits and expropriation in producing countries can hit a company overnight.
- Hedging: companies that sell their output in advance at fixed prices gain less from rising prices.
Gold and silver themselves do not carry these risks. The metal price is a reference price without a balance sheet; the stock is a company with management and debt. Looking back, there were phases when the XAU ran ahead of the gold price and others when it lagged. We could not derive a reliable rule for which one leads from our data.
XAU, HUI and GDX: how do they differ?
Three symbols often appear side by side, but they mean three different things. The XAU is Nasdaq’s sector index. The HUI, officially the NYSE Arca Gold BUGS Index, is a pure gold miners index run today by ICE. GDX is not an index but a VanEck fund that follows a third index.
| Symbol | What it is | Rules and weighting |
|---|---|---|
| XAU | Nasdaq index, 30 gold and silver stocks, US listings only | market value, caps of 8 and 4%, public methodology |
| HUI | Gold miners index from ICE, formerly NYSE Arca Gold BUGS | no current rule book freely available |
| GDX | VanEck ETF on the MarketVector Global Gold Miners Index | under that index’s rules, global |
XAU according to Nasdaq’s methodology (October 2026). HUI: we found no current rule book in ICE’s freely accessible documents on 10 November 2026; prices via Yahoo Finance (^HUI). GDX: index according to the VanEck product page, read on 10 November 2026.
In price, the XAU and HUI are almost twins; in construction they are not. The daily returns of the two indices had a correlation of 0.98 over the last ten years. In 2025 the XAU rose 149.5 percent and the HUI 154.6 percent, both as price indices. By name and description, however, the HUI is a pure gold miners index, and we could not retrieve its current member list freely. In some phases it can therefore move differently from the XAU.
A historical label for the HUI should not be taken over unchecked. The name BUGS is usually spelled out as “Basket of Unhedged Gold Stocks”, meaning gold stocks without hedging of the selling price. Whether this is still an eligibility rule today could not be confirmed from the current, freely accessible documents. We therefore treat it as a historical description, not as a rule in force.
Similar stocks do not mean the same index. GDX holds many of the stocks that are also in the XAU, but follows its own global index with its own rules. Our gold stocks guide covers individual gold miners and the main miner ETFs.
Can you invest in the XAU index?
You cannot buy the XAU directly, and we found no fund that tracks it. On 10 November 2026 we checked Nasdaq’s index page, the documents of the familiar miner ETFs and a general search. That is a search finding, not proof that no such product exists anywhere.
There are options on the index itself in the US. They trade on Nasdaq PHLX and, according to the contract sheet, are settled in cash; one point equals $100. They are American style, so they can be exercised on any business day up to expiration. That is what the contract sheet and Nasdaq Trader’s contract description say. The general product page for the PHLX sector options mentions European style, but according to Nasdaq Trader that applies only to BKX and OSX. If you want to trade them, check the current contract sheet with your broker. Our guide to options trading for beginners explains how options work.
Miner ETFs are not XAU funds. GDX follows the MarketVector Global Gold Miners Index, other funds follow other indices. They hold similar companies, but under different rules and with different weights. By its index name GDX is global, while the XAU only takes US listings.
Outside the US, access depends on local rules. In the European Union, retail brokers generally cannot offer a fund to retail investors without the key information document that the PRIIPs regulation requires, and US-domiciled ETFs usually do not provide one. For non-dollar investors, currency risk comes on top.
If you want to rebuild the XAU, you would have to buy 30 stocks yourself and rebalance every quarter. That costs fees and effort. With just a few single stocks, you take a very different risk from the broad index.
Strengths and limits of the XAU index
The XAU is a proven yardstick for mining stocks, but no substitute for the metal price and no signal generator. It bundles 30 gold and silver stocks in one number, with daily data since 1983. Its rules are public: eligibility, caps and dates are in the methodology. The caps stop one or two giants from moving the index on their own, and next to the gold price it shows whether the market trusts the miners more or less than the metal.
Its limits are just as clear. It measures stocks, not gold or silver, and in our ten-year weekly analysis it swung more than twice as much as gold. It also holds royalty companies and a copper group, and silver plays a small role. Nasdaq does not publish the weights freely, so you have to recalculate them. And there is no fixed rule on whether the XAU runs ahead of the gold price.
XAU index: our conclusion
Since 1979 the XAU has measured gold and silver miners, meaning stocks and not metal. It holds 30 members weighted by market value with caps, shaped by Newmont, Agnico Eagle, Wheaton Precious Metals, Barrick and Freeport-McMoRan. Royalty companies and copper together make up more than a quarter.
In our ten-year weekly analysis it swung more than twice as much as gold, and since 1983 it has fallen by more than half four times. Over 19 years, as a price index, it lagged the gold price clearly. Our assessment: the XAU works well as a second look next to the gold chart, to see whether investors currently trust the miners more or less than the metal. We would not use it as a substitute for gold or as a timing signal for purchases; the phases in which the two drift apart are too long for that.
When investing, the small print decides. We know of no fund on the XAU, and the common miner ETFs follow other indices. If you want to bet on the sector, check the index in the factsheet, its weighting and whether the product is available to you. Our Dow Jones Transportation Average guide explains another sector index in the same way.
Frequently asked questions about the XAU index
What does the XAU index measure?
The XAU is a Nasdaq stock index of 30 gold and silver mining stocks. Its official name is the PHLX Gold/Silver Sector Index, and many sites call it the Philadelphia Gold and Silver Index. It is weighted by market value with caps and calculated in US dollars.
Is the XAU index the same as XAU/USD?
No, the two only share a symbol. XAU/USD is the gold price in dollars per troy ounce; the XAU index is a stock index in points. In our weekly analysis of the last ten years, the index swung more than twice as much as gold.
Which stocks are in the XAU index?
The index holds 30 stocks. By our recalculation, Newmont, Agnico Eagle, Wheaton Precious Metals, Barrick and Freeport-McMoRan had the largest weights on 9 November 2026, each between 7 and 9 percent. The full list is in our table above.
How often is the XAU index rebalanced?
Nasdaq adjusts the weights every quarter. The changes take effect in March, June, September and December. New members join only when a stock drops out or the index breaks minimum rules. The next rebalance takes effect on 21 December 2026.
What is the difference between the XAU and the HUI?
The XAU holds gold and silver stocks, royalty companies and the copper group Freeport-McMoRan, and Nasdaq calculates it. The HUI is a pure gold miners index from ICE. In price the two moved almost identically over the last ten years, with a correlation of daily returns of 0.98.
Is there an ETF on the XAU index?
We did not find a fund that tracks the XAU. Familiar miner ETFs such as GDX follow other indices. On the XAU itself there are options in the US, settled in cash.
This English edition is based on our German edition on kagels-trading.de and has been adapted for international readers.
More Stocks & Commodities guides
- Choose a silver stock
Best Silver Stocks 2026: 10 Companies Compared
Ten silver producers, streamers and explorers compared on 2025 output, costs, dividends and chart levels after the record highs of early 2026.
- Choose a gold stock
Best Gold Stocks 2026: Miners and Royalty Companies
Eleven gold producers, royalty companies and developers compared on output, costs, dividends and 2026 takeovers, plus gold miner ETFs.
- Choose an oil stock
Best Oil Stocks 2026: Majors, Pipelines and Refiners
The largest oil producers, pipelines and refiners by market value and dividend, the MLP tax traps and the main energy ETFs.
- Choose a chip stock
Semiconductor Stocks 2026: AI Chips, Memory and Equipment
Chip designers, foundries, memory and equipment makers by market value, revenue and guidance, plus how the main semiconductor ETFs differ.
- Compare defense stocks
Defense Stocks 2026: US and European Stocks Compared
US and European defense stocks compared by backlog and price moves since 2025, what the main defense ETFs hold and the risks by region.
- Track sector rotation
Sector Rotation: How to Spot Shifts in Market Leadership
Read an XLE/SPY ratio chart, check the business-cycle model against three recessions and see our 27-year sector momentum backtest.