
Stock Market Crash: Causes, Patterns and Lessons


Contents
- Stock market crash in 30 seconds
- What is a stock market crash?
- The big crashes in numbers
- Typical causes of a stock market crash
- Speculation and leverage
- How a crash unfolds
- Safety brakes: circuit breakers and central banks
- Effects on the economy and society
- Lessons from past crashes
- A realistic view of risk
- Crashes in the long-term context
- Frequently asked questions about stock market crashes
- Sources
- About the author
A stock market crash is a very large and very fast fall in share prices. Within days or a few weeks, indexes lose a double-digit percentage, confidence breaks and economic uncertainty spreads. Many investors feel taken by surprise, although in hindsight there were often clear warning signs. Understanding the mechanics behind a crash helps you judge market risk more realistically.
Crashes are not new, and they rarely have a single cause. Ever since organized capital markets have existed, phases of exaggeration have been followed by abrupt corrections. The causes usually come from a mix of economic, psychological and structural factors. This guide shows the big crashes in numbers, explains the typical causes and patterns, and ends with the lessons that matter for your own money.
Stock market crash in 30 seconds
- A crash is a sudden, deep fall of the whole market. There is no official threshold; the speed of the fall matters as much as its size.
- The worst crash in the S&P 500 data was 1929 to 1932: minus 86% from the September 1929 high. The Dow fell 89% and needed until November 1954 to regain its 1929 peak.
- The worst single day was Black Monday, October 19, 1987: the Dow fell 22.6%, the S&P 500 20.5%.
- Common causes are high valuations, borrowed money, rising rates and a shock that turns the mood. Forced selling then feeds the fall.
- Recovery took between six months (2020) and 25 years (1929) for the S&P 500 to close at a new record, without dividends.
What is a stock market crash?
A stock market crash is a very strong and rapid fall in prices on one or more stock markets. Typical are double-digit percentage losses within a few days or weeks. What makes a crash is not only the size of the decline but also its speed. There is no official definition from an exchange or a regulator.
In a crash, orderly price finding breaks down. Sell orders clearly outweigh buy orders, liquidity dries up and panic reactions speed up the fall. That is why the word is kept for exceptional events and not used for every bad week. A crash and a bear market are not the same thing either: the usual market convention calls a 10% fall from a high a correction and a 20% fall a bear market, while a crash describes how fast the fall happens.
| Term | Usual meaning | Speed |
|---|---|---|
| Correction | 10% to 20% below the last high | Weeks to months |
| Bear market | 20% or more below the last high | Months to years |
| Crash | Sudden double-digit fall | Days to a few weeks |
Market conventions, not official rules. A crash can start a bear market (1929, 2020) or stay a short episode within a rising market (1987).
The big crashes in numbers
The S&P 500 shows how different crashes can be in depth and length. The table uses daily closes since December 1927. It measures each fall from the record close before it to the lowest close, and the time until the index closed at a new record again. All figures are without dividends and without inflation adjustment, so the real recovery took longer in some cases and shorter in others once dividends are included.
| Record to low | Decline | New record |
|---|---|---|
| Sep 1929 to Jun 1932 | −86.2% | 25 years |
| Aug to Dec 1987 | −33.5% | 1.9 years |
| Mar 2000 to Oct 2002 | −49.1% | 7.2 years |
| Oct 2007 to Mar 2009 | −56.8% | 5.5 years |
| Feb to Mar 2020 | −33.9% | 0.5 years |
S&P 500 daily closes from Yahoo Finance (before 1957 the S&P 90 predecessor index), own calculation. Record close to lowest close: Sep 16, 1929 at 31.86 to Jun 1, 1932 at 4.40; Aug 25, 1987 at 336.77 to Dec 4, 1987 at 223.92; Mar 24, 2000 at 1,527.46 to Oct 9, 2002 at 776.76; Oct 9, 2007 at 1,565.15 to Mar 9, 2009 at 676.53; Feb 19, 2020 at 3,386.15 to Mar 23, 2020 at 2,237.40. Years counted from the record close to the first close above it: Sep 22, 1954, Jul 26, 1989, May 30, 2007, Mar 28, 2013 and Aug 18, 2020.
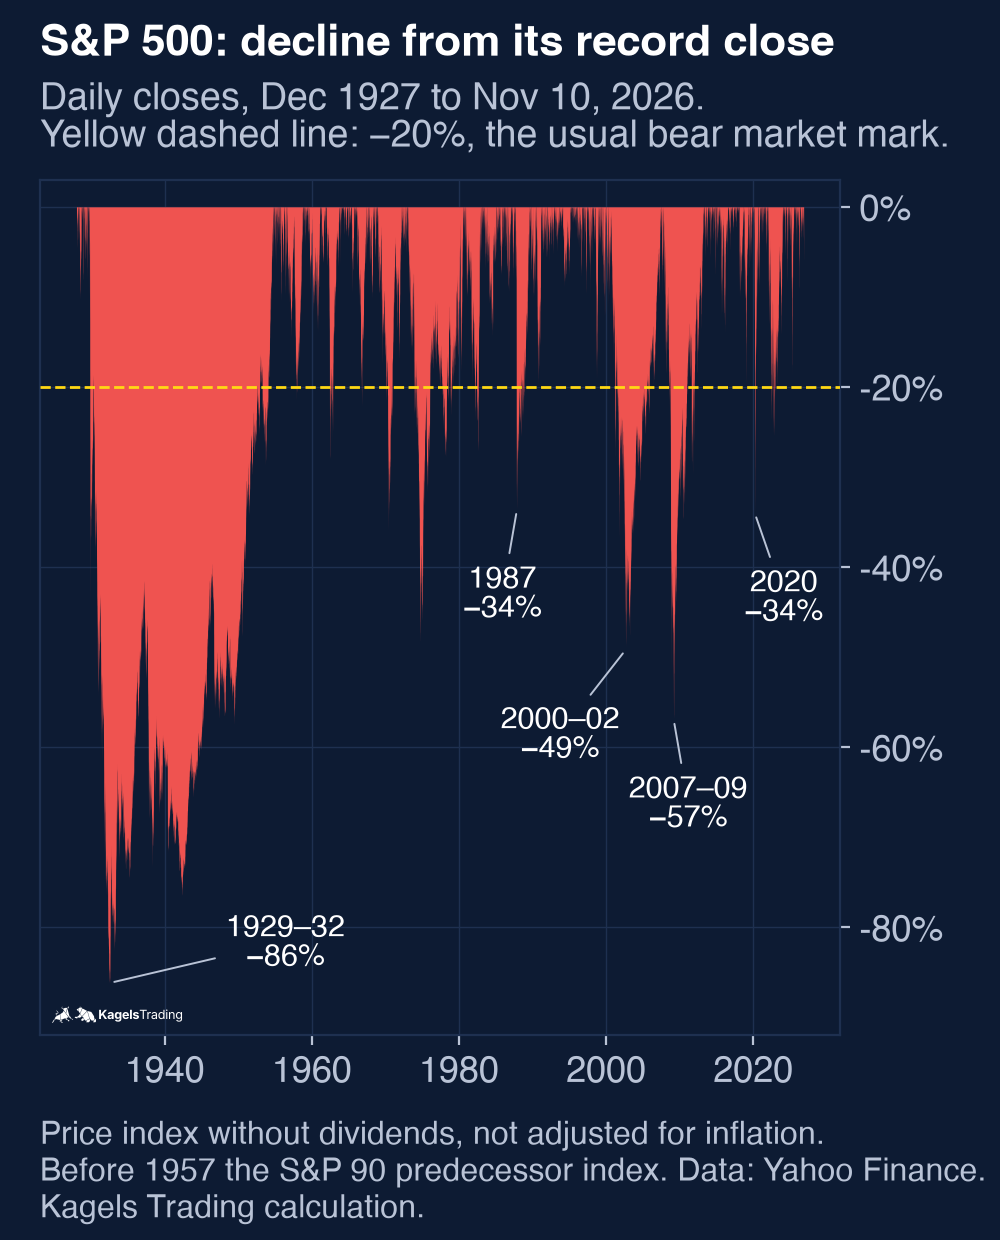 Click to enlarge
The chart puts the famous crashes into the full history since 1928. By our count on closing prices, the S&P 500 has fallen 20% or more below a record close in 12 separate episodes since 1929, the last one in 2022 (minus 25.4%). We count one continuous decline until the index closes above its previous record, so further falls before that recovery stay part of the same episode; that is why 1929 to 1954 counts once. Other bear market lists use different rules and arrive at different numbers. Most of these were slow bear markets. Only a few came with the speed that earns the word crash. On November 10, 2026, the index closed at 7,520.93, 3.8% below its record close of 7,818.93 from October 6, 2026.
1929: Black Monday and Black Tuesday
The crash of 1929 deepened an economic downturn that had already begun. Federal Reserve History dates the start of the Great Depression to August 1929, before the crash. According to the same source, the Dow Jones fell nearly 13% on Monday, October 28, 1929, and nearly 12% on Black Tuesday the next day. From its peak of 381.17 on September 3, 1929, the Dow fell to 41.22 on July 8, 1932, 89% below its peak. High valuations, borrowed money and weak regulation came together: buyers often put down only about 10% of the price and borrowed the rest.
1987: the worst single day
On October 19, 1987, the Dow fell 22.6% in one session. That is still its largest one-day percentage loss; it closed 508 points lower. The S&P 500 lost 20.5% that day. Federal Reserve History names portfolio insurance as an accelerator: a hedging method with futures that sold more as prices fell, so the first losses triggered further rounds of selling. How one trader was prepared for that October is told in our portrait of Paul Tudor Jones.
The market recovered faster than many expected. On October 20, 1987, the Federal Reserve said it stood ready “to serve as a source of liquidity”. The S&P 500 was back at a record close in July 1989, less than two years after its August 1987 high. 1987 is the best example that a crash does not always lead to a long bear market or a recession.
2000 to 2002 and 2007 to 2009
The dot-com bust and the financial crisis were slow crashes that lasted years. After the tech bubble, the Nasdaq Composite fell from 5,048.62 on March 10, 2000 to 1,114.11 on October 9, 2002, a loss of 77.9%, and only closed above its old record in April 2015. In the financial crisis, complex mortgage products and highly leveraged banks spread the losses; the S&P 500 lost 56.8% between October 2007 and March 2009.
2020: the fastest bear market
In 2020, the S&P 500 needed only 23 trading days to fall 33.9%. The pandemic hit an expensive market. Central banks and governments reacted fast and on a huge scale, and the index closed at a new record in August 2020, about six months after the high. In March 2020 the circuit breakers stopped trading on four days, more on that below.
Typical causes of a stock market crash
Most crashes start with an imbalance that a shock then exposes. Overvalued markets, rising interest rates or falling company profits create a fragile setting. Once an external shock comes on top, the mood can turn quickly. The shock is often not the deepest cause, it is only the trigger.
Psychology drives both the rise before and the fall after. In rising markets, the willingness to take risk grows and warning signs are ignored. When the mood turns, fear and uncertainty increase the pressure to sell. Technical factors add speed: in 1987 it was portfolio insurance, today it can be automated trading systems that all react to the same signals.
Warning signs in market breadth often appear before the big falls, but they are not reliable timing tools. When fewer and fewer stocks carry an index, the rise becomes thinner. How well one such breadth signal really worked, we tested on the Hindenburg Omen: after 21 signal clusters since 2017, SPY fell 10% or more within six months in only 7 of 20 complete cases.
Speculation and leverage
Speculation becomes a problem when it is financed with borrowed money. Leverage increases possible gains but also the risk of loss. In a falling market, leveraged positions lead to forced sales, which push prices down further. That chain of margin calls and forced selling ran through 1929, 1987 and 2008.
In a US margin account, the rules set clear limits. Under the Federal Reserve’s Regulation T, you can borrow up to 50% of the purchase price of a stock. FINRA Rule 4210 then requires equity of at least 25% of the market value of the securities, and many brokers ask for 30% to 40%. If your equity falls below that level, your broker may issue a margin call or sell your positions without notifying you first. Our guide to account equity shows the calculation with a worked example.
Leveraged products such as CFDs, futures and options make this risk sharper. Over-the-counter CFDs are generally not available to ordinary retail investors in the US: stock CFDs count as security-based swaps, which may be sold to such investors only on a registered exchange, and the SEC has acted against platforms that offered them to US retail clients. Futures, options and leveraged ETFs are available. They are not suitable for every investor and need experience. In the EU, CFD providers must show the share of their retail accounts that lose money; when ESMA restricted CFDs in 2018, its analysis found that 74% to 89% of retail accounts typically lost money.
How a crash unfolds
Every crash is different, but the sequence is often similar. The fall often begins with single pieces of bad news that have little effect at first. As uncertainty rises, losses spread to more market segments and more investors start to sell. The market then reaches the acute phase.
In the acute phase, emotions dominate. Investors sell regardless of fundamentals to raise cash or to meet margin calls. Only after a period of stabilization does a more sober valuation return. This sequence explains why recoveries usually start only after large losses, and why the lowest point is rarely visible while it happens.
Safety brakes: circuit breakers and central banks
After 1987, US exchanges introduced market-wide circuit breakers. They are based on the fall of the S&P 500 against the previous day’s close. A decline of 7% (Level 1) or 13% (Level 2) before 3:25 p.m. Eastern Time halts trading for 15 minutes; at or after 3:25 p.m. these two levels no longer stop trading. A decline of 20% (Level 3) closes the market for the rest of the day.
In March 2020, the Level 1 breaker was triggered on four days: March 9, 12, 16 and 18. Before that, market-wide halts had happened on only one previous trading day, October 27, 1997, under the older rules. A halt does not stop a crash. It gives investors time to think and the market time to find buyers.
Central banks and governments are the second brake. In 1987, 2008 and 2020, the Federal Reserve provided liquidity to keep the financial system working. How effective such measures are depends on the starting point: when interest rates are already low, there is less room to cut, and high inflation limits how far a central bank can ease.
Effects on the economy and society
The effects of a crash reach far beyond the stock market. Falling asset prices reduce consumer spending and investment. Companies postpone projects, the labor market comes under pressure and public budgets carry the burden of support programs and lower tax income.
Not every crash leads to a recession, but the risk rises. The crash of 1987 had no recession after it, while 1929 and 2008 came with deep economic crises. The difference lay mainly in debt and the banking system: when banks themselves are hit, the damage spreads into the real economy.
Lessons from past crashes
The first lesson: excessive euphoria is a warning sign. Prices that rise without matching economic growth or profits make the market vulnerable to sudden corrections. The dot-com bubble with its valuations far from any earnings is the clearest example.
The second lesson: spreading risk softens a crash, but it does not prevent losses. Broad diversification across asset classes and regions reduces the damage. It does not protect you completely, because in a real crash many assets fall at the same time. The most important part is to avoid concentration in one stock, one sector or one leveraged position.
The third lesson: short-term reactions out of fear often lead to poor decisions. Selling at the low turns a temporary loss into a permanent one. A clear plan for position size and loss limits, made before the crash, helps you stay able to act. Our guides to risk management and position sizing show how to set those limits.
A realistic view of risk
A crash makes visible that investing always carries risk. Neither high returns nor calm markets are guaranteed. A realistic view of your own goals and your risk tolerance is the basis of every investment strategy, including the question of how much of a 30% or 50% fall you could sit through.
Historical data is no guarantee for future returns. The table above shows recovery times between half a year and 25 years. Preparation, knowledge and a clear plan help you stay able to act in turbulent markets, whichever of the two you get.
Crashes in the long-term context
Despite their drama, crashes are part of the long-term development of markets. In the past, phases of heavy losses were often followed by recoveries, but their timing and size could not be predicted. What matters is not trying to time a crash exactly, but understanding it as part of the market cycle.
A sober look at causes, patterns and history gives you orientation. It does not replace your own decision, but it helps you judge market risk calmly and avoid unrealistic expectations, in both directions.
Frequently asked questions about stock market crashes
What was the biggest stock market crash in history?
In the US, the biggest crash was 1929 to 1932. The Dow fell 89% from September 1929 to July 1932, the S&P 500 data shows minus 86%. The largest one-day fall was October 19, 1987, when the Dow lost 22.6%.
What is the difference between a crash and a bear market?
A crash describes speed, a bear market describes depth and duration. A bear market is usually defined as a fall of 20% or more from a high. A crash is a sudden double-digit fall within days or weeks; it can start a bear market or stay a short episode, as in 1987.
Can you predict a stock market crash?
No reliable method predicts the date of a crash. Valuations, leverage and market breadth can show that a market is fragile, but fragile markets can rise for years. Even well-known warning signals like the Hindenburg Omen produce many false alarms.
How long does it take the market to recover from a crash?
It varied from months to decades. Without dividends, the S&P 500 needed about six months after 2020, under two years after 1987, 5.5 years after 2007 and 25 years after 1929 to close at a new record. With dividends reinvested, the recoveries were shorter.
What stops a crash on a single day?
In the US, market-wide circuit breakers pause trading. A fall of 7% or 13% in the S&P 500 before 3:25 p.m. Eastern Time halts trading for 15 minutes, a fall of 20% closes the market for the day.
Sources
All figures were checked against primary sources or calculated from index data on November 11, 2026. The crash table and chart are our own calculation from daily closes; other sources may use intraday prices and show slightly different numbers.
- Index data: Yahoo Finance: S&P 500 (^GSPC) history, Nasdaq Composite (^IXIC).
- 1929 and 1987: Federal Reserve History: Stock Market Crash of 1929, Federal Reserve History: Stock Market Crash of 1987.
- Circuit breakers: NYSE trading information, SEC investor bulletin on circuit breakers, Market-Wide Circuit Breaker Working Group report, 2021, NYSE filing of 2020 naming October 27, 1997 as the previous halt.
- CFDs and the Great Depression: SEC action of September 30, 2026 against unregistered brokers selling CFDs to US retail investors, ESMA decision on CFDs, 2018, Federal Reserve History: The Great Depression.
- Margin rules: FINRA Rule 4210, Investor.gov: Understanding Margin Accounts.
This article is educational information, not investment advice. Past market behavior does not guarantee future results.
This English edition is based on our German edition on kagels-trading.de and has been adapted for international readers.
More Risk Management guides
- Manage your trading risk
Risk Management in Trading: Rules, Math, Psychology
The 1% rule, stops, risk/reward, daily loss limits, leverage caps and the psychology of losing streaks, with the math behind each rule.
- Calculate your position size
Position Sizing in Trading: Formula, Calculator, Examples
The formula, a free calculator, the 1% rule explained correctly, and examples for stocks, forex and futures.
- Read your account equity
Account Equity vs Balance: Margin and Free Margin Explained
Equity against balance, margin, free margin and margin level, with a worked example and the close-out rules for cash, US margin and CFD accounts.
- Size your risk per trade
Kelly Criterion for Traders: Formula, Calculator, Risks
The Kelly formula for traders with a calculator, and a simulation of why full Kelly is far too much.
- Check a profit factor
Profit Factor in Trading: Formula, Calculator, Good Values
The formula, a free calculator, what a good value is, and why 61 trades showed 2.22 while 356 trades showed 1.37.
- Keep a trading journal
Trading Journal: How to Record and Review Your Trades
What to write before and after each trade, a completed example with a win and a loss, a weekly review and a template to copy.
- Choose a journal
Best Trading Journal Software 2026: 6 Tools Compared
Six journals compared on price, free plans, refunds, automatic broker sync, costs and export, with a decision guide.
- Check TradeZella
TradeZella Review 2026: Pricing, Features and Limitations
The three plans since July 2026, what Essential leaves out, the no-refund terms, imports, export and what users report.
- Check TraderSync
TraderSync Review 2026: Pricing, Broker Sync and Limits
Plans and dated prices, broker imports and autosync, Market Replay, Cypher and the no-refund policy.
- Check Tradervue
Tradervue Review 2026: Imports, Reports and Costs
Silver or Gold, why net P&L needs Gold, few automatic imports, US-only stocks, the no-refund sign-up terms and how to cancel.
- Check Edgewonk
Edgewonk Review 2026: Features, Costs and Limitations
One feature set billed monthly or yearly, the refund period, MetaTrader auto sync, the psychology tools and our own test journal.
- Check TradesViz
TradesViz Review 2026: Pricing, Broker Sync, Terms
The free stock plan, Pro and Platinum prices checked November 10, 2026, which US brokers sync automatically, the no-refund terms and user reviews.