
OpenMarket Review 2026: Free vs Plus, AI Agents and Limits


Contents
- OpenMarket in 30 seconds
- What is OpenMarket?
- Which markets and data do you get?
- Order flow: heatmap, footprint and liquidations
- AI on the chart: Kata and your own AI
- What does OpenMarket cost? Free vs Plus
- Trading from the chart: paper account, exchanges and prediction markets
- Custom indicators: TypeScript, wrun and Pine import
- Apps and devices
- Is OpenMarket legit?
- OpenMarket or TradingView?
- Pros and cons of OpenMarket
- Who is OpenMarket worth it for?
- Frequently asked questions about OpenMarket
- About the author
An order book heatmap, a footprint chart and liquidations in a free browser chart: that is what OpenMarket offers. On top, an AI such as Claude or ChatGPT can control the chart. I have used TradingView as my main charting software since 2017, so I looked closely at what the newcomer does better and where it still falls short.
This test is based on my own account on the free plan. On November 7, 2026 I set up OpenMarket, connected Claude through its interface, and we checked the AI results against raw exchange data. All screenshots come from this account; prices and limits come from the pricing page inside the account and the terms of use.
OpenMarket in 30 seconds
- Free to use: charts, indicators, drawings and up to 16 charts in one view run in the browser without a subscription.
- Plus: $29 a month billed yearly or $35 billed monthly. It mainly raises the limits.
- Strength: order flow. The order book heatmap, footprint, liquidations and big trades are already in the free plan, with reduced depth.
- AI on the chart: Claude, ChatGPT or Codex set indicators, drawings and alerts. Moving averages and closed-candle highs/lows matched the exchange data exactly in our spot checks, RSI differed slightly, and automatic drawings need checking.
- Limits: CME futures ran 10 minutes delayed on the free plan, US stocks showed an estimated price only, and people in the United States cannot use the wallet trading feature.
What is OpenMarket?
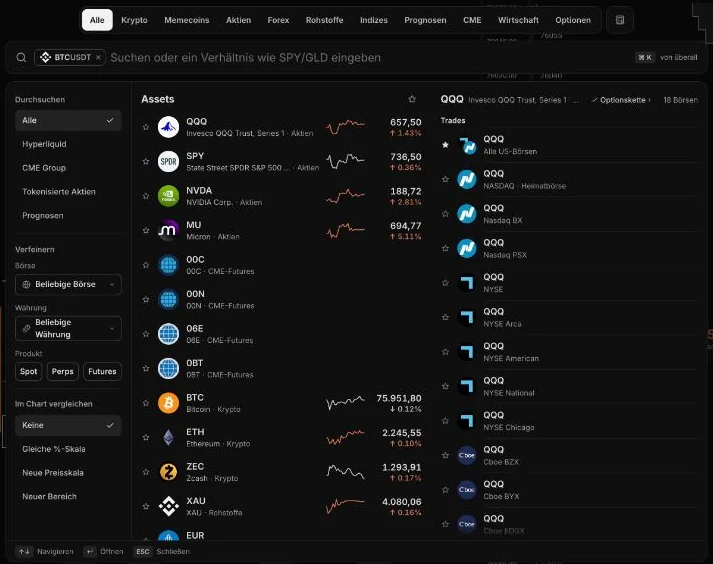
OpenMarket is a browser-based charting platform for crypto, US stocks, futures, options, forex and prediction markets that combines order flow tools with an interface for external AI assistants and is neither an exchange nor a broker.
The platform is run by Thalamus Technologies, Inc., a Delaware corporation. That is stated in OpenMarket’s terms of use; the Google Play listing gives an address in Newark, Delaware. We found no team profile on the pages we checked. The product used to be called Kiyotaka: the old address kiyotaka.ai now redirects permanently to openmarket.xyz, and according to the company blog the second version of Kiyotaka came out in June 2025.
OpenMarket has nothing to do with the messaging company of the same name. The SMS provider OpenMarket belongs to a different group; this review covers only the charting platform at openmarket.xyz.
| Feature | Details |
|---|---|
| Operator | Thalamus Technologies, Inc., Delaware (USA) |
| Former name | Kiyotaka (kiyotaka.ai) |
| Platforms | Browser, desktop app (beta), Android, iOS only as a TestFlight beta |
| Markets | Crypto (29 venues), US stocks, CME futures, options, forex, prediction markets, economic data (company’s own figures) |
| Plans | Free and Plus |
| Languages | Web app includes German; Android app per store listing in six languages |
| AI connection | Claude, ChatGPT, Codex, Cursor through an MCP server |
| Trading | Paper account built in; real orders per the terms through Hyperliquid; OpenMarket holds no funds |
 Click to enlarge
Source: Kagels Trading, screenshot from our OpenMarket account.
Which markets and data do you get?
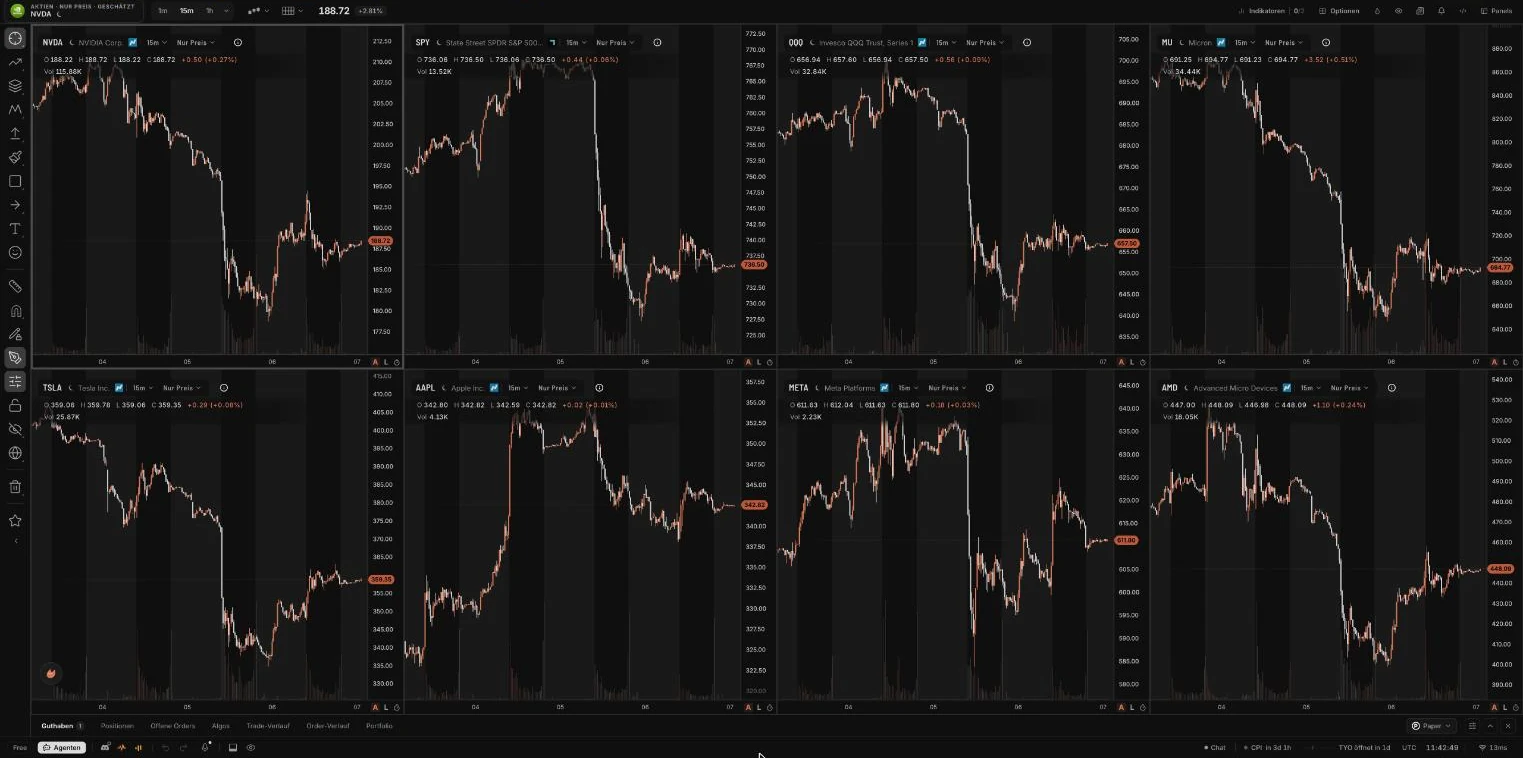
OpenMarket is strongest in crypto. According to the home page the platform carries more than 4,000 pairs from 29 venues, spot and perpetuals, which are futures contracts without an expiry date. On top come about 5,500 US stocks and ETFs, CME futures, more than 1,200 currency pairs and some 5,600 economic data series.
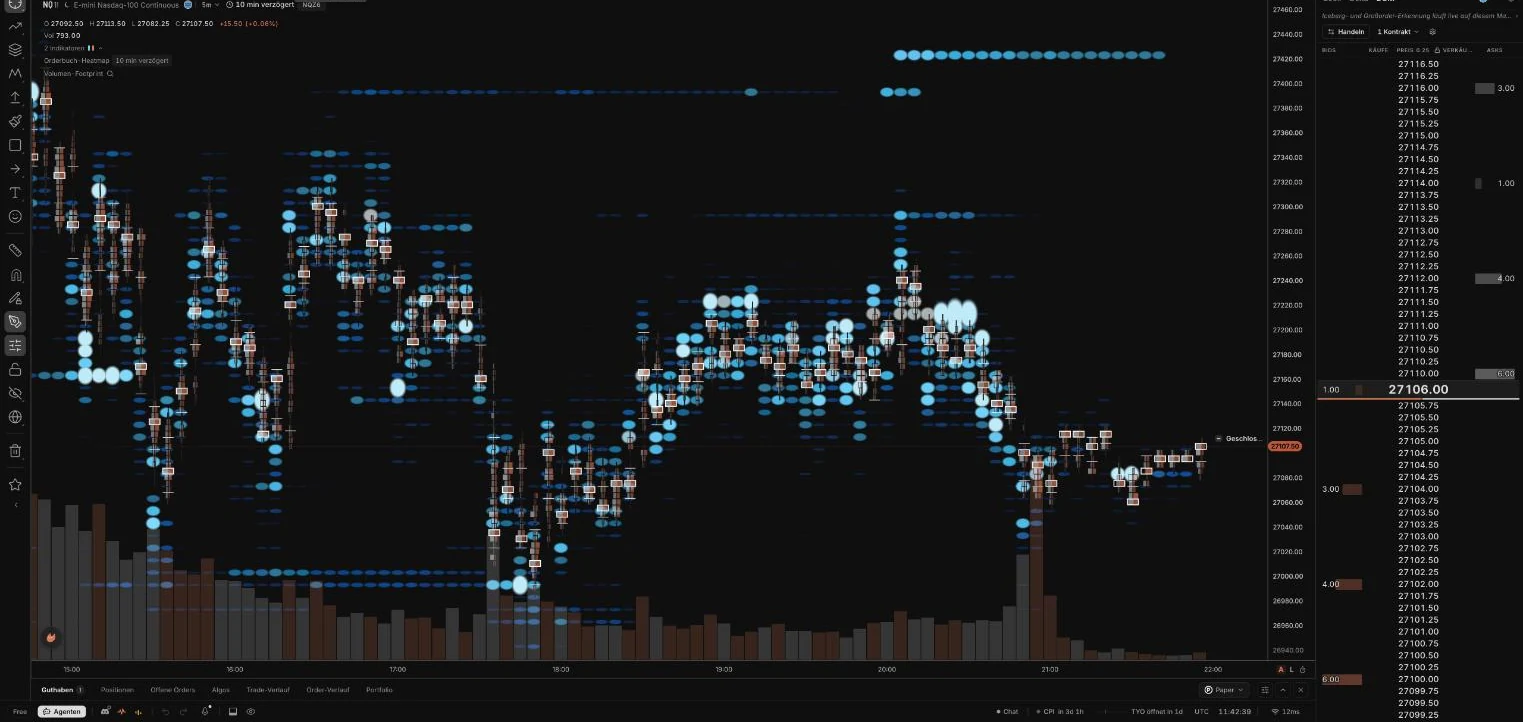
On the free plan not all data is live. On the Nasdaq future my account showed the label “10 min delayed”, because the exchange operator CME charges its own fees for real-time data, as its market data fee list shows. US stocks appeared as an estimated price only without a data add-on. The DAX future and German stocks are not listed on the home page, and I did not find them in my test either.
A detail for gold traders: the gold chart in my account ran on XAUUSDT from Binance. That is a perpetual contract that tracks gold in Tether, not spot gold from the interbank market. For chart analysis that is often enough; for exact price levels you should know the source.
 Click to enlarge
Source: Kagels Trading, screenshot from our OpenMarket account.
Order flow: heatmap, footprint and liquidations
Order flow is the stream of executed orders and of limit orders waiting in the order book, from which traders read where buyers and sellers build pressure.
This is where OpenMarket stands out against TradingView. According to TradingView’s plan comparison, the volume footprint is included from the Premium plan upward, and the comparison does not list an order book heatmap at all. On OpenMarket both are available on the free plan. TradingView does have a built-in liquidations indicator, though. How to read the order flow is covered in our guide to order flow trading.
Order book heatmap
The heatmap colours every price level by the size of the resting limit orders. Bright bands show large buy or sell walls. Those orders can be cancelled at any time before price reaches them, so a wall is not fixed resistance. On the free plan the map loads only as many rows as the HD level and shows reduced order book depth, according to OpenMarket, so large walls far from the current price tend to drop out of the picture.
 Click to enlarge
Source: Kagels Trading, screenshot from our OpenMarket account.
Volume footprint
A footprint chart is a candlestick view that shows, for every price level of a candle, the volume traded on the buy side and on the sell side separately.
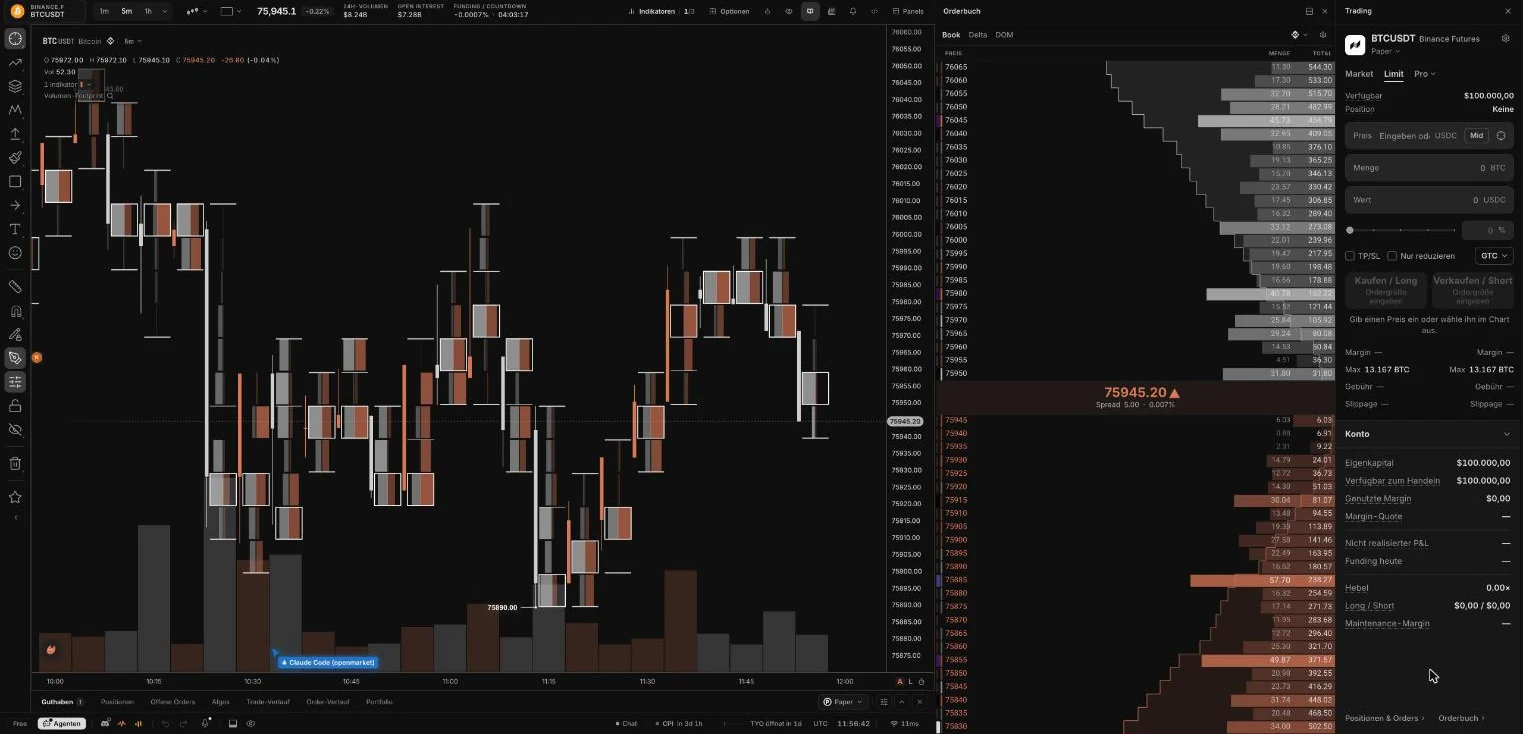
The footprint splits each candle into price levels and shows how much traded at the bid and how much at the ask on each level. That tells you whether a breakout is carried by aggressive buyers or runs into nothing. On the 5-minute Bitcoin chart the boxes only became readable after zooming in, and on a phone the tool stays cramped. TradingView’s own version is covered in our article on the TradingView volume footprint.
 Click to enlarge
Source: Kagels Trading, screenshot from our OpenMarket account.
Liquidations and open interest
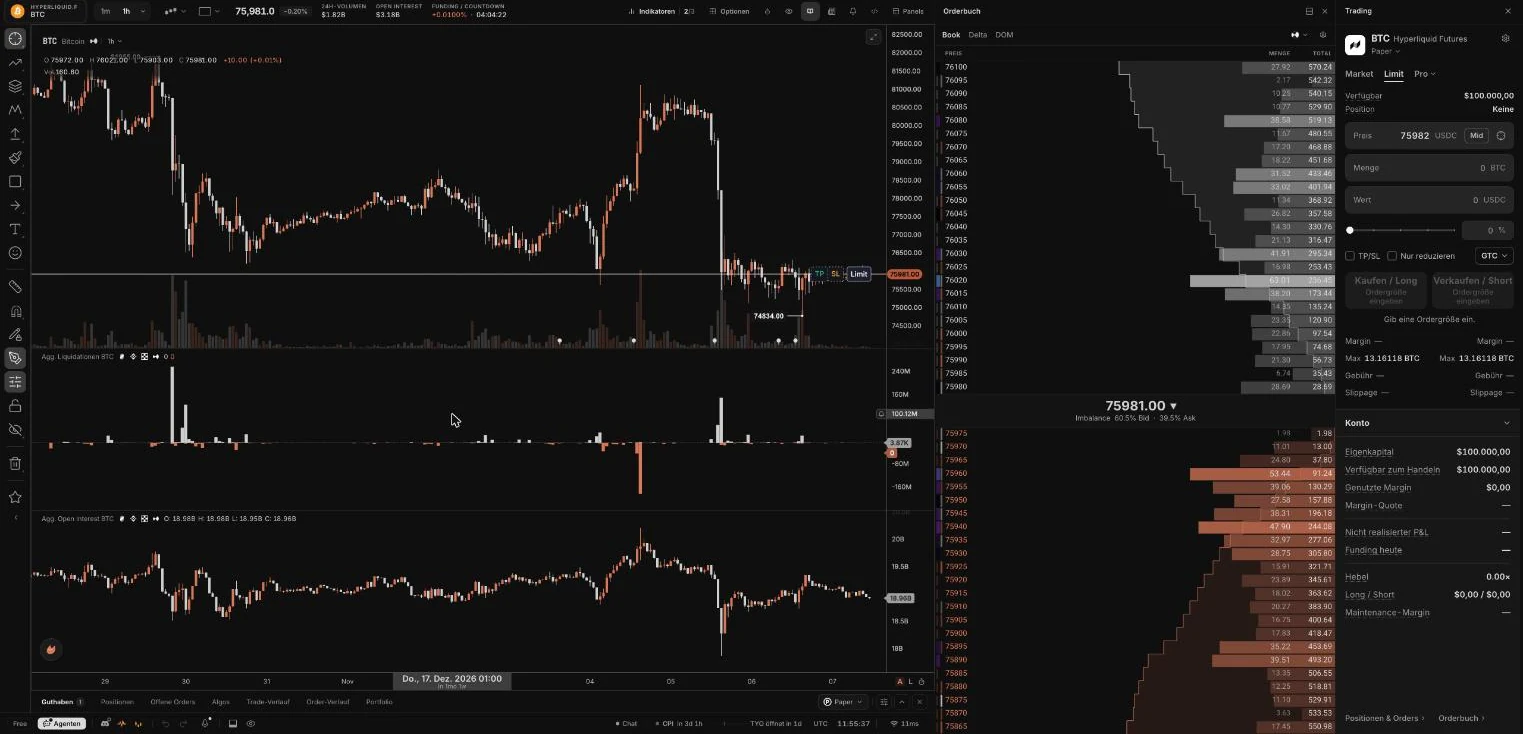
Liquidations show where leveraged positions were closed by force. OpenMarket aggregates them across several exchanges and adds open interest as a separate pane below. If price rises while open interest falls, short sellers are more likely closing than new buyers arriving.
Open interest is the number of futures contracts that are open at a given time and have not yet been closed.
 Click to enlarge
Source: Kagels Trading, screenshot from our OpenMarket account.
Big trades and DOM
The DOM (depth of market) is the list of all resting buy and sell orders, sorted by price level around the current price.
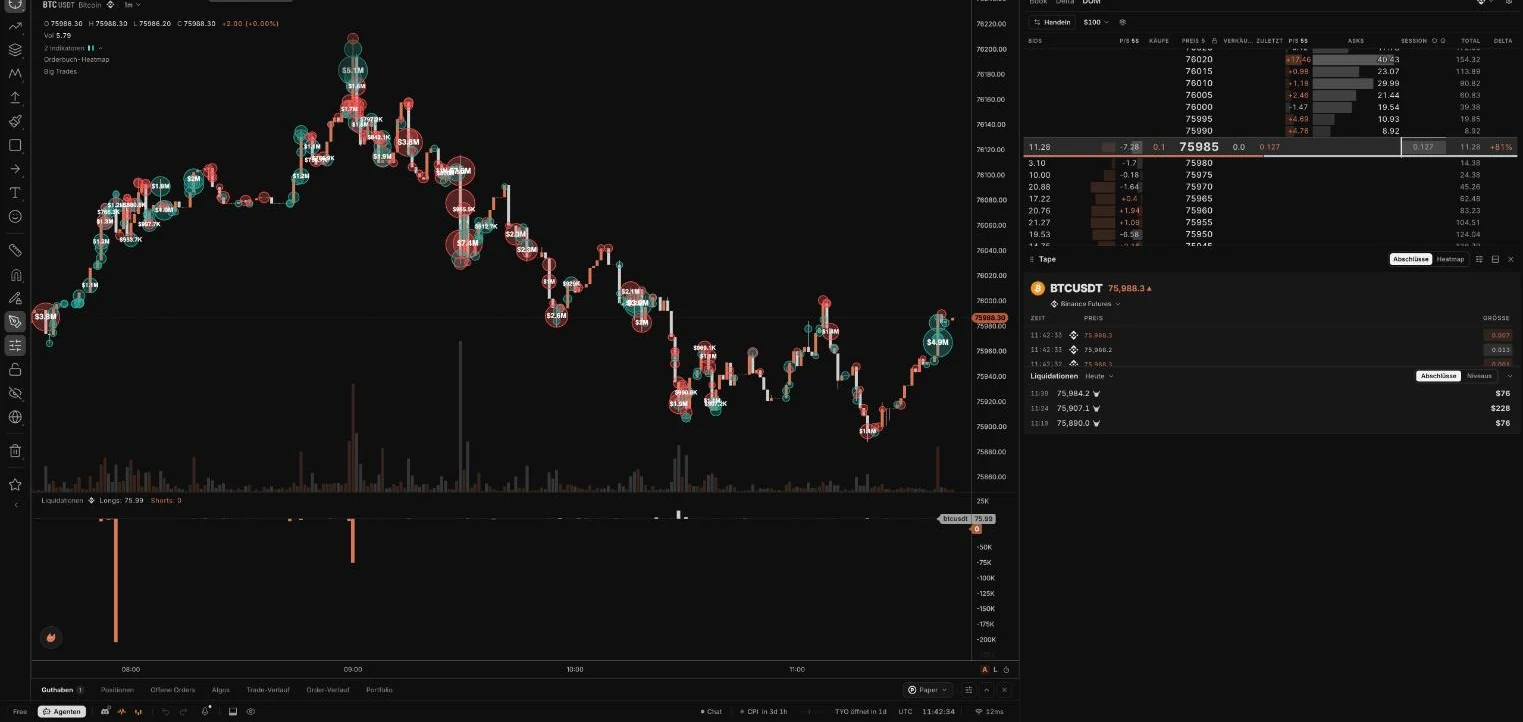
Large executed trades appear as bubbles right on the chart, labelled with their volume in dollars. Next to them run the DOM and the tape, which lists every single trade. TradingView also has a DOM, but only with a connected broker that supplies order book data.
One limit you should know: the free plan runs at most three data indicators at the same time, shared by all charts in a layout. The heatmap and the footprint take one slot each; Plus allows ten per chart. Classic indicators such as RSI, moving averages or MACD do not count.
 Click to enlarge
Source: Kagels Trading, screenshot from our OpenMarket account.
AI on the chart: Kata and your own AI
OpenMarket has two AI layers, and they do different things. The built-in assistant is called Kata and operates the interface; according to the home page it also writes indicators from a description. Besides that you can connect an external AI such as Claude or ChatGPT.
Kata: commands with a preview
Kata understood German and showed a plan before carrying anything out. For “add an RSI 14 and switch to 15 minutes” it displayed a plan with two actions and waited for my confirmation. My question “where are the largest liquidation clusters for BTC?” got only the reply that there is no guide for it yet. Our analysis question stayed unanswered; in the test Kata worked as a command line that understands language.
Connecting Claude or ChatGPT
MCP (Model Context Protocol) is an open standard that lets AI assistants such as Claude or ChatGPT operate other programs directly.
Connecting takes one sentence and one sign-in. OpenMarket’s agents panel shows a ready-made start sentence to copy into your AI. You then sign in through the browser and pick the access level: read only, control charts, or also trade. I chose “control charts”; trading stays with me.
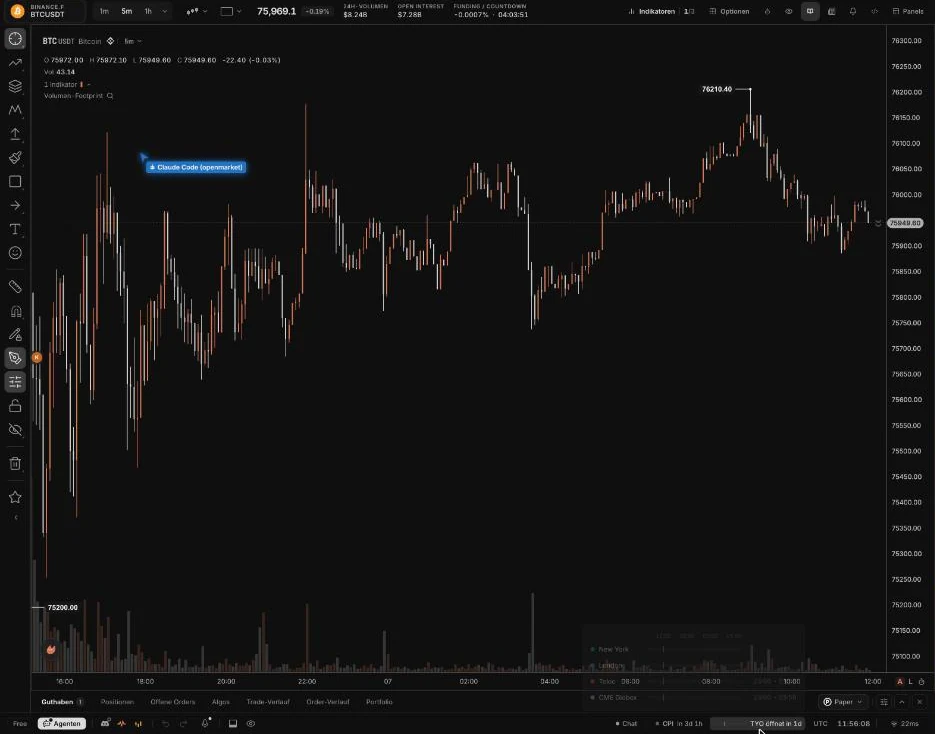
After that the AI works live in your chart. A cursor with the AI’s name moves across the candles, and indicators and drawings appear in real time. The screenshot below shows Claude’s cursor on the Bitcoin chart.
 Click to enlarge
Source: Kagels Trading, screenshot from our OpenMarket account.
Our AI checks
An AI answers with the same confidence whether its numbers are right or wrong. So we held every check against a second source: we independently recalculated the numbers from candle data straight from the Binance Futures API. The test ran on November 7, 2026 at about 12:10 UTC on the hourly chart of BTCUSDT. The moving averages include the running hourly candle, the high and low only closed candles, as OpenMarket calculates them.
| Task | OpenMarket result | Own calculation and verdict |
|---|---|---|
| Moving averages 20, 50, 200 | 75,926.32 · 76,223.32 · 77,530.68 | identical, correct |
| High and low of the last 50 closed candles | 80,519.1 · 74,810.8 | identical, correct |
| RSI 14 for BTC, ETH, XRP, HYPE | 45.87 · 46.87 · 40.22 · 39.13 | 46.24 · 47.44 · 40.19 · 39.04, gap 0.03 to 0.57 points |
| Fibonacci on the last swing (3 days) | anchors at 79,905 and 76,210 | high 81,188, low 74,811, swing unclear |
| Price alert set by the AI | status “armed” | created, trigger not tested |
Moving averages and closed-candle highs and lows matched, RSI differed slightly, and the automatic drawing left questions open. The two Fibonacci anchors did not sit on the three-day high and low, and the tool does not say which swing it picked. There was also a test condition: the request was for BTCUSDT, but the chart pane showed a Polymarket market at that moment, so the cause cannot be pinned on the swing detection alone. We only created the alert and read it back as armed; it did not trigger during the test. The takeaway: check AI drawings on the chart. The running hourly candle is one possible cause of the small RSI gaps, since the requests were seconds apart.
Two everyday observations: once a change by the AI did not reach the open tab, and the app showed “not synced”. And heatmaps could not be added by the AI on the free plan; the tool reported a plan limit, even though the same heatmap worked when added with the mouse.
What does OpenMarket cost? Free vs Plus
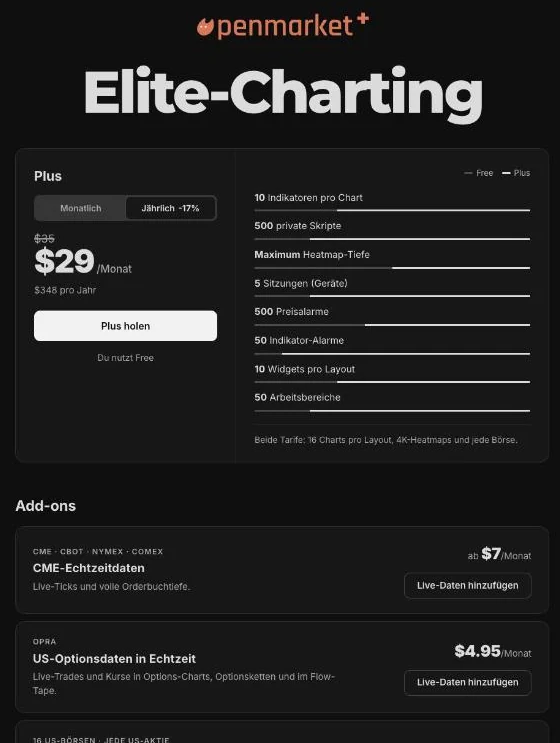
OpenMarket has exactly two plans, and the free one is fully usable. Plus costs $35 a month billed monthly or $29 a month billed yearly, which is $348 a year. According to the pricing page an upgrade applies at once, a downgrade only at the end of the paid period, and there are no cancellation fees, so the yearly plan is paid up front for twelve months. Anyone who subscribes through Google Play has a plan that renews automatically until cancelled; the terms of use contain no refund rule.
| Feature | Free | Plus |
|---|---|---|
| Price | $0 | $35 a month or $348 a year |
| Data indicators | 3 per layout | 10 per chart |
| Classic indicators | unlimited | unlimited |
| Heatmap depth | reduced | full |
| Charts per layout | 16 | 16 |
| Devices at once | 1 | 5 |
| Price alerts | 200 | 500 |
| Indicator alerts | 5 | 50 |
| Workspaces | 10 | 50 |
| Private scripts | 100 | 500 |
| One-second candles | no | yes |
Real-time data for traditional markets costs extra, even with Plus. Real-time CME futures start at $7 a month, US options data (OPRA) costs $4.95 and US stocks from 16 exchanges $19 a month. Anyone who trades $100,000 in volume on Hyperliquid within 30 days gets 31 days of Plus free. For orders through Hyperliquid, OpenMarket adds a builder fee of 0.02% on executed notional value, on top of Hyperliquid’s own trading fees, according to its terms.
An important distinction on the pricing page: at the top it says both plans have “4K heatmaps”, further down that Plus brings “4K heatmaps with full depth”. OpenMarket’s limits page explains it: 4K resolution is also free, but on Free it loads less order book depth and covers a narrower band around the price.
 Click to enlarge
Source: Kagels Trading, screenshot from our OpenMarket account.
Trading from the chart: paper account, exchanges and prediction markets
A paper account is built in. My account had a paper account with $100,000, with market and limit orders, take profit and stop loss right on the chart. That is enough for first attempts; our guide to paper trading on TradingView explains the limits of practising with play money.
The terms of use describe real orders through Hyperliquid with a wallet you control yourself. OpenMarket charges its own fee for that, see the costs section. The menu also offers Binance Futures and Bybit to connect, but in our test those ran as paper accounts only; we did not check real orders. OpenMarket holds no funds. According to the terms, wallet execution is blocked for people resident or located in the United States, Malaysia and sanctioned countries; charts and analytics stay available to everyone.
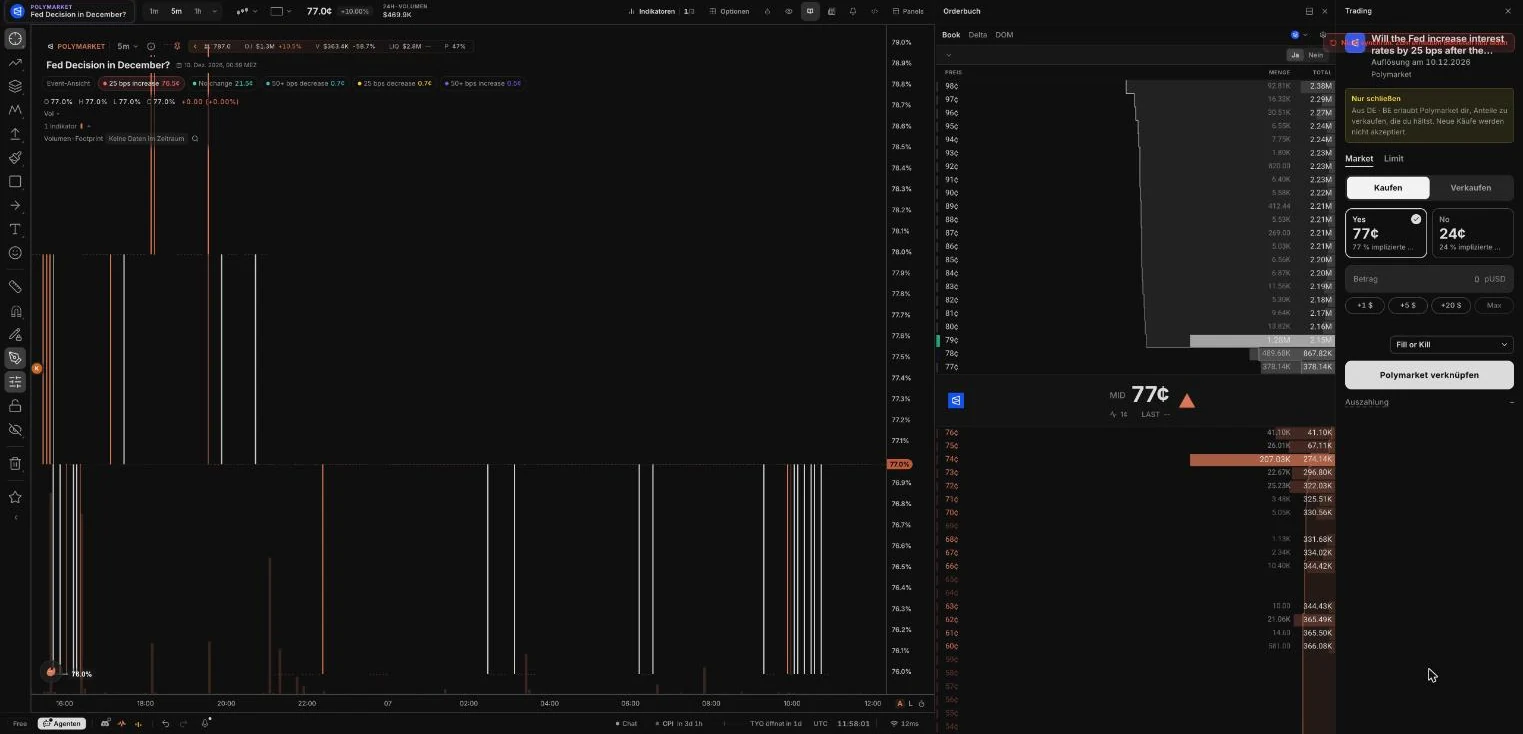
In our test from Germany, Polymarket was mainly a data source. OpenMarket shows Polymarket markets such as “Fed Decision in December?” with an order book and probability; the screenshot below is from my test. When I tried to buy, a notice said that from Germany Polymarket only allows selling existing shares and accepts no new purchases. Availability depends on where you live; our Polymarket review covers the US situation, and the guide to prediction markets explains how they work.
 Click to enlarge
Source: Kagels Trading, screenshot from our OpenMarket account.
Custom indicators: TypeScript, wrun and Pine import
On OpenMarket you write your own indicators in TypeScript, a common programming language from web development. On top comes wrun, OpenMarket’s own language for market logic that runs in the browser or in the cloud. The free plan allows 100 private scripts, Plus 500, and every plan can use the community script library.
For TradingView users the Pine import is interesting. The command bar lists an entry “convert from Pine”, which is meant to transfer scripts written in Pine Script, TradingView’s language. I did not test it, and TradingView’s large community library does not come along. If you rely on many Pine scripts, convert one important script as a trial before switching. More on the language in our guide to Pine Script.
Apps and devices
OpenMarket works best in the browser, with no installation. A desktop app is available as a beta. For Android the app is in the German Google Play Store, published by Thalamus Technologies and last updated on November 6, 2026.
iPhone users have to improvise. In a search of the German App Store we did not find OpenMarket; the iOS version runs only as a test version through TestFlight. On the free plan only one device can be signed in at a time; using a computer and a phone in parallel needs Plus.
Is OpenMarket legit?
OpenMarket is software only and holds no funds. You deposit nothing with OpenMarket; orders run through accounts at the respective exchanges. That avoids depositing funds with OpenMarket itself, the first question with many crypto platforms. Wallet, venue and trading-key risks remain.
The main point against OpenMarket is how young the product is. We found no team profile on the pages we checked; known are only the Delaware company from the terms of use and the address in the Google Play listing. The desktop and iOS apps are in beta, and in our search on November 7, 2026 we found only two independent write-ups. The Kiyotaka brand, on the other hand, can be traced back to at least June 2025.
My assessment: for a free chart without a deposit, the risk is low. I would be careful with the “trade” access level for an AI and with connected exchange accounts holding real money.
OpenMarket or TradingView?
OpenMarket does not replace TradingView, it complements it. For crypto order flow, OpenMarket offers more for free. For DAX and German stocks, broker connections and the range of community scripts, TradingView stays ahead.
| Criterion | OpenMarket | TradingView |
|---|---|---|
| Order book heatmap | yes, also free | not in the plan comparison |
| Footprint | yes, also free | from Premium |
| Liquidations | yes, several exchanges | yes, several exchanges |
| Connect your own AI | yes, controls the chart | from Essential, no chart control |
| DAX, German stocks | not found in our test | yes |
| Brokers | crypto exchanges | many brokers |
| Scripts | TypeScript, wrun | Pine Script |
| Apps | Android, iOS beta only | iOS, Android, desktop |
Where TradingView remains the first choice: anyone who analyses the DAX or German stocks, wants to trade through a broker straight from the chart, or relies on ready-made community scripts stays with TradingView. Our own forecast charts are made there too. You can also connect your own AI to TradingView: the official MCP server reads prices and manages watchlists and alerts, but it does not set indicators or drawings, as our article on the TradingView MCP server explains. TradingView’s built-in assistant is covered in the test of the TradingView AI Copilot.
For me the combination works: I do the analysis in TradingView, and in the test I put OpenMarket with the heatmap and liquidations next to it for Bitcoin. More platforms sorted by purpose are compared in our article on TradingView alternatives.
Pros and cons of OpenMarket
The balance depends on what you trade. For crypto order flow the pros clearly win; for DAX and German stocks the gaps do.
Pros
- Order flow without a subscription: heatmap, footprint, liquidations and big trades are on the free plan.
- Many asset classes: from crypto through US stocks to prediction markets in one interface.
- Up to 16 charts in one layout, also free.
- Connect your own AI: Claude or ChatGPT control the chart; moving averages and highs/lows matched the exchange data, RSI differed slightly.
- Paper account for practice is built in.
Cons
- DAX and German stocks were not found in our test, and the home page does not list them.
- Delayed data on the free plan for CME futures; US stocks only as an estimated price.
- Automatic AI drawings were not traceable in the test and need checking.
- iOS only as a beta, the desktop app too.
- Little transparency: no team profile on the pages we checked, only the company and an address in Delaware.
Who is OpenMarket worth it for?
For crypto order flow, OpenMarket gives you for free what costs money elsewhere. Heatmap, footprint and liquidations without a subscription, plus an AI interface whose moving averages and highs/lows matched in our spot checks. If you trade Bitcoin, Ethereum or crypto perpetuals, take a look; the free plan is enough to start.
Who it is not for: traders of the DAX and German stocks did not find them here in our test. Anyone who needs CME futures in real time pays extra for data. And anyone who wants to take over AI drawings blindly should check every level after our Fibonacci test. This review is market and product analysis, not investment advice.
Frequently asked questions about OpenMarket
Is OpenMarket free?
Yes, OpenMarket currently offers a free plan without a subscription, and it includes charts, indicators, drawings, the heatmap, the footprint and up to 16 charts per layout. The main limits are the three data indicators shared by a layout and the reduced heatmap depth.
How much does OpenMarket Plus cost?
Plus costs $35 a month billed monthly or $29 a month billed yearly, which is $348 a year (as of November 7, 2026). Real-time data for CME futures, US options and US stocks costs extra.
Can you trust OpenMarket?
OpenMarket is software only and holds no funds; orders run through accounts at the exchanges. The operator is Thalamus Technologies, Inc. from Delaware. We found no team profile on the pages we checked, and the apps are still in beta.
Is OpenMarket an alternative to TradingView?
For crypto order flow yes, as a complete replacement no. OpenMarket offers the heatmap and footprint for free, but for DAX and German stocks TradingView remains the first choice.
Can I trade with OpenMarket?
Yes, through a built-in paper account and, according to the terms, with real money through Hyperliquid; people in the United States are excluded from that. Binance Futures and Bybit appear in the menu, but we only tested paper accounts there. In our November 7 test from Germany, Polymarket allowed only closing existing positions.
Does OpenMarket work with ChatGPT or Claude?
Yes, through the MCP server Claude, ChatGPT, Codex and Cursor connect with one sentence and one sign-in. The AI then sets indicators, drawings and alerts right on the chart. Check drawings yourself.
Is OpenMarket data real-time?
Crypto data runs in real time, also on the free plan. CME futures ran 10 minutes delayed in our test, and without a data add-on OpenMarket shows US stocks only as an estimated price.
This article is translated from the German edition on kagels-trading.de.