
Seasonax Review: Pricing, Screener and Limitations


Contents
Seasonax is a paid analysis tool for seasonal market patterns, and the real question is whether its screener earns the subscription. The Vienna company behind it builds on Dimitri Speck’s seasonality research and advertises 25,000+ instruments with up to 100 years of history. I trade discretionary price action and do not use seasonality as a core input. That is why I looked at Seasonax from the outside: what it delivers, what it costs and where its statistics claim more than they can carry.
This is a documentation review, not a paid-account test. I read the public pricing page, the terms and conditions, the FAQ, the screener page and two in-house tutorials on 24 October 2026 and checked them again on 25 October 2026. The two product screenshots come from our German review and show an older interface. I did not open an account, start the trial or go through the checkout. The article follows our editorial policy.
Seasonax in 30 seconds
- What it is: a web platform for seasonal analysis of stocks, indices, commodities and currencies, run by seasonax GmbH in Vienna, Austria.
- Prices on 25 October 2026: Basic $49.95 a month or $499.95 a year, Professional $100.00 a month or $960.00 a year, in US dollars.
- Free trial: 30 days of Professional access, and the page says no payment details are required.
- Core strength: the screener scans a whole market for calendar windows in seconds. In Basic it covers only a short list of markets.
- Core caveat: the large annualized return on each chart stretches a short window over a full year. The average window return is the number to judge.
What is Seasonax
Seasonax is an analysis platform that turns long price histories into average calendar paths, statistics and screener rankings. The company page names Dimitri Speck and Christoph Zenk as co-founders; Zenk is the managing director. The web app works with end-of-day data. According to the Seasonax FAQ, users of the Bloomberg Terminal or Refinitiv EIKON get intraday data through those integrations. Seasonax places no orders; it is a research tool, not a trading platform.
How to read a seasonal chart
A seasonal chart does not plot price, it plots the average path of past years on the calendar. The horizontal axis runs from January to December. The line starts at 100 on the first day of the year and shows how the instrument typically moved from there, averaged across the chosen number of years.
 Click to enlarge
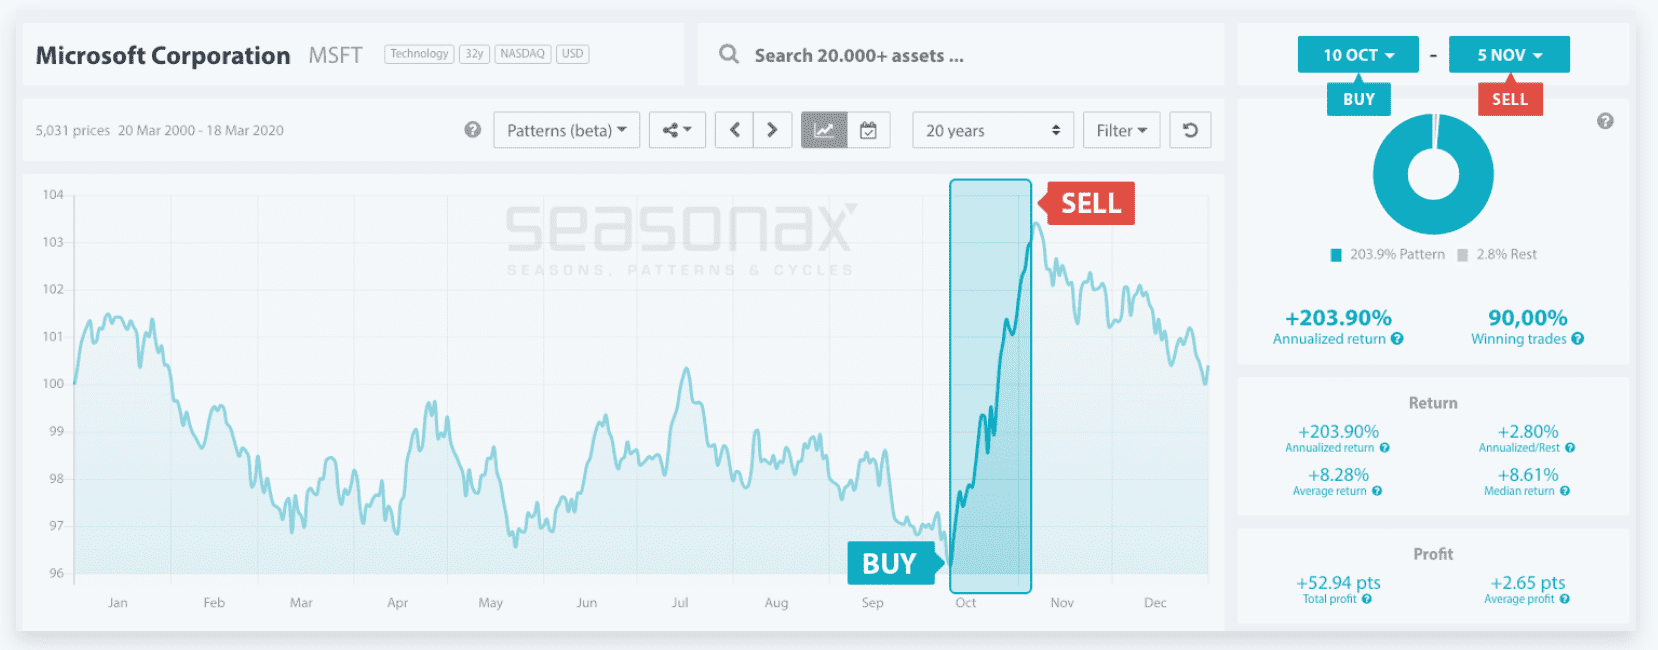
- The window. The selected window runs from 10 October to 5 November, about 26 calendar days.
- The headline numbers. Annualized return +203.90% and winning trades 90%: 18 of the 20 years rose in this window.
- The real move. Average return +8.28% and median +8.61% per window. This is the move the pattern actually made on average.
The chart compresses twenty years into one picture, and the labels around it can make a pattern look stronger than it is. On the Microsoft example, the window from 10 October to 5 November rose in 18 of 20 years, shown as 90% winning trades. The average return in that window was +8.28%, the median +8.61%. Next to it, Seasonax prints +203.90% as the annualized return.
The annualized figure is an extrapolation, not a result. In its tutorial on seasonal patterns, Seasonax describes it as the gain that would have been made if the pattern were extrapolated over a full year. The 203.90% figure is not the observed average return for this window; that was 8.28% in about 26 days. I found no formula in the public Seasonax documentation I checked. As a rough check, simple scaling (8.28% × 365 ÷ 26) gives about 116%, and compounding the same move gives about 205%. Neither is confirmed as the platform’s method; the point is the size of the gap, not the exact number.
Detrending matters more than it sounds. On a stock that rose for twenty years, almost every month looks good on the raw average. Seasonax’s detrended view removes the long-term trend, so you can see which windows ran above the stock’s normal pace. Without that step, a strong uptrend is easy to mistake for a seasonal pattern.
The screener and plan limits
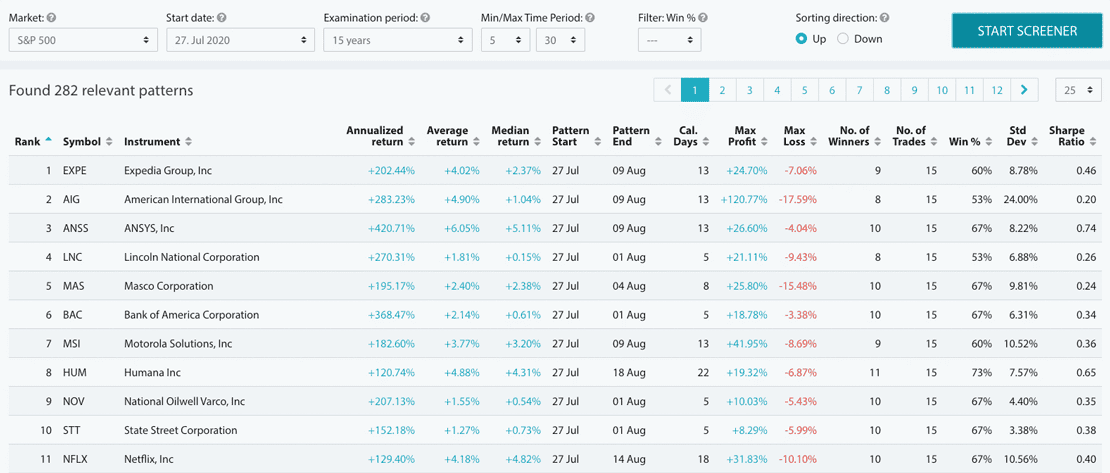
The screener turns the question around: instead of one instrument, it searches a whole market for windows that start on a chosen date. You choose a market, a start date, the number of years and the window length. The result is a ranked list with each pattern’s history attached.
 Click to enlarge
- Annualized return. The short window stretched to a full year. Compare it with the average return next to it.
- Win rate. Win % is the share of the 15 years in which the window rose, here mostly 53% to 73%.
The default ranking mixes three measures, and the tests behind it are the provider’s own. According to Seasonax’s ranking guide, the default sort combines average return, trend-adjusted return and annualized return. You can also sort by median return or Sharpe ratio. The guide describes walk-forward and out-of-sample tests run by Seasonax itself; they are not an independent audit.
Both plans share the chart tools, but the screener coverage differs a lot. In the feature table on 25 October 2026, Basic screens currencies, the Dow Jones and NASDAQ 100, the CAC 40, DAX and HDAX, and the ASX. Professional adds the S&P 500, commodities, STOXX Europe 600, FTSE 100, the Asian indices, US and European sectors and custom baskets. Both plans get all instruments in the chart, up to 100 years of history where the data exists, intra-year and intra-week analysis, bookmarks and alerts.
Professional also adds the comparison tools. You can compare several instruments, a stock with its sector, or an instrument with single years. Professional also lists up to three personal portfolios and the upload of your own data.
Event studies
An event study measures what prices typically do around a recurring event, not a calendar date. Examples on the pricing page are FOMC meetings, ECB and BoE decisions, CPI releases, futures expiries such as S&P 500 triple witching, elections and holidays.
Most of the library sits in the Professional plan. Professional lists “all 100 event studies”. Basic includes a small set: Fed rate decisions and FOMC meetings, expiries of 10-year Treasury notes and WTI crude oil, two German and European reports, two holidays and one miscellaneous study.
Event studies do not escape the sample problem. Twenty years of data contain only twenty first trading days of November, and a study of Fed meetings over a decade covers about eighty of them. Averages from such small groups can be uncertain, so look at the single years behind them.
Pricing, trial and cancellation
Seasonax sells two plans in US dollars, and the annual option is cheaper per month. I read these prices on the Seasonax pricing page on 24 October 2026 and confirmed them on 25 October 2026 after the page had rendered. Without JavaScript the page shows 0.00 placeholders, which are not prices.
| Plan | Monthly billing | Annual billing | Per month on annual | Saving stated by Seasonax |
|---|---|---|---|---|
| Basic | $49.95 | $499.95 | $41.66 | $99.45 a year |
| Professional | $100.00 | $960.00 | $80.00 | $240.00 a year |
Check the final amount in the checkout before you pay. The pricing page shows no VAT line, and I did not go through the checkout. Outside the United States, your card statement in your own currency moves with the exchange rate. The site also says “Trusted by 15,000+ Users”; that is a company claim, not independent proof.
The trial asks for no payment details. New users get 30 days of Professional access, and the page says “No payment details required!”. The FAQ adds that at the end of the trial you choose a plan or walk away.
On cancellation, two Seasonax documents say different things, so plan for the stricter one. The terms and conditions (status November 2025, section 12.3) let you cancel a plan of one month, three months or one year before the end of the term, currently with a button in the app; otherwise it renews for the same length. Seasonax also commits to remind you before the cancellation period starts. The FAQ, however, says to cancel an annual plan 3 months before renewal.
- The safe approach: for an annual plan, act well before the three-month point, for example four months before renewal, cancel through the app button and ask Seasonax support to confirm the deadline that applies to you.
- Unlimited subscription: section 12.4 is a separate contract. Consumers are bound for one year, then can cancel every six months with two months’ notice; business customers waive cancellation for ten years.
The terms (section 14) choose Austrian law and the courts in Vienna, with exceptions for consumers. For consumers, the mandatory protections of their home country remain, and claims against a consumer go to a court where the consumer lives; for consumers outside Austria the mandatory venue applies. This summary is not legal advice.
Limitations
Seasonax’s statistics are estimates from a small number of past years, so they carry real uncertainty. A win rate of 90% over 20 years means 18 up years and 2 down years. In the screener example, the visible rows show win rates of only 53% to 73% over 15 years. Look at the yearly returns, the outliers and the maximum loss next to the average and the win rate.
- Multiple testing: with 25,000 instruments and windows of any length, some patterns look excellent by chance. A pattern becomes an argument only when a real cause is plausible, such as harvests, tax dates, fund flows or reporting seasons.
- Trend contamination: in a long bull market, most windows look positive. Use the detrended view before you trust a high win rate.
- Costs and slippage: chart returns are gross, without commissions, spreads or slippage. Seasonax itself notes that shorter patterns mean higher transaction costs.
- Data and regime changes: Seasonax uses adjusted closing prices with splits and dividends factored in. A pattern tied to a rule, such as a tax date, can stop working when the rule changes.
A historical hit rate is not the probability of the next trade. Seasonax says so on its own pages: past seasonal patterns are no indication of future performance, and prospective gains may be significantly lower. Treat a window as one filter inside a plan, with out-of-sample checks and a stop, not as a signal on its own.
Four alternatives
Free and paid tools cover parts of what Seasonax does, each with a different focus. The four below differ mainly in whether they chart one market or scan many.
- SeasonalCharts.com: more than 100 ready-made seasonal charts for free, published by Dimitri Speck, the Seasonax co-founder. There is no screener and no custom chart. If you only want to know whether gold has a typical autumn path, start here.
- Equity Clock: free seasonal research on equities, commodities, bonds and futures, with charts and commentary, plus a separate members section for its chart database. Useful for quick lookups on US sectors and indices.
- TradingView Seasonals: a built-in view that draws each year as its own line on one chart, with an optional average line and a table of monthly changes. It works one symbol at a time; TradingView’s help page describes no scan across a market. Our TradingView alternatives guide compares the platform with its rivals.
- TrendSpider: a paid charting platform with a seasonality indicator for monthly or week-of-year changes, 20 years by default, which TrendSpider says can be used in its market scanner. It suits traders who want seasonal filters inside a general charting tool, with its own subscription tiers.
For a wider map of software by task, see our trading software overview. It covers charting, order flow and trading journals as well.
Who should use Seasonax
Use the 30-day trial before you pay anything, and test it on your own markets. The trial includes Professional, so note which screens you used and check whether they are in Basic. Then ask three questions:
- Fit: do the windows match your holding period? Seasonal windows of weeks to months suit swing trading; our swing trading guide explains that style.
- Edge over free tools: does Seasonax show you something SeasonalCharts or Equity Clock did not already show for free?
- Discipline: can you treat a 90% hit rate as one input and keep position sizing in charge? Our risk management guide sets the baseline.
What do you want to do with seasonal data?
- Look up a few well-known patterns now and thenFree libraries: SeasonalCharts, Equity Clock
- Chart any instrument and screen the Dow, NASDAQ 100, DAX or currenciesSeasonax Basic
- Screen the S&P 500, commodities, sectors or your own basketSeasonax Professional
- Test a seasonal idea as a rule set firstRead the limits, then backtest
- Not sure yetStart the 30-day trial and note which screens you actually use
Plan contents from the Seasonax pricing table on 25 October 2026. Links jump to the matching section.
If you trade the S&P 500 or commodities, Basic will feel limited. Those screener markets are Professional only. Basic suits readers who mainly chart single instruments or screen European indices, the Dow, the NASDAQ 100 and currencies. Before you trade any window, test it honestly; our backtesting guide explains how to avoid overfitting.
Frequently asked questions
What does Seasonax cost?
On 25 October 2026, Basic cost $49.95 a month or $499.95 a year, and Professional $100.00 a month or $960.00 a year. Prices are in US dollars, and the pricing page shows no VAT line. The annual plans work out at $41.66 and $80.00 a month.
Is there a free version of Seasonax?
There is no permanent free plan, only a 30-day trial. The trial gives Professional access without payment details. The articles in the Seasonax Research section are public, and the sister site SeasonalCharts.com offers free charts.
What does the Seasonax screener do in Basic and Professional?
The screener searches a market for calendar windows that start on a chosen date and ranks them by past performance. Basic covers currencies, the Dow Jones, NASDAQ 100, CAC 40, DAX, HDAX and ASX. Professional adds the S&P 500, commodities, more European and Asian indices, sectors and custom baskets.
How do I cancel a Seasonax subscription?
The terms say before the end of the term, the FAQ says three months before an annual renewal. Cancellation runs through a button in the app. To be safe, cancel an annual plan well before the three-month point and ask support to confirm your deadline. The separate Unlimited plan has its own notice rules.
What does the annualized return on a Seasonax chart mean?
It extrapolates a short-window gain to a full year. In our Microsoft example, an average move of 8.28% in about 26 days appears as +203.90% annualized. Judge a pattern by the average window return, the win rate and the spread of yearly results.
Is Seasonax worth it?
It is worth testing for traders who screen many markets for seasonal windows and hold positions for weeks. For occasional lookups, the free libraries are enough. For day trading, the web app is limited, because it uses end-of-day data.
Can Seasonax predict returns?
No, it shows how prices behaved in the past, not what they will do. Seasonax itself says that past seasonal patterns are no indication of future performance. Use a window as a filter inside a tested plan, never as a stand-alone signal.
What are the best alternatives to Seasonax?
SeasonalCharts.com and Equity Clock offer free seasonal charts, and TrendSpider lets you scan with a seasonality indicator. TradingView Seasonals compares years on one chart for a single symbol. Which one fits depends on whether you need ready-made charts, a scan or Seasonax features such as event studies.
This article was written by Karsten Kagels and reviewed by Christian Möhrer. It is an educational review of analysis software based on public provider documents, not investment advice. Trading involves the risk of loss, and past seasonal patterns do not guarantee future results.
This English edition is based on our German edition on kagels-trading.de and has been adapted for international readers.