
Trailing Drawdown at Prop Firms: The Math, With Real Trades


Contents
- Prop firm drawdown in 30 seconds
- What is drawdown at a prop firm?
- Three kinds of loss limit: static, end of day and intraday
- The order decides: same trades, different result
- The formula behind it: expectancy and buffer
- Risk per trade: how strongly it moves the pass rate in the model
- Extra rules: consistency, daily loss and minimum days
- What prop firms report about their pass rates
- What a prop firm challenge really costs
- How we calculated: data, method and limits
- Conclusion: at prop firms the limit matters more than the target
- Frequently asked questions about prop firm drawdown
- About the author
On Topstep’s 50K test, your starting loss buffer is only $2,000. The account is called $50,000, but you may lose just 4 percent of it before the test is failed. Once you see it that way, you calculate differently: what counts is not only the account size, but the room to the loss limit, and whether you reach the profit target before that limit.
This article works it through with real trades in a simplified model. The basis is 61 trades from my own trading journal, run against selected rules of Topstep, Take Profit Trader and FTMO. You will see which kind of loss limit costs the most, how strongly risk per trade moves the pass rate in the model, and what the firms themselves report about pass rates. This article follows our editorial policy.
Prop firm drawdown in 30 seconds
- The loss buffer is smaller than the account: a 50K account at Topstep starts with a $2,000 buffer and a $3,000 profit target. The test asks for $1.50 of profit for every dollar you are allowed to lose.
- The type of limit costs pass rate: in the model with my trades and 2% risk, 76% of runs pass with a static limit, 67% with an end-of-day limit and only 50% with an intraday trailing limit.
- The order of the trades matters: the same 61 trades, only shuffled, pass in 81% of orders at 1% risk and in only 60% at 2%.
- Without an edge the pass rate stays low: with no positive expectancy, only 12 to 28% of runs pass in the Topstep model, depending on risk.
- My own range: I risk 0.5 to 1% of the account per trade. On a 50K account that would be $250 to $500, one eighth to one quarter of the starting buffer.
What is drawdown at a prop firm?
Drawdown at a prop firm is the loss from the starting balance or from the last high. The firm sets a loss limit for it. If the account reaches that limit, the test is failed under the firm’s rules. The test accounts themselves are simulated accounts.
The nominal account size and the loss buffer are two different numbers. On Topstep’s 50K Trading Combine, the test account of $50,000, the Maximum Loss Limit is $2,000. The nominal size sets contract limits and other rules; the buffer decides how many mistakes you survive. The general measure for the largest drop from a high to the following low is called maximum drawdown. FTMO’s 2-Step Challenge of $100,000 has a different ratio: a 10% profit target in phase 1 with a 10% maximum loss, then 5% in phase 2. This article models the global FTMO product on ftmo.com; according to FTMO’s eligibility FAQ, clients in the United States use FTMO through an affiliated entity at ftmo.oanda.com, whose offer we did not check.
This leads to the key question of any prop firm test. On your own account the question is: does my strategy have an edge? In the test it is: does my account reach plus $3,000 before it reaches the loss limit? A strategy can say yes to the first question and still fail the second, because two fixed lines leave little room for a long losing streak. At Topstep, a Combine that breaks the limit loses its eligibility for funding until a paid reset; practice trading remains possible.
Three kinds of loss limit: static, end of day and intraday
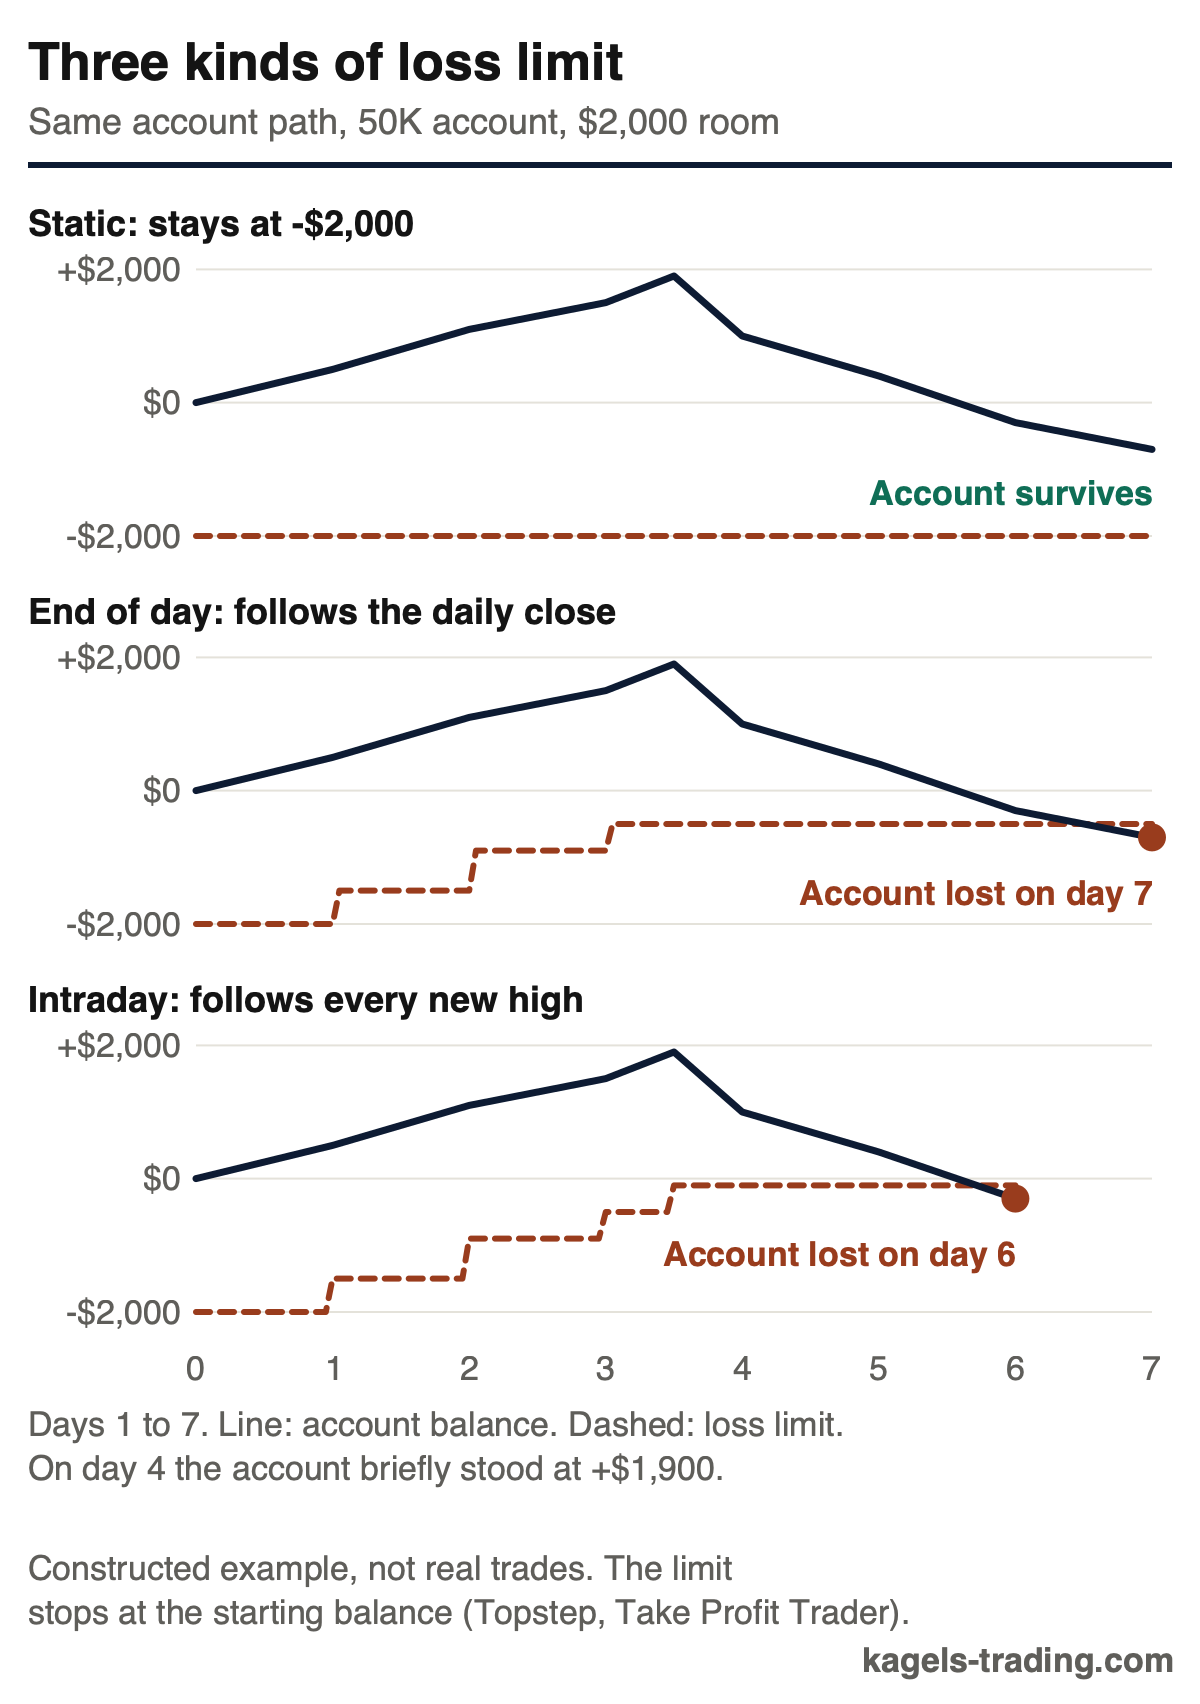
Prop firms move their loss limit in different ways, and that decides many accounts. There are three basic forms. The graphic shows the same constructed account path under all three: the account rises to +$1,500, briefly stands at +$1,900 on day 4 and then falls to −$700.
 Click to enlarge
Source: Kagels Trading, own graphic.
A static drawdown is a loss limit fixed to the starting balance. It does not move when the account makes money.
FTMO uses such a static maximum limit of 10% in the 2-Step Challenge. If the limit starts at −$10,000, it stays there even after a $5,000 gain. Profits enlarge your buffer instead of pulling it up. FTMO measures the equity including open positions, so unrealized losses count too.
An end-of-day drawdown is a loss limit that is recalculated only at the close of the trading day. It follows the highest daily closing balance.
At Topstep and in the Take Profit Trader test, the trailing stops at the starting balance. After that the limit stays fixed. The key difference is between recalculation and breach: the limit is reset at the end of the day, but it is breached in real time, including open losses. According to Topstep’s Maximum Loss Limit rule, the account is then liquidated immediately, and the same applies in the test according to Take Profit Trader’s drawdown rule.
An intraday trailing drawdown is a loss limit that follows every new high immediately, including an open profit that has not been realized.
This form is the strictest. If a trade runs +$400 into profit and then falls back to zero, your room has still shrunk by $400. Take Profit Trader uses it in the PRO account after a passed test, as its rule on the PRO drawdown describes. The PRO+ account works with end of day again.
| Firm and account | Test rules |
|---|---|
| Topstep 50K Combine | $3,000 target, $2,000 limit; end of day, stops at the starting balance, breach in real time; best day at most 55% of total profit; daily loss limit optional |
| Take Profit Trader 50K Test | $3,000 target, $2,000 limit; end of day, stops at the starting balance, breach in real time; best day below 50% of total profit; at least 3 trading days |
| FTMO 2-Step 100K | $10,000, then $5,000 target, $10,000 limit; static, measured on equity; daily limit = balance at midnight Central European time minus $5,000; at least 4 trading days per phase |
Rules as of October 18, 2026, each from the firm’s own pages.
The model shows what the type of limit costs. With my trades and 1% risk per trade, 96% of runs pass with a static limit, 92% with end of day and 90% with intraday trailing. At 2% risk the gap grows: 76%, 67% and 50%. The larger the single trades, the more often a big winner pulls the limit up, and the next loser hits it. These three values leave out the consistency rule and the daily loss limit, so that only the type of limit is compared.
The order decides: same trades, different result
Two traders with identical trades can end up differently. One gets the winners first and reaches the target. The other starts with three losses, hits the limit and never sees the winners. On your own account both would end with the same result. In the test, the second trader is out before their edge, their statistical advantage, can work.
R is the risk unit of a trade: the amount lost when the planned stop-loss is hit. A result of +2R means the trade made twice the planned risk.
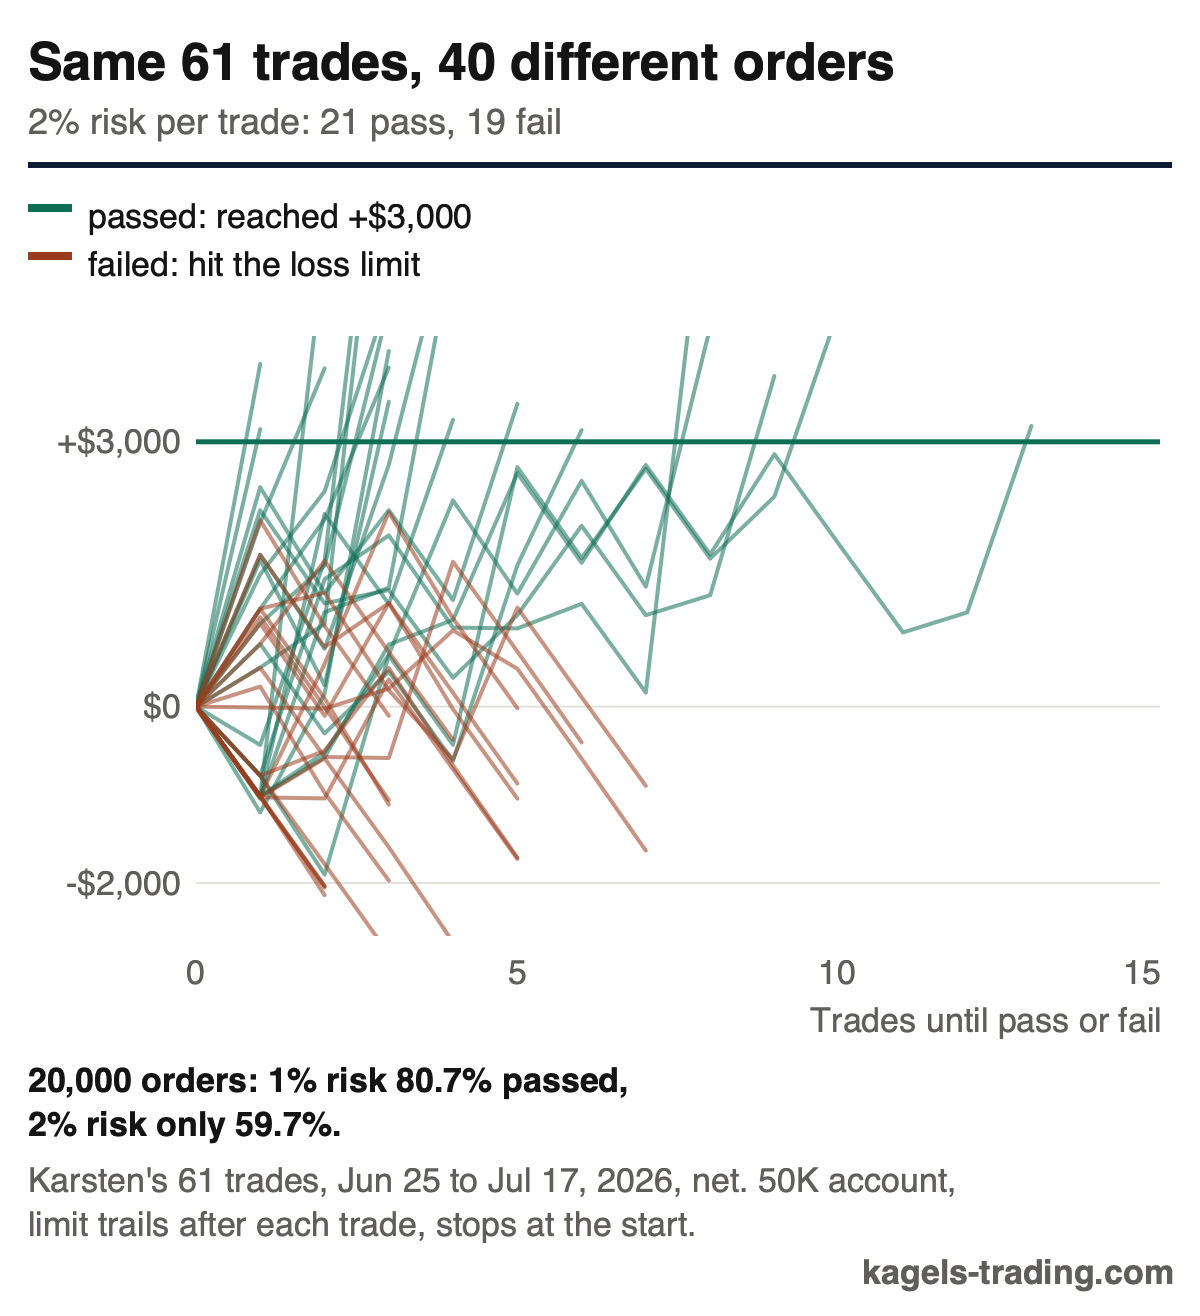
To measure the effect of order, we shuffled my own 61 trades. They are the trades from my journal from June 25 to July 17, 2026, net of fees: 54.1% winners and, in the period analyzed, an average of +0.54R per trade. Because the net result includes fees and execution, a loss is not always exactly 1R: the largest loss was −1.42R. We shuffled these 61 trades 20,000 times without replacement and ran them through a 50K account with a $3,000 target and a $2,000 limit. In this experiment the limit trails after every trade, a simplification, and there is no consistency rule.
 Click to enlarge
Source: Kagels Trading, own simulation.
The result is clear. At 1% risk, $500 per trade, 80.7% of the orders pass. At 2% it is only 59.7%. The trades are identical; only their order changes.
With the real order of my trades, the model gives this. Against Topstep’s rules without the daily loss limit, 0.5% and 1% risk would have passed. At 1.5% and 2% the model hits the limit on day 4, because days 3 and 4 together lost −2.3R. My journal does not contain the equity path inside each trade, so a real account could have failed earlier. The finding on position size stays clear: the same setups end as passed or lost depending on risk.
The formula behind it: expectancy and buffer
Expectancy is the average gain or loss per trade over many trades. It is the win rate times the average win, minus the loss rate times the average loss.
With my numbers, that gives +0.54R per trade in the period analyzed. Calculated: 54.1% × 1.81R − 45.9% × 0.96R = +0.54R. This is a mean of 61 trades, not a promise for the future. After 29 trades it was +0.73R and has fallen since. How to calculate it properly and how many trades a reliable number needs is explained in my article on trading math (in German), and the Kelly criterion uses the same journal numbers.
For the case without an edge there is an idealized reference value. If an account moves in very small, fair steps between a fixed limit and a fixed target, then pass probability = buffer ÷ (buffer + profit target). On the 50K account that is $2,000 ÷ $5,000 = 40%. Mathematically this is the fair case of the gambler’s ruin. The formula assumes that single trades do not jump far past the lines and that no other rules apply.
Real trades do not meet these conditions. Single trades bring several R, days hold up to nine trades, and the target is checked only at the end of the day. In the model with no edge and a static limit, 37%, 29% and 28% of runs pass at 0.5%, 1% and 2% risk, less than the reference value. A single passed test therefore says little about an edge. Whether a strategy really has an advantage is something you check with a large enough sample and a proper backtest, not with one test account.
Risk per trade: how strongly it moves the pass rate in the model
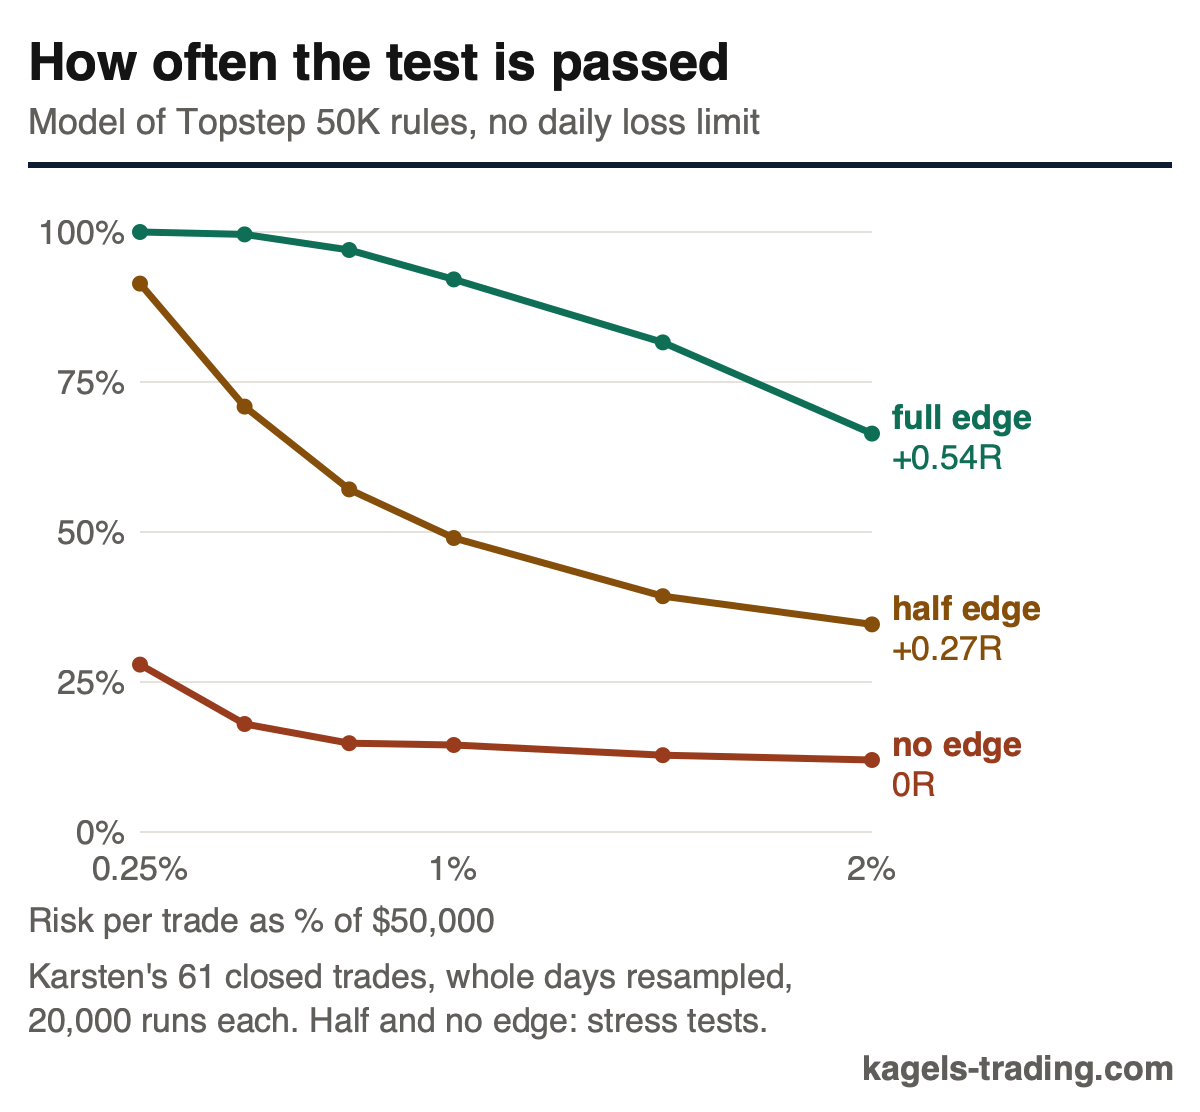
With the trade results held fixed, position size changes the modelled pass rate clearly. The graphic shows the pass rate under Topstep’s rules (end of day, 55% consistency rule, without the optional daily loss limit) for three cases: my edge as traded (+0.54R), half the edge (+0.27R) and no edge. The two weaker cases are freely chosen stress tests: every trade was made worse by the same amount in R.
 Click to enlarge
Source: Kagels Trading, own simulation.
| Risk per trade | Full edge | Half edge | No edge |
|---|---|---|---|
| 0.5% ($250) | 99.6% | 70.9% | 18.0% |
| 1% ($500) | 92.1% | 49.0% | 14.5% |
| 2% ($1,000) | 66.4% | 34.6% | 12.0% |
Pass rates in a simplified model based on closed trades, 20,000 runs each, Topstep 50K rules with the 55% consistency rule, without daily loss limit. Full edge +0.54R, half edge +0.27R.
The stress test with half the edge shows the price of too much risk most clearly. At 0.5% the model passes in 71% of cases, at 2% in only 35%. With the full edge, the rate falls from 99.6% to 66.4% over the same range. Both drops are similar, about 33 to 36 percentage points. No optimal position size follows from this, only the direction: in the model, more risk costs pass rate.
Too little risk also has a price, and it is time. At 0.25% the model passes almost always with the full edge, but the passed runs need a median of 15 trading days to pass. At 1% it is 9 days. Topstep and Take Profit Trader bill their tests monthly. Smaller positions make the test longer and with it the time in which subscription fees can add up. Whether that becomes an extra month depends on your purchase date and your trading days.
Losing streaks are normal and have to fit into the buffer. Five full losses of 1R each cost $2,500 at $500 risk, more than the whole starting buffer. If you take my loss rate of 45.9% and treat each trade as an independent coin toss, a streak of five losses occurs within 61 trades in about 49% of cases. My trades still pass at 1% in the model most of the time because the target is often reached before such a streak arrives. How to size a position from your stop and account is covered in the guide to position sizing, and the wider picture in risk management.
Extra rules: consistency, daily loss and minimum days
Besides the loss limit, additional rules can lower the pass rate or delay passing. The three most common are the consistency rule, the daily loss limit and a minimum number of trading days. Their effect depends on the trade pattern: in the model with half the edge and 2% risk, the consistency rule alone cut the pass rate from 42.9% to 34.6%.
A consistency rule limits the share that the best trading day may have in the total profit. If the share is too large, the profit target rises until the condition is met.
The consistency rule would have kept me in the test for eight more trading days. According to Topstep’s help page on the consistency target, the best day may be at most 55% of the total profit. With the real order of my trades, the model account was above $3,000 on day 9 at 1% risk. It would still have passed only on day 17, because my best day, July 7, alone brought +15.6R. Traders who win rarely but big are slowed down by this rule. In the model, the passed Topstep runs at 1% risk need a median of 9 trading days to pass, without the consistency rule only 4.
The daily loss limit hits days with many trades the hardest. At FTMO the daily limit is the balance at midnight Central European time minus 5% of the initial capital, so minus $5,000 on $100,000. It is monitored on equity, including open positions, swaps and commissions. With the full edge, my model passes FTMO almost always thanks to the 10% buffer. With half the edge and 2% risk, however, the rate falls to 20% there, because my busiest days had up to nine trades. At Topstep, the daily loss limit is optional according to its help pages.
Minimum days make the test longer but hardly change the rate in the model. Take Profit Trader requires 3 trading days, FTMO 4 days per phase. In the model, Topstep and Take Profit Trader ended almost level despite different minimum days and consistency limits; the differences stayed below three percentage points.
What prop firms report about their pass rates
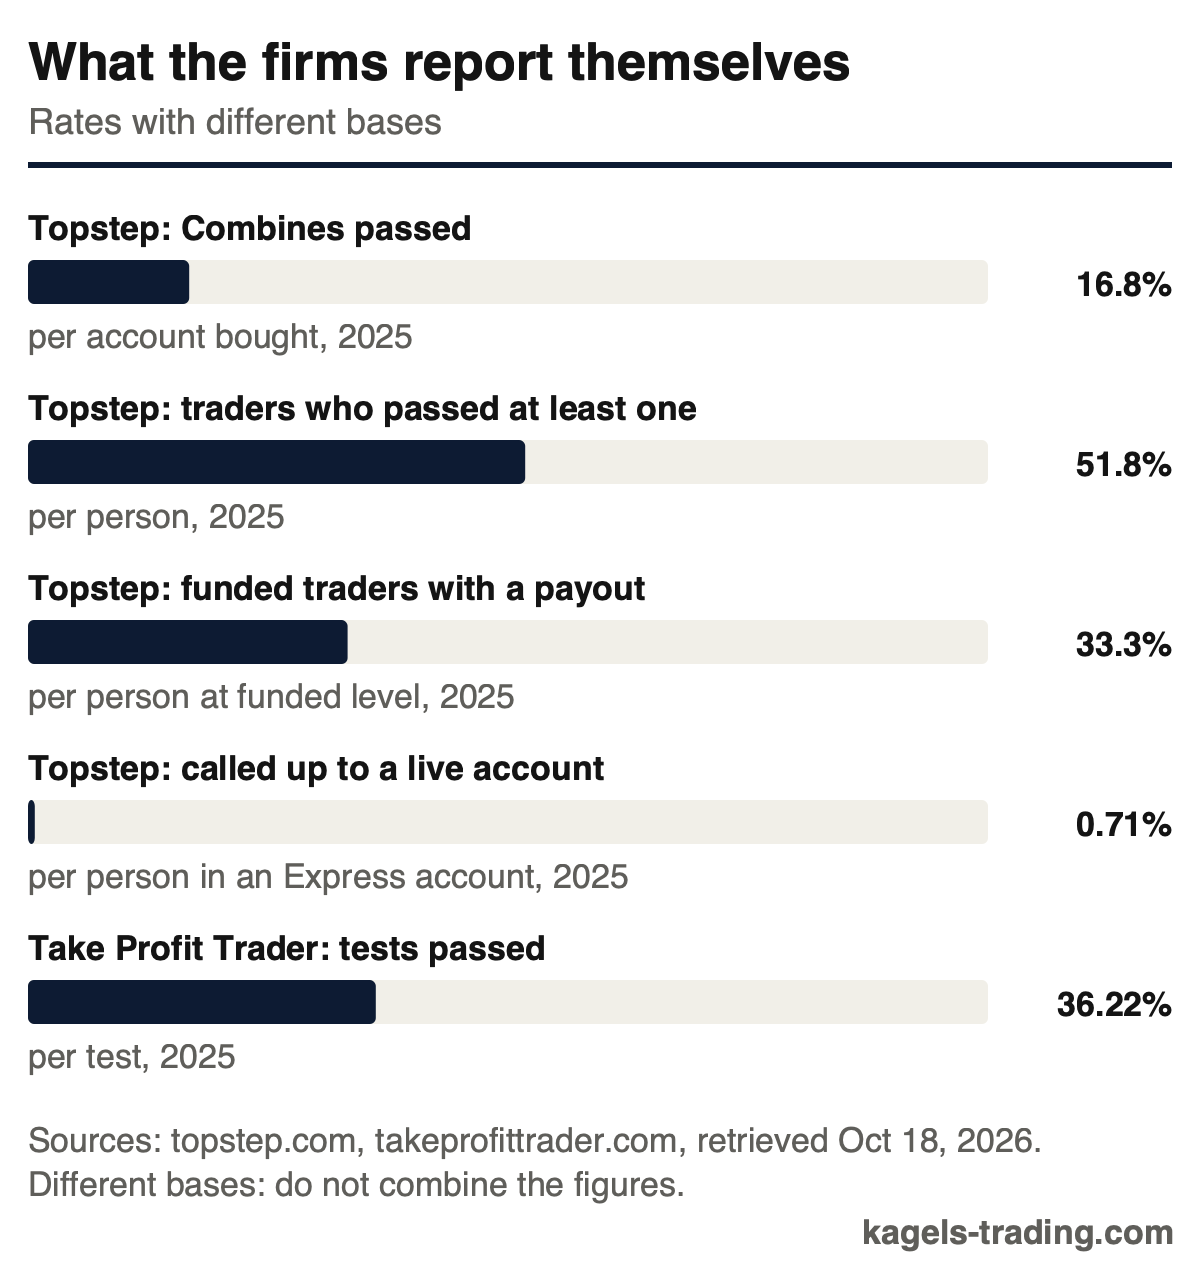
Some firms publish pass rates, but each with a different base. Topstep gives four figures for 2025 in its program disclosure, and Take Profit Trader one on its home page. FTMO does not publish a pass rate. Our research found no independent figures from regulators or research.
 Click to enlarge
The difference between accounts and people is decisive. Topstep reports that 16.8% of all Combines started were passed, but that 51.8% of people passed at least one. Many buy several accounts until one gets through. Of the people at funded level, 33.3% received a payout. 0.71% of traders with an Express Funded Account were called up to a live account.
These figures describe real customers; my model describes my trades. The firm rates come from thousands of traders with their own strategies, position sizes and the rules of 2025. My model uses 61 trades of my own and the rules of October 2026. The two sets of numbers cannot be compared, and nothing follows from the firm statistics about the edge of the customers. Take Profit Trader reports 36.22% of tests passed in 2025, counted per test.
What a prop firm challenge really costs
The cost of a challenge comes per attempt, not per passed account. According to Topstep’s pricing page, the 50K account costs $49 a month plus a $149 activation fee after passing, or $95 a month without an activation fee. Take Profit Trader charges $170 a month according to the price table on its home page, and $130 for the PRO account according to its help page on the activation fee. On its global site, FTMO shows a list price of €540 for the 100K challenge on its home page, at times with a deal price, and refunds the fee of the 2-Step challenge with the first reward. There are no independent price comparisons from regulators; the figures come from the firms.
A worked example shows how quickly attempts add up. Assume every attempt succeeds independently with 16.8% and costs exactly one month with no extra costs. Then it takes almost six attempts on average to the first passed account, at Topstep about $290 in subscription fees plus the $149 activation. This is a hypothetical calculation, not a typical cost: the firm rate says nothing about your personal chance, run times or resets.
After passing, separate payout rules apply. In the 50K Express Funded Account, the standard path needs 5 winning days of at least $150 according to Topstep’s payout policy and, from the second payout on, positive net profit since the last payout. Each request can take at most 50% of the account balance, at most $2,000 in the base version. Traders who add a daily loss limit at checkout get double caps under the current offer. The profit split is 90%. How the firms compare is shown on our prop trading comparison, with details in the reviews of Take Profit Trader and Bulenox.
How we calculated: data, method and limits
The data are real trades and the rules are real firm rules, but the results are still a simplified model. The basis is my 61 closed trades from June 25 to July 17, 2026, from my ongoing trading journal, net of fees. The rules were retrieved on October 18, 2026 from the pages of Topstep, Take Profit Trader and FTMO. At Topstep, the optional daily loss limit is not simulated.
For the main calculation, whole trading days were resampled with replacement. A trading day runs from 22:00 to 22:00 UTC, that is 5 p.m. to 5 p.m. Chicago time in summer and midnight to midnight Central European summer time, and each trade counts on the day of its closing timestamp. This keeps the fact that some trading days had one trade and others nine, which matters for the daily loss limit and the consistency rule. Each combination of rule set, risk and edge ran 20,000 times. Each run ended after at most 250 drawn trading days, at FTMO after 250 days per phase; undecided runs count as not passed, and their share was 0.0% rounded. For the graphic on trade order, by contrast, the 61 trades were shuffled one by one without replacement, and each run ends after the 61 trades at the latest.
There are four limits you should know. First, 61 trades from four weeks are a small sample. Second, my journal contains no open losses, no entry times and no overlapping positions; the checks ran after each closed trade. With every type of limit, a real account can therefore fail earlier than in the model, especially with intraday trailing. Third, contract sizes are not rounded, and other trading restrictions are not modelled. Fourth, FTMO counts trading days by opened positions, the model by days with trades. This article was inspired by the video “The Math of Winning in Prop Firms” by Mulham Trading. The calculation, data and graphics here are our own.
This article is market education based on an educational model, not investment advice. The pass rates describe my trades under simplified rules and are no forecast of any other trader’s results.
Conclusion: at prop firms the limit matters more than the target
A prop firm challenge is a race between two lines, and the lower one is closer. With a $2,000 buffer on the 50K account, risk per trade changes the modelled pass rate clearly. In the Topstep day model, my trades pass in 99.6% of runs at 0.5%, in 92.1% at 1% and in 66.4% at 2%. In the separate order experiment it is 80.7% at 1% and 59.7% at 2%. Whether that applies to you depends on your own, honestly measured edge.
The type of loss limit is the second big lever. A static limit forgives the most, an intraday trailing drawdown the least. Before you buy, read exactly when the limit is recalculated and when it is breached. And compare the fees with a cautious estimate of your own pass rate. Without a proven edge you mostly pay test fees. With an edge and a small position size your chances rise clearly, but there is still no guarantee.
Frequently asked questions about prop firm drawdown
What is the difference between end-of-day drawdown and trailing drawdown at a prop firm?
An end-of-day drawdown only trails at the close of the day; an intraday trailing drawdown trails with every new high. In the end-of-day model, the highest closing balance of a day counts. In the intraday model, an open profit that later disappears counts too. At Topstep and Take Profit Trader, the limit is breached immediately in both cases when the account reaches it during the day.
How much should I risk per trade in a prop firm challenge?
There is no universal number, but the model shows the direction. With my trades, the modelled pass rate fell by about a third between 0.5% and 2% risk. I risk 0.5 to 1% per trade myself; on a 50K account that would be one eighth to one quarter of the starting buffer. Without an edge, no position size helps.
How many traders pass a prop firm challenge?
Topstep reports that 16.8% of the Combines started in 2025 were passed. That is counted per account. Per person it was 51.8%, because many buy several accounts. Take Profit Trader reports 36.22% of tests passed in 2025. FTMO does not publish a rate.
Does Topstep count open losses against the drawdown?
The limit is set at the daily close, but it is breached in real time. Topstep states that the account is liquidated immediately once the Maximum Loss Limit is reached, including through unrealized losses. The limit trails until it reaches the starting balance and then stays there.
How much does a $50,000 prop firm challenge cost?
At Topstep the 50K account costs $49 a month plus $149 activation, or $95 a month without activation. Take Profit Trader charges $170 a month and $130 activation. What decides is the number of attempts: every extra month or reset costs again, so your own pass rate matters more than the monthly price.
Does a trailing drawdown reset every day?
No, the loss limit itself does not reset; it only trails upward. With the end-of-day drawdown at Topstep and Take Profit Trader, it rises after a new closing high and stays fixed from the starting balance on. A daily loss limit, on the other hand, is recalculated every day: at FTMO at midnight Central European time, at Topstep, if chosen, at the start of the trading day at 5 p.m. Chicago time.
This US edition is based on our German edition on kagels-trading.de and has been adapted for US readers.
More Prop Trading guides
- Check Take Profit Trader
Take Profit Trader Review: Rules, Costs and Payouts
Test rules, full costs, PRO and PRO+ payouts and the drawdown rule that changes after you pass.
- Check Bulenox
Bulenox Review 2026: Rules, Costs and Payouts
Three account types for a one-time fee, drawdown options, payout rules and the open questions about the company.
- Check Bitfunded
Bitfunded Review 2026: Rules, Costs and Payouts
A crypto prop firm: four account types, loss limits with open positions, payout review and what the competition prize pool is made of.
- Check IQ Capital
IQ Capital Review 2026: Costs, Rules and Payouts
Crypto, CFD and futures accounts from $9, the strict per-trade loss limit, payout caps and the company in Saint Lucia.