
Atlanta Fed GDPNow: How Accurate Is the GDP Nowcast?


Contents
GDPNow is the best-known real-time estimate of US economic growth. Weeks before the official GDP figure is published, the Federal Reserve Bank of Atlanta already shows a number for the current quarter, and it updates that number after almost every important economic release.
For traders, this makes GDPNow a useful tool, but also an easy one to misread. This review explains what the model calculates, how it works, how far its last estimate has missed the official number since 2011 and where its weak points are. All figures come from the Atlanta Fed, the Bureau of Economic Analysis (BEA) and the New York Fed, checked on 22 October 2026.
GDPNow in 30 seconds
- GDPNow is a model of the Atlanta Fed that estimates US real GDP growth for the current quarter, as an annual rate. It is free and public.
- It is not an official forecast of the Atlanta Fed, the Federal Reserve or the FOMC, and nobody adjusts the numbers by hand.
- The model updates six or seven times a month, usually a few hours after a data release such as retail sales, trade or housing starts.
- Track record: from 2011 to mid 2026 its last estimate missed the BEA’s first official number by 0.77 percentage points on average. Without the Covid year 2020 the average miss was 0.62 points.
- For traders GDPNow is most useful as a growth thermometer between the official GDP reports. Early in a quarter it can swing by several points.
What is GDPNow?
GDPNow is a “nowcast” of US real GDP growth in the current quarter, published by the Federal Reserve Bank of Atlanta.
The number is the seasonally adjusted annual rate, the same measure the BEA uses in its headline GDP release. A GDPNow reading of 3.5% therefore means: if the quarter ended today, the model expects the economy to grow at an annual rate of about 3.5%. It does not mean 3.5% growth over the quarter itself.
The Atlanta Fed is careful to say what GDPNow is not. It is not an official forecast of the bank, its president, the Federal Reserve System or the FOMC, the committee that sets US interest rates. There are also no subjective adjustments: the model only reacts to new data. This is what makes it different from most bank forecasts, which mix a model with the views of an economist.
The model was created by Atlanta Fed economist Patrick Higgins. He described the method in the working paper “GDPNow: A Model for GDP ‘Nowcasting’” (Working Paper 2014-7, July 2014). Live nowcasts exist since the second quarter of 2014; the values for 2011 to early 2014 were calculated afterwards with the same model.
How GDPNow works
GDPNow does not guess GDP as one number, it builds it from the parts. The model estimates 13 subcomponents of GDP, for example consumer spending on goods and services, business investment, housing, government spending, exports and imports, and then adds them up the way the BEA does.
Each subcomponent is fed by monthly data as soon as it is released. The Atlanta Fed names seven key monthly reports:
| Release | What it feeds |
|---|---|
| ISM Manufacturing | Early read on industry and investment |
| International trade (FT900) | Exports, imports, net exports |
| Wholesale trade | Inventories |
| Retail sales | Consumer spending on goods |
| Housing starts | Residential investment |
| Durable goods | Business equipment investment |
| Personal income and outlays | Consumer spending and prices |
Where a monthly figure is still missing, statistical methods fill the gap. The model uses bridge equations that translate monthly data into quarterly GDP parts, Bayesian vector autoregressions and a dynamic factor model, which only fills in monthly data that has not been released yet. As the quarter goes on, more real data replaces these estimates.
The timing follows a fixed pattern. The first nowcast for a quarter comes about 90 days before the BEA’s advance estimate, and the last one on the business day before it. In between, the model updates six or seven times a month, usually two to three and a half hours after the source data is released. The release dates are listed on the GDPNow page of the Atlanta Fed.
How accurate is GDPNow?
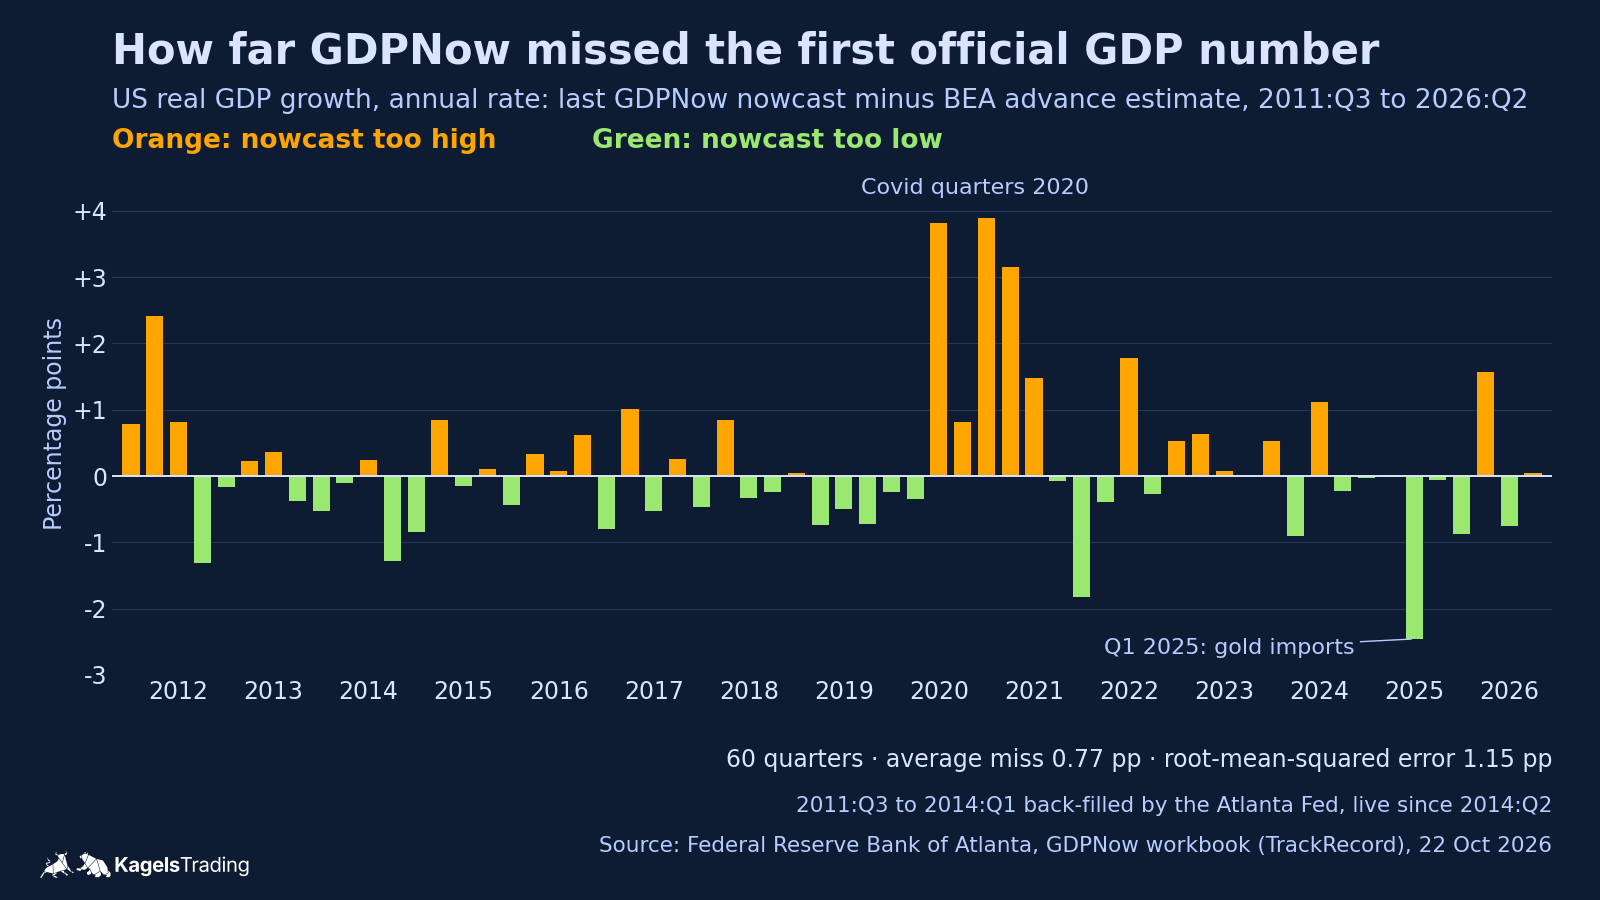
The fair test is the last nowcast before the BEA publishes its first official GDP number for the quarter. That first number is called the advance estimate. The Atlanta Fed keeps the full track record in its public GDPNow workbook, and the chart below shows every miss since 2011.
 Click to enlarge
On average the last nowcast missed the advance estimate by 0.77 percentage points. The Atlanta Fed’s own FAQ gives the same average absolute error of 0.77 points for 2011:Q3 to 2025:Q2 and a root-mean-squared error of 1.17 points. Our count from the same workbook, with the quarters up to 2026:Q2, gives 0.77 and 1.16 points.
The root-mean-squared error weighs large misses more heavily than small ones. When it is clearly higher than the average miss, a few big errors are pulling the result.
Without the Covid year 2020 the model looks clearly better. In 2020 GDP growth swung from minus 32.9% to plus 33.1% (annual rates, advance estimates), and GDPNow missed by up to 3.9 points. Leave out the four quarters of 2020, and the average miss over the remaining 56 quarters falls to 0.62 points and the root-mean-squared error to 0.84 points.
A miss of 0.8 points is small for a model, but large for a trade. If GDPNow says 2.5%, the official number could easily be 1.7% or 3.3%, and that is the difference between “slowing” and “strong” in the headlines. The Atlanta Fed itself writes that its numbers do not give compelling evidence that the model is more accurate than professional forecasters. Its strength is that it is public, updated often and free of personal judgement.
Recent quarters
| Quarter | Last GDPNow | BEA advance estimate | Miss |
|---|---|---|---|
| 2025:Q1 | -2.7% | -0.3% | 2.5 points too low |
| 2025:Q2 | 2.9% | 3.0% | 0.1 points too low |
| 2025:Q3 | 3.5% | 4.3% | 0.9 points too low |
| 2025:Q4 | 3.0% | 1.4% | 1.6 points too high |
| 2026:Q1 | 1.2% | 2.0% | 0.8 points too low |
| 2026:Q2 | 1.5% | 1.5% | about 0 |
Source: Atlanta Fed GDPNow workbook (TrackRecord) and BEA, rounded to one decimal. The miss is calculated from the unrounded values.
The gold problem of 2025: why GDPNow crashed
The largest miss outside the Covid year came in the first quarter of 2025, and the cause was gold. In early 2025 US companies imported unusual amounts of gold. In the monthly trade report these imports pushed the deficit up sharply, and GDPNow, which reads that report, saw a large drop in net exports.
The trouble is that gold bought as an investment does not lower GDP. In the national accounts the BEA removes trade in nonmonetary gold and replaces it with a small adjustment (domestic gold production minus industrial use), as it explains in its FAQ on gold. Gold held for investment therefore does not count as an import in GDP. GDPNow, however, read the gold in the monthly trade report, and the model turned a gold buying wave into an apparent recession signal.
A second problem was the data itself. The Atlanta Fed explains that gold in the monthly Census trade data and on the balance-of-payments basis can differ substantially, partly because of how gold is classified. Its notes on the model changes describe how the adjusted model takes the gold flows out of the trade figures.
The Atlanta Fed reacted with a second, gold-adjusted model. It published this alternative from 6 March 2025 and made it the standard model on 30 April 2025. The difference was large:
| Date | Standard model | Gold-adjusted model |
|---|---|---|
| 6 March 2025 (first published) | -2.4% | -0.4% |
| 1 April 2025 | -3.7% | -1.4% |
| 29 April 2025 (last nowcast) | -2.7% | -1.5% |
On 30 April 2025 the BEA’s advance estimate showed a decline of only 0.3%. The gold-adjusted model was closer, but still 1.2 points too low, and the standard model missed by 2.5 points. For traders the lesson is simple: when GDPNow moves by several points in one update, look at which component moved before you trust the headline number. The Atlanta Fed shows the contributions of every part on its page.
GDPNow for the third quarter of 2026
On 20 October 2026, GDPNow put third-quarter growth at 3.5%. The path shows how much the nowcast can move within one quarter:
| Date (2026) | GDPNow for Q3 |
|---|---|
| 30 July (first nowcast) | 5.0% |
| 3 August | 6.2% |
| 18 August | 4.0% |
| 25 September | 5.0% |
| 30 September | 3.7% |
| 20 October | 3.5% |
The model started at 5.0%, rose to 6.2% and has since come down by 2.7 points. Much of the movement came from net exports and inventories, the two parts the Atlanta Fed itself names as the hardest to read. In the update of 6 October, the model put the contribution of net exports at minus 2.69 points, 0.10 points weaker than in the update before.
Other nowcasts are more cautious. The New York Fed Staff Nowcast stood at 2.7% for the third quarter on 16 October 2026, with an 80% range from 0.1% to 5.4%. The St. Louis Fed economic news index, published on FRED, showed 2.81% on the same day.
The next steps are fixed in the calendar. The Atlanta Fed plans its next update for 27 October and the last nowcast for the third quarter for 28 October 2026. The BEA publishes its advance estimate for the third quarter, according to its release schedule, on 29 October 2026 at 8:30 am Eastern Time (13:30 in central Europe). The FOMC decides on interest rates on 27 and 28 October; all details are in our article on the Fed rate decision.
GDPNow, New York Fed and other nowcasts
GDPNow is the most quoted nowcast, but not the only one. Comparing several models shows whether a number is a broad signal or one model’s view.
| Nowcast | Publisher | Method | Updates |
|---|---|---|---|
| GDPNow | Atlanta Fed | Adds up 13 GDP parts, no judgement | Six or seven times a month |
| Staff Nowcast | New York Fed | Dynamic factor model, with uncertainty range | Every Friday, about 12:45 pm Eastern Time |
| Economic News Index | St. Louis Fed (FRED: STLENI) | Real GDP nowcast from economic news | Weekly |
| Blue Chip consensus | Wolters Kluwer (private) | Survey of professional forecasters | Monthly, paid |
The Atlanta Fed does not comment on differences between its model and the New York Fed’s. A large gap between the two, as in October 2026 with 3.5% against 2.7%, can come from different methods or from different data dates, and it may also mean that the data of the quarter is mixed. In that case the range matters more than either single number. The Atlanta Fed’s own chart also shows the Blue Chip consensus range next to GDPNow, which helps to see how far the model is from professional forecasters.
How traders can use GDPNow
GDPNow is a growth thermometer, not a trading signal. It helps to understand what the market already knows about the quarter before the official GDP release.
- Before the GDP release: markets usually measure a surprise against the consensus of economists published before the release. The last GDPNow and the New York Fed nowcast add context: if they sit far from the consensus, a surprise in their direction is more likely, but not certain.
- Between releases: a large GDPNow change after a data report shows that the report moved the growth picture. This helps to judge whether a move in bond yields or in the US dollar after the data is backed by the numbers.
- For the Fed: strong growth makes rate cuts less likely, weak growth makes them more likely. What the futures market expects for the next Fed meeting is shown by the CME FedWatch Tool; GDPNow is one input behind those expectations, not a forecast of the Fed itself.
- Early in the quarter: treat the first nowcasts with caution. The first estimates rest on little real data, and the model often moves by several points in the first weeks.
Always look at the components, not only at the headline. The Atlanta Fed shows how much each part contributes to the nowcast. If a big jump comes only from inventories or net exports, check what drove it before you trust it. These two parts often move the nowcast most, and in 2025 the gold imports in net exports caused the largest miss outside 2020; a change driven by consumer spending is usually easier to follow back to the data.
Conclusion: GDPNow review
GDPNow is a free, public and often updated estimate of current US growth. Its strengths are transparency, a clear method without personal judgement and a track record that goes back to 2011.
Its weakness is that a single number hides a wide range. An average miss of 0.77 points, swings of several points early in the quarter and episodes like the gold distortion of 2025 show that GDPNow should be one input among several. Read it together with the New York Fed nowcast and the consensus, look at the components, and remember that the BEA’s advance estimate itself will still be revised later.
FAQ about GDPNow
What does GDPNow measure?
GDPNow estimates US real GDP growth for the current quarter as a seasonally adjusted annual rate. It is the same measure that the BEA reports in its headline GDP release, so the two numbers can be compared directly.
Is GDPNow an official Fed forecast?
No, GDPNow is a model, not an official forecast. The Atlanta Fed states that it is not a forecast of the bank, the Federal Reserve System or the FOMC, and the model’s numbers are not adjusted by hand.
How accurate is GDPNow?
From 2011:Q3 to 2026:Q2 the last nowcast missed the BEA advance estimate by 0.77 percentage points on average. The root-mean-squared error was 1.16 points. Without the Covid year 2020 the average miss falls to 0.62 points.
How often is GDPNow updated?
The model updates six or seven times a month. An update usually follows two to three and a half hours after an important data release. The Atlanta Fed publishes the release dates on its GDPNow page.
Why does GDPNow change so much early in a quarter?
At the start of a quarter the model relies mostly on statistical estimates instead of real data. As monthly reports arrive, these estimates are replaced, and the number can move by several points. Net exports and inventories cause the largest jumps.
What is the difference between GDPNow and the New York Fed Nowcast?
Both estimate current US growth, but with different methods. GDPNow adds up 13 GDP components, while the New York Fed uses a dynamic factor model and publishes an uncertainty range. The New York Fed updates once a week, on Fridays.
This article is based on data from the Federal Reserve Bank of Atlanta, the Bureau of Economic Analysis, the New York Fed and the St. Louis Fed, checked on 22 October 2026, and on Karsten Kagels’ experience as a trader. It is market analysis, not investment advice.
More Central Banks guides
- Follow the US dollar
Fed Interest Rate Decision 2026: Dates, Rate and Outlook
Every FOMC date, the latest decision and dot plot, and how much a Fed decision moves markets.
- Follow the euro
ECB Interest Rate Decision 2026: Dates and Latest Decision
Current ECB rates, every meeting date with times and what traders should watch.
- Follow the yen
BoJ Interest Rate Decision: Dates, Times and Japan's Rate
Bank of Japan meeting dates to the end of 2027 and how much the yen and the Nikkei move on BoJ days.
- Follow the British pound
Bank of England Interest Rate Decision: Dates and Times
Every MPC date to the end of 2027 with times, the named votes of 2026 and how much EUR/GBP moves on BoE days.
- Follow the Swiss franc
SNB Interest Rate Decision: Dates, Times and the Swiss Franc
SNB meeting dates to the end of 2027 with times, the latest decision and how much the franc moves on SNB days.
- Follow the Canadian dollar
Bank of Canada Interest Rate Decision: Dates and Times
Bank of Canada dates with times in New York and Europe, the latest decision and how much USD/CAD moves after BoC days.
- Follow the Australian dollar
Next RBA Meeting 2026: Decision Dates, Times and the Aussie
RBA dates with the Monday-evening times in New York, the 2026 votes and how much the Australian dollar moves.
- Read Fed expectations
CME FedWatch Tool Explained: Forecasting Fed Rate Decisions
How FedWatch turns futures prices into rate probabilities, and how accurate it has been.