Introduction: Why the TSX Index Matters for Investors and Traders
The S&P/TSX Composite Index is Canada’s leading stock market benchmark, reflecting the performance of the country’s top publicly traded companies. With Canada’s economy heavily tied to natural resources, financial services, and industrial sectors, the TSX plays a crucial role for both long-term investors and short-term traders looking to capitalize on trends in energy, commodities, and global market shifts.
In this TSX-Index price forecast, we’ll analyze:
✅ Short-term, medium-term, and long-term price movements
✅ Technical analysis indicators (trendlines, Fibonacci, moving averages, RSI)
✅ Macroeconomic influences (Bank of Canada policy, inflation, commodities)
✅ Comparisons to other global indices (S&P 500, NASDAQ, Dow Jones, FTSE 100)
✅ TSX vs. gold, silver, and bonds
✅ ETF and stock picks for different investment strategies
TSX-Index Historical Performance and Long-Term Trend
📈 Key Stats (as of latest data)
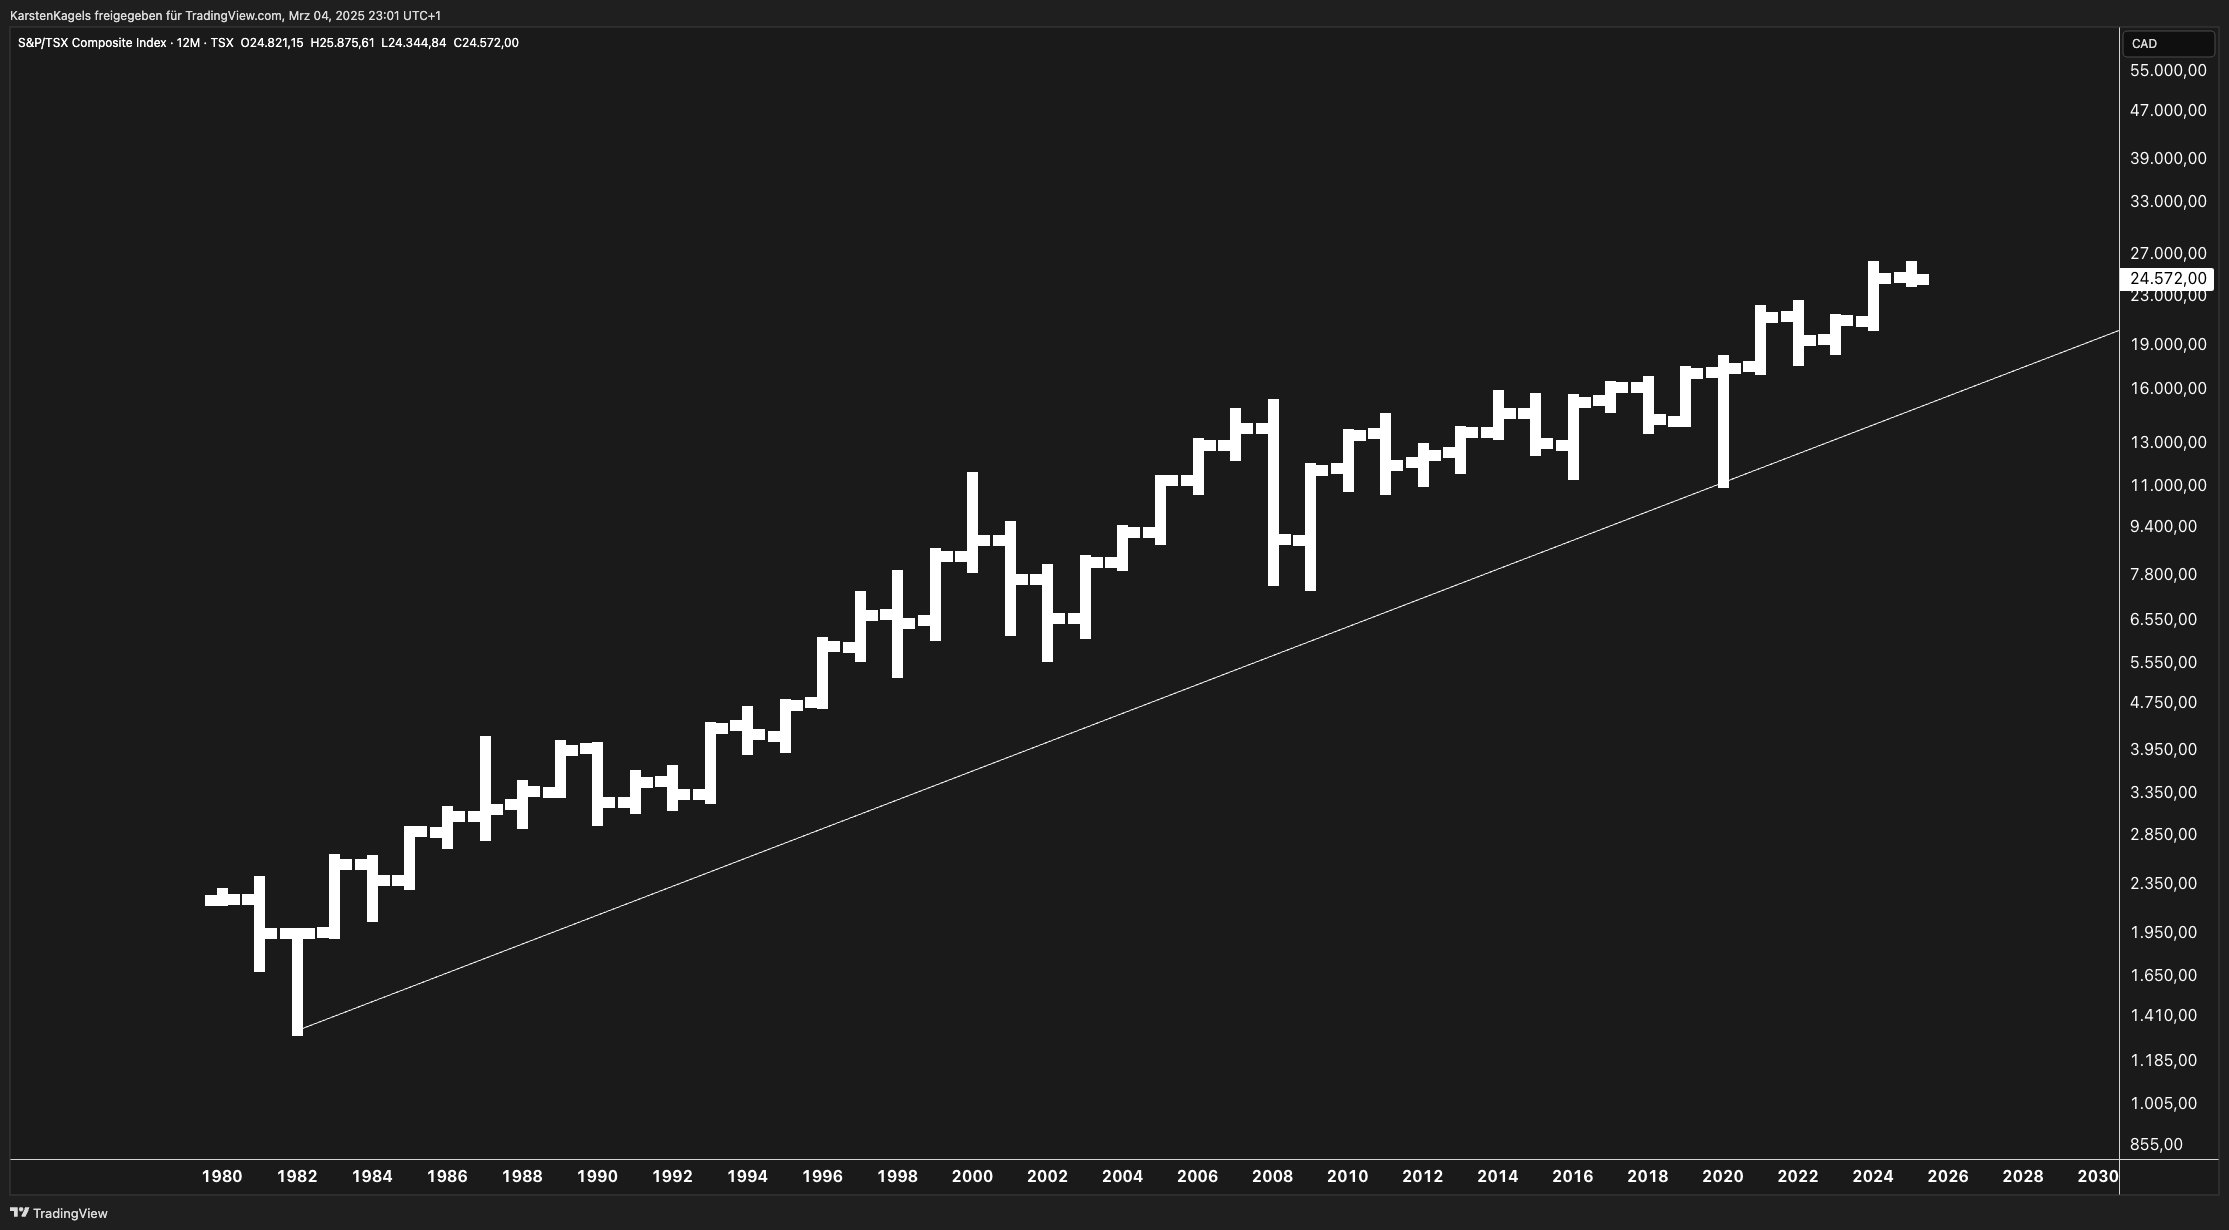
- Current TSX Price: 24,572.00 CAD
- All-Time High: ~25,000 CAD (recent highs)
- Long-Term Trend: Strong upward trajectory, with corrections in 2008 and 2020
Historical Growth and Key Recession Impacts
- 1980-2000: Strong secular bull market, driven by economic expansion and rising commodity demand.
- 2008-2009 Financial Crisis: Major crash but rebounded sharply post-2010 due to stimulus and commodity price recovery.
- 2020 COVID Crash: Rapid 35% drop followed by a V-shaped recovery.
- 2021-Present: Post-COVID rally fueled by inflationary policies, commodity surges, and tech growth.
The long-term trendline (visible in the uploaded chart) remains intact, suggesting continued bullish momentum with occasional corrections.
Technical Analysis: Short-, Medium-, and Long-Term Forecasts
Short-Term (3-6 Months)
🔹 Support Levels: 23,500 | 22,000 (major psychological level)
🔹 Resistance Levels: 25,000 | 27,000 (new highs)
🔹 Indicators:
- 50-day Moving Average (MA): Bullish crossover confirms trend strength
- Relative Strength Index (RSI): Near overbought territory (>70) – possible pullback
- Fibonacci Retracements: 23.6% level around 23,000 acts as support
🔹 Forecast:
Expect range-bound movement between 23,500-25,000, with possible short-term corrections. Traders should watch for breakouts above 25,000 for bullish continuation.
Medium-Term (6-12 Months)
🔹 Key Factors:
- Interest rate policy: Bank of Canada’s stance on rate cuts may fuel equity upside.
- Commodity Prices: Oil, gold, and silver fluctuations impact TSX-heavy resource stocks.
- Economic Growth: GDP growth stability will be crucial.
🔹 Projection:
The TSX could test 27,000 if macroeconomic conditions align, but global recession fears could create volatility.
Long-Term (3-5 Years)
🔹 Structural Growth Drivers:
- Energy transition: Canadian oil and gas remain dominant, but renewables are gaining traction.
- Technology & Financials: Growing sectors in TSX, reducing reliance on commodities.
- Demographics & Immigration: Canada’s strong population growth could boost demand.
🔹 Forecast:
By 2028-2030, the TSX could reach 30,000+, assuming steady economic expansion, controlled inflation, and strong corporate earnings.
Macroeconomic Influences on TSX Performance
1. Canadian Central Bank Policy
- Bank of Canada’s interest rate decisions impact financial stocks and borrowing costs.
- A rate cut cycle would be bullish for TSX stocks, particularly growth sectors.
2. Commodity Price Influence (Oil, Gold, Silver)
- Oil Prices (WTI/Brent): The energy sector (30% of TSX weight) depends on high crude prices.
- Gold & Silver: Inflation and risk-hedging demand can drive mining stocks higher.
3. Global Economic Conditions
- US Recession Risk: A slowdown in the US could drag the TSX lower due to trade dependencies.
- China’s Demand for Resources: If China accelerates infrastructure growth, Canadian exports could surge.
TSX vs. Other Major Indices
| Index | 5-Year Performance | Key Strengths |
|---|---|---|
| TSX Composite | +40% | Strong in energy, banking, commodities |
| S&P 500 | +60% | Tech-heavy, higher innovation growth |
| NASDAQ 100 | +90% | High volatility, but best for growth stocks |
| Dow Jones | +50% | Stable, blue-chip focused |
| FTSE 100 | +25% | Lower growth, heavily weighted in financials |
🔹 Key Takeaway: TSX lags behind tech-driven indices but outperforms commodity-dependent benchmarks like the FTSE 100.
TSX vs. Gold, Silver, and Bonds
| Asset | 5-Year Return | Risk Level |
|---|---|---|
| TSX Index | +40% | Moderate |
| Gold | +30% | Safe-haven, inflation hedge |
| Silver | +20% | Industrial + monetary metal |
| Bonds (Canada 10Y) | -5% | Low risk, but underperforming |
🔹 Key Insight:
- Bullish on TSX? Expect economic expansion, rising corporate earnings.
- Bearish? Consider gold/silver as a hedge in case of downturns.
ETF and Stock Picks for TSX Exposure
Best TSX ETFs
- iShares S&P/TSX 60 ETF (XIU.TO) – Large-cap exposure
- BMO TSX Composite ETF (ZCN.TO) – Broad market coverage
- Horizon TSX Energy ETF (HXE.TO) – Energy-focused
Stock Picks by Sector
- Energy: Suncor Energy (SU.TO), Canadian Natural Resources (CNQ.TO)
- Financials: Royal Bank of Canada (RY.TO), TD Bank (TD.TO)
- Materials: Barrick Gold (ABX.TO), First Majestic Silver (FR.TO)
- Technology: Shopify (SHOP.TO)
Final Thoughts: Should You Invest in the TSX Now?
✅ Bullish Case:
- Economic growth remains stable
- Interest rate cuts stimulate market liquidity
- Commodities stay strong
❌ Bearish Case:
- US recession drags down markets
- Commodities weaken
- High interest rates persist
🔹 Verdict:
- Long-term investors should stay invested, as TSX remains a stable performer.
- Traders should watch for breakouts above 25,000 or dips to 22,000 for entries.
- Gold (XAU/USD) Forecast April 2025: Price Targets & Expert Assessment - April 5, 2025
- ETH/USD Forecast April 2025: Price Targets & Expert Assessment - March 29, 2025
- BTC/USD Forecast April 2025: Price Targets & Technical Analysis After New ATH - March 29, 2025