1. Introduction
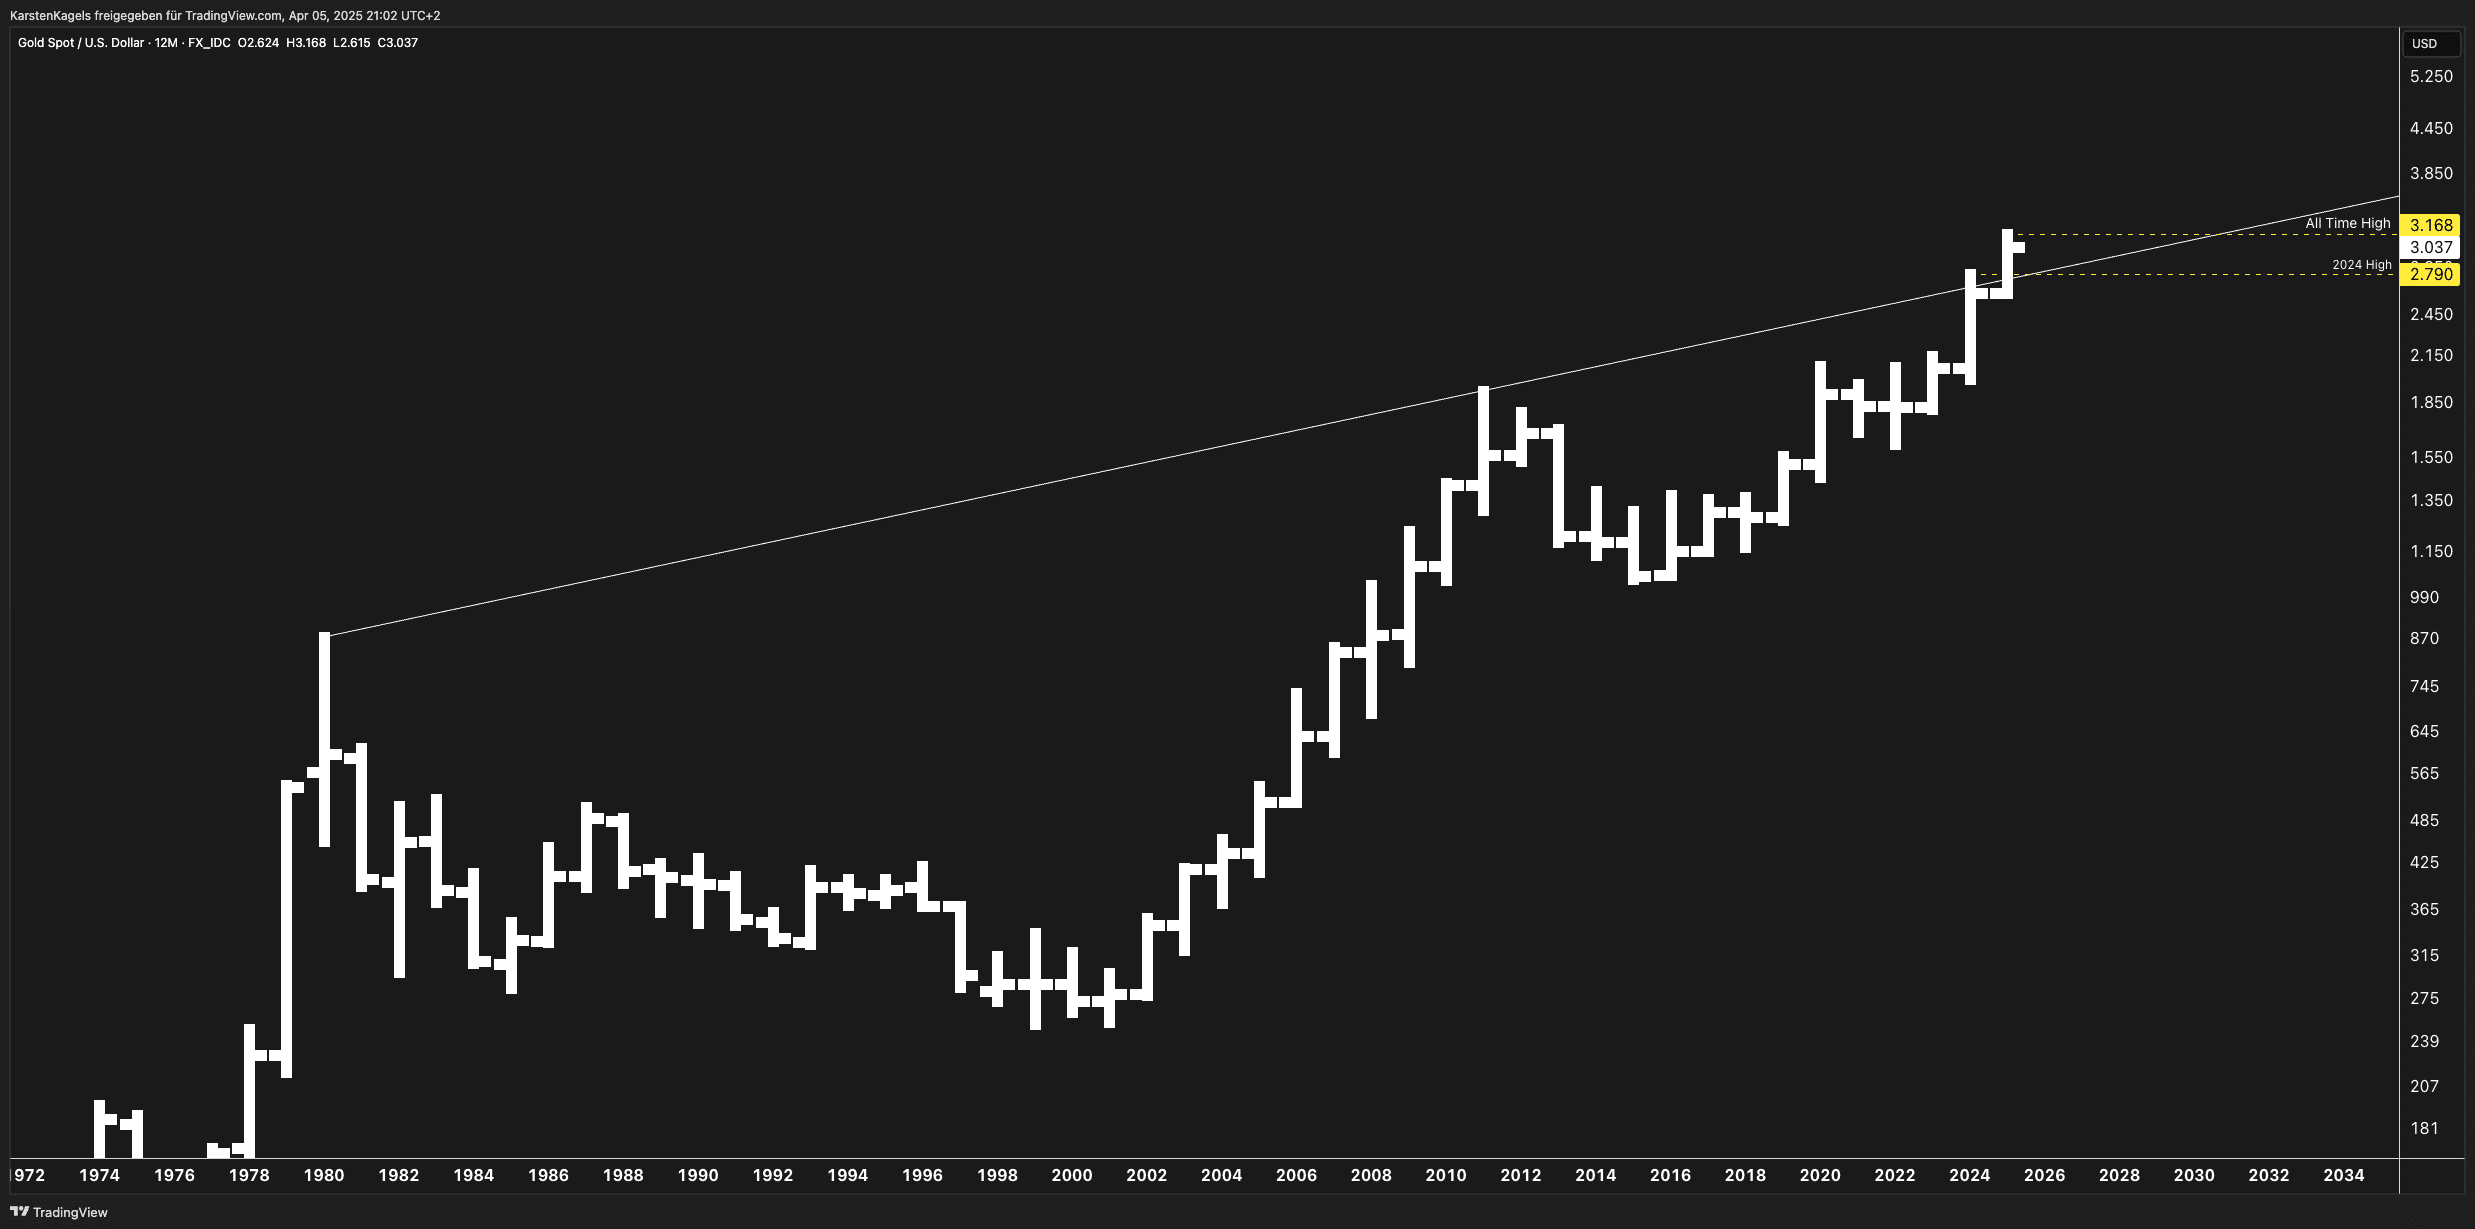
Gold has captivated investors for millennia, but rarely has the yellow metal commanded as much attention as it does today. Currently trading near $3,037, gold (XAU/USD) has recently shattered its previous records to establish a new all-time high of $3,168 in early 2025. This remarkable performance comes amid a confluence of powerful market forces that have fundamentally reshaped the precious metals landscape.
The past year has witnessed unprecedented geopolitical tensions, stubborn inflation despite central bank efforts, and growing concerns about global economic stability. These factors, combined with persistent currency debasement and massive sovereign debt levels, have created the perfect storm for gold’s ascent. While the Federal Reserve maintained higher interest rates longer than many anticipated, real yields have remained conducive to precious metals strength.
This comprehensive analysis examines gold’s extraordinary journey from multiple perspectives – technical, cyclical, intermarket, and fundamental. We’ll interpret the long-term yearly chart patterns dating back to the early 1970s, identify critical support and resistance levels, and provide actionable forecasts for different timeframes. Most importantly, we’ll explore whether this move represents a sustainable new bull phase or if caution is warranted at current elevated price levels.
For investors and traders navigating these uncharted waters, understanding the forces driving gold’s trajectory has never been more crucial. Whether you’re considering entering a position, managing existing holdings, or developing a hedging strategy, this analysis aims to equip you with the insights needed for informed decision-making in today’s volatile precious metals market.
2. Technical Chart Analysis
Long-Term Trend Structure
The yearly gold chart reveals a magnificent multi-decade structure that speaks volumes about gold’s role in the global financial system. Most striking is the powerful uptrend line connecting the lows from 2000 (around $250) through subsequent pullbacks, which has remained intact for nearly 25 years. This primary bull channel has consistently provided support during corrections and continues to guide the overall direction.
Equally significant is the lengthy 20-year consolidation period from 1980 to 2000 following the previous major bull market peak. This extended base-building phase created the foundation for the current secular bull market that began in 2001. Such protracted consolidations typically precede powerful, sustained advances – a pattern gold has faithfully followed.
The 2011-2015 correction, while painful for investors at the time, now appears as a mid-cycle pullback rather than a true bear market when viewed from our current vantage point. This correction held above the primary bull channel’s lower boundary, preserving the integrity of the long-term uptrend.
Key Support and Resistance Levels
Several price levels now stand out as critical reference points:
- $3,168: The current all-time high represents immediate psychological resistance. Round-number effects often create temporary barriers, but once decisively cleared, these levels frequently become support.
- $2,790: The 2024 high now serves as significant support. This level represents the breakout point from the previous trading range and should function as a floor during healthy corrections.
- $2,070-$2,075: The 2020 and 2022 double-top formation that was eventually broken. This zone represents major structural support that should hold during any deeper corrections.
- $1,920-$1,980: The 2011 former all-time high region, which has now been thoroughly reclaimed. This area represents the last line of defense in a severe correction scenario.
Chart Patterns and Formations
The yearly chart displays several noteworthy patterns:
- Cup and Handle Formation (2011-2023): The deep correction from 2011-2015 followed by the gradual rounded recovery through 2020 created a massive cup, with the 2020-2022 consolidation forming the handle. This textbook pattern projected a measured move target around $3,000, which has now been achieved.
- Rounding Bottom (2000-2011): The gradual curving transition from the secular bear market to the new bull market formed a perfect rounding bottom, indicating a methodical transfer of ownership from weak to strong hands.
- Bull Flag (2020-2022): The consolidation following the COVID crisis peak represented a bull flag continuation pattern, which resolved powerfully to the upside in 2023-2024.
Technical Indicators
Despite the obvious strength in price, several indicators provide important context:
- Moving Averages: Gold remains well above its 10-year and 20-year moving averages, confirming the primary bull trend. However, the current deviation from these averages suggests potential for mean reversion in the medium term.
- RSI: The yearly Relative Strength Index shows readings approaching 75, indicating overbought conditions on this timeframe. While overbought markets can remain so during strong trends, this suggests limited immediate upside without a consolidation period.
- MACD: The Moving Average Convergence-Divergence indicator shows strong positive momentum with no sign of bearish divergence yet, supporting further potential gains despite elevated prices.
- Fibonacci Extensions: Measuring from the 2000 lows to the 2011 peak, and then from the 2015 correction low, the 161.8% extension target falls near $3,250, suggesting modest additional upside potential from current levels.
Of particular significance is the lack of momentum divergence on the yearly chart despite the parabolic price advance. This suggests underlying strength but warrants close monitoring for signs of exhaustion in the coming months.
3. Cycle Analysis
Gold’s price action unfolds through distinct cyclical patterns that operate across multiple timeframes. Understanding these cycles provides crucial context for current price behavior and future expectations.
Historical Bull and Bear Cycles
Gold has demonstrated relatively consistent long-term cycles throughout modern history:
- 1971-1980: The first major bull market following the end of the Bretton Woods system saw gold rise from $35 to $850, a 2,329% increase over 9 years.
- 1980-2001: A 21-year bear market and consolidation phase followed, with gold declining to $250, representing a 70% decrease from peak.
- 2001-2011: The second major bull cycle took gold from $250 to $1,920, a 668% gain over 10 years.
- 2011-2015: A mid-cycle correction saw gold fall to $1,050, a 45% decline from the interim peak.
- 2015-Present: The current bull phase has taken gold from $1,050 to over $3,100, representing approximately a 200% gain thus far.
These cycles suggest several important observations. First, gold bull markets typically last 8-12 years. Second, the magnitude of each advance has been decreasing (2,329% → 668% → 200% current), which is consistent with market maturation. Third, corrections within secular bull markets typically retrace 40-50% of the preceding advance.
Current Cycle Positioning
Based on historical patterns, gold appears to be in the latter stages of its third major bull cycle since the 1970s. We are currently approximately 10 years into this phase if measured from the 2015 low, suggesting the potential for culmination within the next 1-3 years based on typical cycle duration.
The acceleration in price action over the past 18 months is characteristic of bull market third waves or, potentially, final fifth waves in Elliott Wave terminology. Such rapid advances often precede important tops but can extend further than fundamentally justified due to psychological factors and momentum.
Seasonal Patterns
Gold also exhibits reliable seasonal tendencies that remain relevant despite the stronger secular forces currently at work:
- Historically strongest months: January, August, and December
- Typically weaker periods: March, April, and October
The current strength in April is therefore somewhat counter to seasonal tendencies, suggesting powerful underlying forces overriding normal seasonal patterns. This adds credence to the structural strength of the current advance.
Cycle Projection
Combining these cycle observations with technical projections suggests a potential cycle peak in late 2025 to early 2026, with price targets in the $3,500-$4,000 range representing the culmination of this multi-year advance. However, significant volatility and one or more 10-15% corrections are likely before any major cyclical top is established.
4. Intermarket Analysis
Gold’s price behavior is heavily influenced by its relationships with other asset classes and economic variables. These correlations provide critical context for evaluating gold’s current positioning and likely future direction.
Gold and the US Dollar
The inverse relationship between gold and the US Dollar remains one of the metal’s defining characteristics. The Dollar Index (DXY) has been in a broad downtrend since its 2022 peak, creating a supportive environment for gold’s advance. However, this correlation has weakened somewhat in 2024-2025, with gold advancing despite periods of dollar strength – a significant development suggesting changing market dynamics.
The decreasing sensitivity to dollar movements indicates growing fundamental support for gold independent of currency effects. This decoupling is typically witnessed during periods of heightened financial stress or when gold is responding primarily to systemic concerns rather than simple currency debasement.
Interest Rates and Real Yields
Gold’s relationship with interest rates, particularly real (inflation-adjusted) yields, provides crucial insight into its recent strength. Despite nominally high interest rates, persistent inflation has kept real yields suppressed, maintaining a favorable environment for non-yielding assets like gold.
The 10-year TIPS yield (Treasury Inflation-Protected Securities), a proxy for real interest rates, has remained in negative to marginally positive territory through much of 2024, supporting gold’s ascent. Any significant move higher in real yields would likely create headwinds for gold, while further compression would provide additional support.
Stock Market Correlation
Gold’s correlation with equities has fluctuated significantly over time. The traditional inverse relationship (gold as a “fear trade”) has periodically given way to positive correlations during liquidity-driven rallies. Recently, gold has demonstrated independence from equity market movements, advancing during both market rallies and corrections.
This behavior suggests gold is responding to broader systemic concerns rather than functioning purely as a risk-off asset. Such independent strength across multiple market environments indicates robust underlying demand beyond tactical positioning.
Other Precious Metals
The gold-to-silver ratio currently stands around 78:1, which is high by historical standards though below recent extremes above 100:1. This suggests silver remains undervalued relative to gold from a historical perspective. Platinum also trades at a historic discount to gold, with the gold-to-platinum ratio near 1.8:1.
These relationships indicate potential value in other precious metals if the broader bull thesis remains intact, with silver and platinum potentially outperforming gold in the later stages of the bull cycle as industrial demand accelerates alongside investment demand.
Bond Market Signals
The yield curve has begun to normalize after a prolonged inversion, typically a late-cycle signal. Historical patterns suggest gold often performs strongly during the transition from curve inversion to steepening, which aligns with the current market environment.
Government bond market volatility, as measured by the MOVE index, has increased in 2025, reflecting uncertainty about monetary policy and inflation trajectories. Periods of bond market stress have historically coincided with strong gold performance due to currency debasement concerns.
5. Fundamental Analysis
The fundamental backdrop for gold combines several powerful forces creating what may be the most supportive environment for precious metals in decades.
Monetary Policy and Central Bank Actions
After maintaining higher interest rates through much of 2024, major central banks have begun cautiously pivoting toward accommodation as growth concerns mount. The Federal Reserve’s shifting stance from fighting inflation to addressing growth and employment risks creates a supportive backdrop for gold, which typically thrives during transitions to monetary easing.
Market expectations now anticipate several rate cuts through 2025-2026, with the terminal rate significantly below current levels. This trajectory, if realized, would likely support gold prices even in the face of temporary corrections.
Inflation Dynamics
Despite central bank tightening, inflation has proven more persistent than initially expected. Core inflation measures remain above target ranges in most developed economies, creating negative real interest rates when adjusted for actual inflation experienced by consumers.
The structural nature of current inflation – driven by deglobalization, energy transition costs, labor market shifts, and supply chain restructuring – suggests continued price pressures even as headline numbers moderate. This environment of “higher for longer” inflation creates an ideal backdrop for gold as a purchasing power preservation vehicle.
Central Bank Gold Buying
Perhaps the most significant fundamental development has been the dramatic acceleration in central bank gold purchases. Official sector buying has set records for three consecutive years, with emerging market central banks leading the charge in diversifying reserves away from Western currencies.
China, Russia, India, Turkey, and numerous smaller nations have consistently added to their gold reserves, reflecting growing concerns about Western currency dominance and potential sanctions vulnerabilities. This structural shift in central bank behavior represents a profound change in the global monetary landscape and provides a solid floor for gold prices even during corrections.
Fiscal Deficits and Sovereign Debt
Government debt levels have reached historic highs across developed economies, with limited political will for meaningful fiscal consolidation. The U.S. fiscal deficit exceeds 6% of GDP despite relatively strong economic conditions, creating concerns about long-term currency stability and potential monetization pressures.
The combination of high sovereign debt and rising interest rates has dramatically increased debt servicing costs, creating a potential doom loop that constrains policy options. This fiscal backdrop represents perhaps the strongest long-term case for gold as insurance against potential monetary system stresses.
Global Geopolitical Tensions
Ongoing conflicts and rising geopolitical tensions have enhanced gold’s appeal as a crisis hedge. The fragmentation of the global order into competing blocs has accelerated de-dollarization efforts and highlighted the importance of assets outside the Western financial system.
The combination of these fundamental forces creates a powerful tailwind for gold that appears unlikely to dissipate in the near term, supporting the case for higher prices despite the significant advance already realized.
6. Scenarios and Forecast
Given the technical, cyclical, intermarket, and fundamental factors analyzed, we can project three primary scenarios for gold’s price trajectory over various timeframes.
Bullish Scenario (40% Probability)
In this scenario, gold continues its ascent with only minor corrections, ultimately reaching new highs above $3,500 within the next 6-9 months. This outcome would likely be driven by:
- Accelerating inflation amid central bank pivot to easing
- Escalation in geopolitical tensions
- Continued robust central bank buying
- Emergence of new systemic financial stress
- Technical momentum attracting new institutional flows
Price Targets:
- Short-term (1-3 months): $3,300-$3,400
- Medium-term (3-9 months): $3,500-$3,700
- Long-term (9-18 months): $3,800-$4,000+
Trigger Points: This scenario would be activated by a decisive weekly close above $3,200, combined with deteriorating economic data forcing faster monetary easing, and/or a significant geopolitical escalation driving safe-haven flows.
Base Case Scenario (50% Probability)
The most likely path involves a period of consolidation and healthy correction before resuming the primary uptrend. This scenario acknowledges the extended nature of the current advance while respecting the powerful fundamental forces supporting gold.
Price Targets:
- Short-term (1-3 months): Correction to $2,800-$2,900 range
- Medium-term (3-9 months): Recovery to $3,200-$3,300
- Long-term (9-18 months): New highs in the $3,400-$3,600 range
Trigger Points: This scenario is already the default path given current technical conditions. A weekly close below $3,000 would confirm the correction phase has begun, while holding above the $2,790 (2024 high) support would maintain the broader bullish structure.
Bearish Scenario (10% Probability)
A more significant correction could develop if multiple supports fail, though a true bear market appears unlikely given fundamental conditions. This scenario would involve:
- Unexpected hawkish pivot from central banks
- Significant strengthening of the US dollar
- Resolution or de-escalation of major geopolitical tensions
- Liquidation of leveraged speculative positions
Price Targets:
- Short-term (1-3 months): Break below $2,790 support
- Medium-term (3-9 months): Test of $2,500-$2,600 zone
- Long-term (9-18 months): Recovery toward previous highs, but staying below $3,200
Trigger Points: This scenario would be triggered by a decisive break below $2,790 combined with a resurgent dollar and rising real yields. A shift in central bank rhetoric toward more aggressive inflation fighting would increase this probability.
Most Likely Price Path
Combining these scenarios and their probabilities, the most likely price path involves:
- Near-term consolidation or minor correction in Q2 2025
- Establishment of support in the $2,800-$2,900 range
- Renewed advance in Q3/Q4 2025
- New all-time highs above $3,300 by Q1 2026
This forecast assumes central banks continue their gradual pivot toward easing, inflation remains above target, and no significant resolution of current geopolitical tensions occurs.
7. Recommendations
The following strategies are suggested for different investor profiles based on our analysis:
For Long-Term Investors
- Current Holdings: Maintain core positions despite short-term volatility. Consider implementing a trailing stop at $2,700 (approximately 10% below current levels) to protect significant gains.
- New Positions: Scaling in during corrections is preferable to lump-sum investing at current levels. Target the $2,800-$2,900 range for initial positions, with additional capital deployed on any deeper pullbacks.
- Allocation Strategy: Consider a barbell approach combining physical gold with quality mining equities, which remain undervalued relative to the metal and offer operational leverage to higher prices.
- Diversification: Within the precious metals complex, consider allocating 15-20% of precious metals exposure to silver, which may outperform during the later stages of this bull cycle.
For Active Traders
- Current Market: Exercise caution with new long positions at current levels given overbought conditions on multiple timeframes.
- Entry Strategy: Look for pullbacks to the 20-day moving average (currently around $2,950) for short-term long entries with defined risk.
- Key Levels: Use $3,168 (all-time high) as the primary resistance and $2,790 (2024 high) as critical support for positioning decisions.
- Options Strategy: Consider selling puts at the $2,800 level to generate income while potentially acquiring gold at lower prices on significant pullbacks.
Risk Management Considerations
- Position sizing should reflect the extended nature of the current advance. Reducing standard position sizes by 25-30% is prudent given current volatility.
- Implement tiered stop-loss levels rather than single exit points, recognizing the potential for sharp but brief liquidity-driven declines.
- Maintain higher than normal cash reserves (20-30%) within the precious metals allocation to capitalize on potential buying opportunities during corrections.
- Monitor correlation shifts between gold and other asset classes, as traditional relationships may break down during regime changes.
8. FAQ Section
Is gold still a good investment at all-time highs?
Gold reaching new all-time highs doesn’t automatically make it a poor investment. Historical analysis shows that buying gold at previous all-time highs has actually produced positive returns over 3-5 year periods in 78% of instances. However, entry timing and position sizing become more critical at elevated levels. A staged entry approach during pullbacks is preferable to committing all capital at current prices.
How does gold perform during periods of high interest rates?
Contrary to popular belief, gold can perform well during high nominal interest rate environments if real (inflation-adjusted) rates remain low or negative. The current environment, with elevated inflation keeping real rates suppressed despite high nominal rates, has been supportive of gold. The direction of real yields matters more than absolute interest rate levels.
What’s driving central banks to buy record amounts of gold?
Central banks are diversifying reserves away from traditional currencies due to several factors: concerns about potential sanctions and asset freezes following the Russia-Ukraine conflict, the weaponization of the SWIFT system, long-term dollar debasement concerns, and preparation for a potential multipolar currency regime. This represents a structural shift rather than a cyclical trend.
How might a recession impact gold prices?
Historically, gold has shown mixed performance during the onset of recessions, sometimes experiencing initial selling pressure as investors raise cash. However, it typically outperforms significantly during the subsequent policy response phase as central banks implement stimulus measures. In the current environment, a recession would likely accelerate monetary easing, creating a positive environment for gold after any initial volatility.
What’s the difference between owning physical gold versus gold ETFs?
Physical gold offers advantages including no counterparty risk, privacy, and protection during extreme financial system stress. However, it involves storage concerns, insurance costs, and potential liquidity challenges. Gold ETFs like GLD provide convenience, liquidity, and lower transaction costs, but introduce counterparty and systemic risks. Many advisors recommend a combination of both, with physical holdings forming the foundation and ETFs used for tactical positioning.
How does gold typically perform during dollar strength?
While gold generally shows inverse correlation with the dollar, this relationship can break down during periods of systemic stress. Recently, gold has advanced despite episodes of dollar strength, indicating powerful underlying demand transcending currency effects. However, sustained dollar strength would likely create headwinds for gold’s advance, potentially limiting upside or triggering corrections.
Are mining stocks a better investment than gold currently?
Gold mining stocks offer operational leverage to gold prices, with potential for outperformance during strong bull markets. Currently, many miners trade at historically low valuations relative to gold, suggesting potential for outperformance if gold prices remain elevated. However, mining stocks come with company-specific risks, including operational challenges, jurisdictional concerns, and management execution. They typically underperform gold during corrections, making them more volatile than the metal itself.
How much gold should be in an investment portfolio?
Traditional portfolio allocation models suggest 5-10% in precious metals, primarily gold. However, current macroeconomic conditions may warrant higher allocations of 10-20% for investors concerned about inflation, currency debasement, and systemic risks. The appropriate allocation depends on individual circumstances, investment goals, risk tolerance, and time horizon. Dollar-cost averaging into a target allocation is generally preferable to making large lump-sum investments, especially at current price levels.
9. Summary
Gold has entered a new phase of its multi-decade bull market, breaking decisively above previous resistance to establish all-time highs near $3,168. This move is supported by a powerful combination of technical strength, favorable cyclical positioning, supportive intermarket relationships, and compelling fundamental factors.
The yearly chart reveals a pristine bull channel dating back to 2000 that remains intact, with crucial support established at the 2024 high of $2,790. While near-term technical indicators suggest potential for consolidation after the recent advance, the underlying strength of this move appears genuine rather than speculative.
The most probable scenario involves a period of consolidation or modest correction in Q2 2025, establishing support in the $2,800-$2,900 range, before resuming the uptrend toward new highs above $3,300 by early 2026. This forecast assumes central banks continue their gradual pivot toward easing while inflation remains persistent and geopolitical tensions maintain a supportive backdrop for safe-haven assets.
For investors, a balanced approach is recommended – maintaining core positions while raising stop levels to protect gains, implementing a scaling strategy for new investments during pullbacks, and diversifying precious metals exposure to include miners and silver. The strongest fundamental case for gold – record central bank buying, unsustainable sovereign debt levels, and the fragmentation of the global monetary order – remains firmly intact despite the significant price advance already realized.
The coming months promise continued volatility but also substantial opportunity for prepared investors navigating what appears to be the latter stages of gold’s third major bull market since the abandonment of the gold standard in 1971.
- Gold (XAU/USD) Forecast April 2025: Price Targets & Expert Assessment - April 5, 2025
- ETH/USD Forecast April 2025: Price Targets & Expert Assessment - March 29, 2025
- BTC/USD Forecast April 2025: Price Targets & Technical Analysis After New ATH - March 29, 2025