The Ultimate S&P 500 Price Forecast: What Awaits Investors in 2025?
The S&P 500 remains the most important benchmark index for investors worldwide. Our comprehensive technical analysis, based on the long-term chart from 1915 to 2023, provides concrete price targets, support levels, and trading strategies. This well-founded S&P 500 forecast offers crucial reference points for both institutional investors and retail traders to guide their investment decisions.
Key Insights at a Glance:
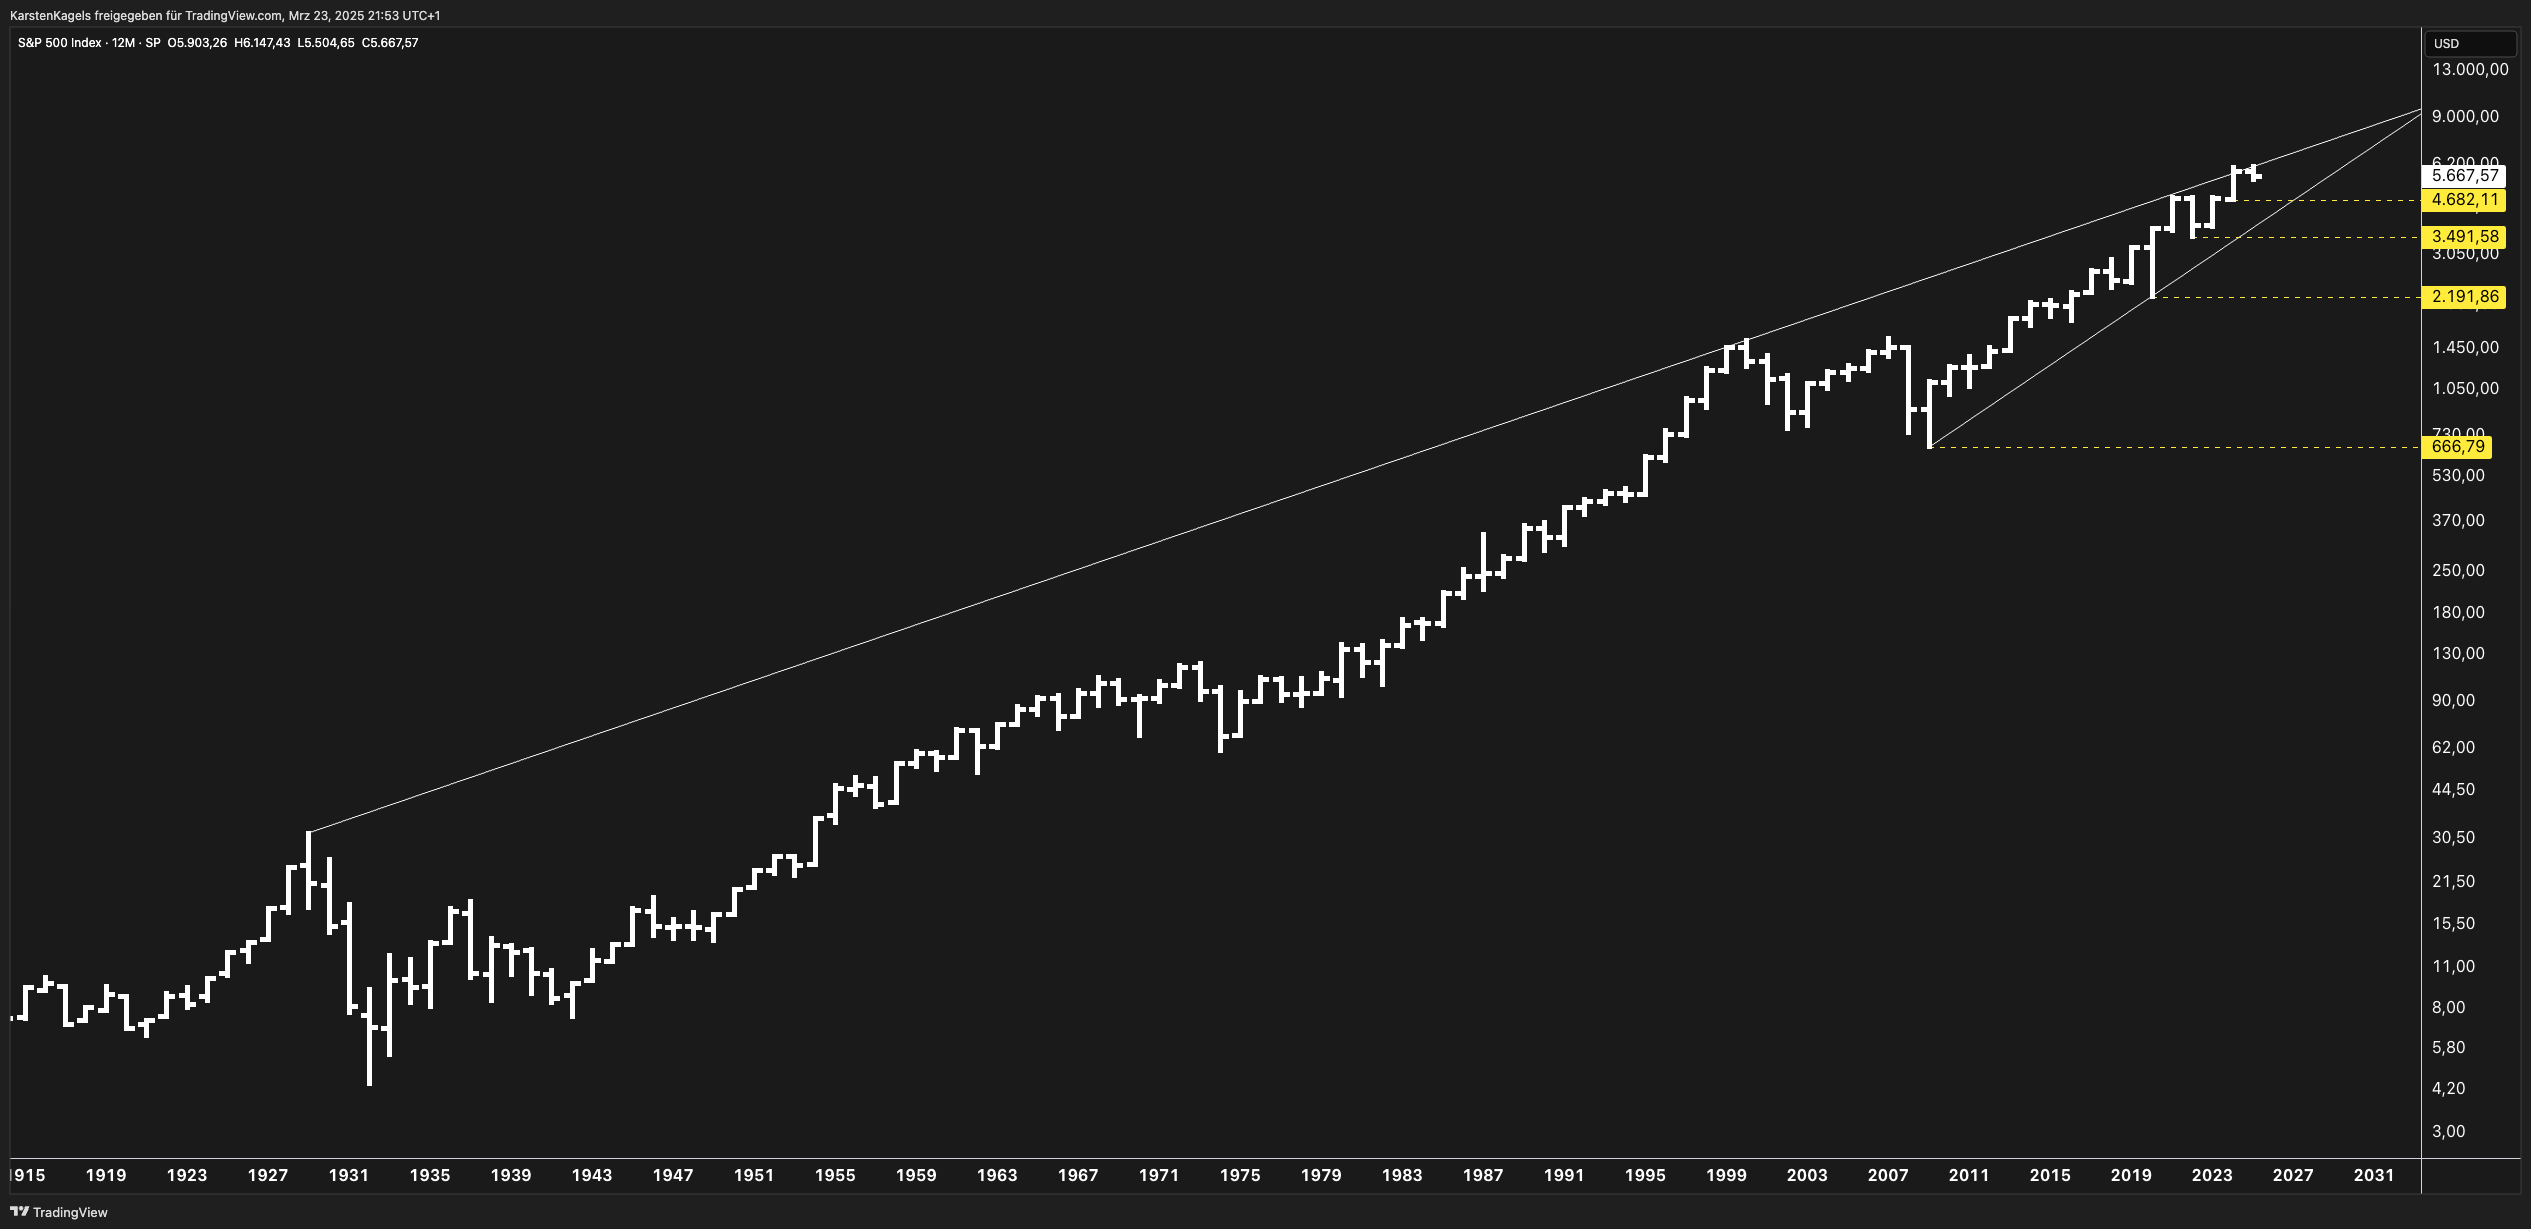
- Current S&P 500 Level: 5,067.57 points
- Primary Resistance Zone: 5,400-5,500 (upper trendline)
- Critical Support Levels: 4,682.11, 3,491.58, 2,191.86
- Main Scenario: Continuation of the long-term uptrend with target 5,400-5,500 in the next 3-6 months
- Risk Factor: Position in the upper range of the long-term trend channel increases consolidation potential
The Current Market Phase of the S&P 500: Where Do We Stand?
The S&P 500 is in a clearly defined long-term uptrend within a stable trend channel. The current closing price of 5,067.57 points positions the index in the upper range of this trend channel. This logarithmic chart display shows that the index has developed remarkable upward momentum since the 1980s, with a significant acceleration after the 2008-2009 financial crisis.
The central question for investors is: Will this strong uptrend continue, or are we facing a significant correction or consolidation?
Chart Analysis Fundamentals: Explained for Beginners
For investors new to technical analysis, here are the basic concepts underlying our S&P 500 forecast:
- Trendlines: These connect the lowest lows (in an uptrend) or the highest highs (in a downtrend) and show the dominant market direction.
- Trend Channel: Formed by two parallel trendlines that define the upper and lower price boundaries within which the market moves.
- Support: Price areas where historically buying interest emerged that stopped price declines.
- Resistance: Price areas where historically selling pressure emerged that slowed price increases.
- Logarithmic Scale: Shows percentage rather than absolute price changes – especially important for long-term charts like the present S&P 500 from 1915 to 2023.
The 5 Critical Price Levels for the S&P 500
Based on the long-term chart, we have identified the following key levels that are of particular importance for investors and traders:
- Upper Trend Channel Line: Resistance area at approximately 5,400-5,500 points
- First Support: 4,682.11 points – crucial for the medium-term trend direction
- Second Support: 3,491.58 points – relevant for deeper corrections
- Third Support: 2,191.86 points – only significant in severe market downturns
- Fourth Support: 669.78 points – extreme crisis protection
These levels provide precise reference points for entry, exit, and stop-loss decisions.
Technical Signals: What the Indicators Reveal
Trend Strength Analysis
The S&P 500 shows exceptionally strong trend structure. The slope of the trend channel has become increasingly steeper since the 1980s, indicating accelerated momentum. This acceleration is both a sign of strength and a potential warning signal for an overheated market phase.
Momentum Consideration
The steep upward movement in the right part of the chart indicates strong positive momentum. Historically, such phases of accelerated growth are often followed by consolidation phases or corrections. The position in the upper range of the trend channel increases this probability.
Mean Reversion Potential
The S&P 500 oscillates between the upper and lower boundaries of its trend channel over the long term. The current position near the upper trend channel line indicates increased mean-reversion potential – a possible return to the middle of the trend channel or even to the lower trendline should be considered.
The Macroeconomic Framework: Factors Influencing the S&P 500
Focus on Interest Rate Policy
The current interest rate situation, transitioning from restrictive to neutral or loose monetary policy, will have a decisive influence on S&P 500 development. Historically, the initial phases of interest rate cutting cycles were often characterized by increased volatility, followed by positive returns.
Statistic: After the Fed’s first interest rate cuts, there were positive 12-month returns for the S&P 500 in 70% of cases.
Inflation Landscape
Inflation has peaked but remains above the long-term average. Moderate inflation (2-3%) is historically positive for stocks, while persistently high inflation can impair earnings growth and compress valuation multiples.
Economic Development
The global economy shows mixed signals. The US continues to show relative strength, which supports the S&P 500. This economic advantage of the US partly explains the outperformance of the S&P 500 versus international indices.
Sector Analysis: The Driving Forces of the S&P 500
The “Magnificent Seven” and Their Significance
Apple, Microsoft, Alphabet, Amazon, Meta, Tesla, and NVIDIA have contributed disproportionately to the performance of the S&P 500. This concentration offers both opportunities and risks:
Statistic: The “Magnificent Seven” account for approximately 30% of the total weighting of the S&P 500.
An analysis of their individual chart patterns and fundamental data remains crucial for the overall forecast of the index.
Sector Rotation as an Early Indicator
The performance of defensive sectors (utilities, consumer staples, healthcare) compared to cyclical sectors (technology, consumer discretionary, industrials) provides important clues about market expectations. Increasing strength in defensive sectors would indicate growing market skepticism.
Comparative Market Analysis: S&P 500 in the Global Context
S&P 500 vs. International Indices
The S&P 500 has consistently outperformed international indices such as STOXX 600, DAX, Nikkei, and Shanghai Composite in recent years. This sustained outperformance could lead to a rotation phase in which international markets catch up.
Statistic: The S&P 500 outperformed the STOXX 600 by an average of 8% per year over the last 10 years.
Stocks vs. Bonds: The Changed Relationship
The current yield relationship between stocks and bonds is a decisive factor for asset allocation. After years of the “TINA” era (“There Is No Alternative” to stocks), bonds with higher yields again offer a serious alternative.
S&P 500 vs. Gold and Commodities
In the long-term comparison, the S&P 500 has outperformed most commodity investments. However, during times of geopolitical uncertainty or rising inflation, gold and selected commodities could show temporary strength.
Statistic: Long-term (10-year basis), the S&P 500 has outperformed gold by about 5% annually.
S&P 500 Forecast: Three Detailed Scenarios for 2025
Main Scenario: Continued Uptrend (60% Probability)
- Short-term Price Target (3-6 Months):
- 5,400-5,500 points (upper trend channel line)
- Possible consolidation phases around the current level
- Continued sector rotation with broader market participation
- Medium-term Price Target (6-18 Months):
- Potential for 5,800-6,000 points in case of breakout above the upper trend channel line
- Increased volatility with periodic pullbacks to the upper trend channel line as new support
- More balanced performance between growth and value stocks
- Long-term Price Target (18-36 Months):
- 6,500-7,000 points with continued structural bull market
- Periodic corrections of 5-15% to the support line at 4,682.11
- Possible reassessment of the trend channel with adjusted slope
Triggers for this Scenario: Successful “soft landing” of the economy, moderate interest rate cuts, solid earnings growth, productivity gains through AI and technology.
Neutral Scenario: Extended Consolidation (30% Probability)
- Short-term Forecast (3-6 Months):
- Sideways movement in the 4,800-5,300 range
- Test of the first support line at 4,682.11
- Increased volatility with frequent directional changes
- Pronounced performance difference between sectors
- Medium-term Forecast (6-18 Months):
- Continued consolidation within the trend channel
- Multiple tests of the lower and upper trend channel lines
- P/E compression alongside moderate earnings growth
- Long-term Forecast (18-36 Months):
- Resumption of the uptrend after extended consolidation
- Potentially new market leaders beyond the current “Magnificent Seven”
- Adjusted market expectations regarding growth and valuations
Triggers for this Scenario: Economic stagnation, delayed or limited interest rate cuts, subdued earnings growth, geopolitical uncertainties.
Negative Scenario: Significant Correction (10% Probability)
- Short-term Warning Signals (3-6 Months):
- Breakthrough below 4,682.11 with possible target 4,200-4,300
- “Bear Market Rallies” with temporary, strong upward movements
- Flight to defensive sectors and high-quality stocks
- Medium-term Development (6-18 Months):
- Test of the second support line at 3,491.58
- Breakthrough below the lower trend channel line
- Establishment of a new, lower trading range
- Substantial reduction in valuation multiples
- Long-term Perspective (18-36 Months):
- Beginning of a new bull market from a lower level
- Structural market changes with new leading sectors
- Revised investment strategies and risk assessments
Triggers for this Scenario: Recession, persistent inflation despite economic weakness, credit events, geopolitical crises, unexpected systemic risks.
Optimal Trading Strategies for Each Investor Type
Long-term Investors: Wealth Building Strategies
- Core Strategy: Dollar-Cost Averaging (DCA) with regular investments regardless of price level
- Sector Allocation: Overweight quality stocks with strong balance sheets, stable cash flow, and pricing power
- Diversification: Broad international diversification with selective overweighting of the US market
- Hedging Strategy: Moderate cash reserve (10-20%) for opportunistic purchases during corrections
Action Plan: Regular monthly investments with increased buying during pullbacks to the first support line (4,682.11)
Medium-term Investors: Position Trading Approaches
- Entry Strategy: Focus on pullbacks to important support levels
- Exit Strategy: Partial profit-taking when approaching the upper trend channel line
- Sector Rotation: Adjustment of sector weighting to the respective market phase
- Relative Strength Approach: Concentration on stocks and sectors with above-average performance
Action Plan: Maintain 40% investment quota, invest 30% at test of first support, reserve 30% for deeper corrections
Short-term Traders: Tactical Trading Strategies
- Trend Channel Trading: Selling near the upper trend channel line, buying near the lower trend channel line
- Momentum Strategy: Exploiting short-term trend directions with stringent risk management
- Volatility Strategy: Adjusting position sizes and trading frequency to the current volatility environment
- News-based Trading: Reactive trading on macroeconomic data and corporate news
Action Plan: Set tighter stop-loss levels, choose smaller position sizes, align profit targets with identified resistance levels
Essential Risk Management for Volatile Market Phases
- Position Sizing: Adjustment of investment size to individual risk tolerance and current market phase
- Trailing Stops: Dynamic adjustment of stop-loss orders to secure profits while participating in upward movements
- Hedging Techniques: Selective use of hedging instruments (options, inverse ETFs) depending on market environment
- Diversification: Strategic distribution across different asset classes, regions, and sectors to reduce risk
- Rebalancing: Regular adjustment of portfolio allocation to maintain strategic asset distribution
Statistic: Portfolios with disciplined risk management achieved 1-2% higher annual returns in the long term with simultaneously reduced volatility.
Monitoring Plan: These Indicators Should Be Watched
Technical Signals
- Breakthroughs through the trend channel lines with increased volume
- Formation of larger chart patterns (head and shoulders, double top/bottom)
- Divergences between price and momentum indicators
- Market breadth indicators such as advance-decline line or new highs vs. new lows
Macroeconomic Data
- Interest rate decisions and forward guidance from central banks
- Inflation data (PCE, CPI, PPI) and their components
- Labor market data (employment, unemployment, wage growth)
- Purchasing Managers’ Indices (PMIs) for manufacturing and service sectors
Fundamental Data
- Earnings expectations and revisions for S&P 500 companies
- Earnings growth rates compared to valuation multiples
- Share buyback volume and dividend development
- Credit standards and default rates in the corporate sector
Conclusion: The Decisive Factors for the S&P 500 in 2025
The technical analysis of the long-term S&P 500 chart shows a robust, long-term uptrend within a stable trend channel. The current price of 5,067.57 positions the index in the upper range of this trend channel, indicating both strength and increased consolidation potential.
The main scenario with 60% probability envisions a continuation of the uptrend with a short-term price target of 5,400-5,500 and medium-term even 5,800-6,000 in case of a breakthrough above the upper trend channel line. At the same time, there is an increased risk for consolidations or corrections to the first support line at 4,682.11.
For investors, the current market offers both opportunities and risks. Crucial for success are disciplined risk management, a strategy adapted to one’s time horizon, and continuous monitoring of technical and fundamental developments.
The combination of technical analysis, macroeconomic context, and sector-specific considerations provides a comprehensive picture for informed investment decisions in the dynamic market environment of 2025.
Frequently Asked Questions about the S&P 500 Forecast
How Accurate is a Technical Long-term Forecast for the S&P 500?
Technical long-term forecasts provide guidance, not precise predictions. The reliability lies in identifying important support and resistance levels and long-term trends. The trend channel of the S&P 500 visible in the chart has served as a reliable framework for price development over decades. Combining with fundamental and macroeconomic factors increases the significance of the analysis.
How Does Central Bank Interest Rate Policy Influence the S&P 500?
Interest rate decisions have a significant impact on valuations, financing costs, and investment allocations. Historically, the S&P 500 has responded positively to interest rate cutting cycles, although the initial phases were often volatile. The transition from restrictive to neutral or loose monetary policy can lead to increased volatility in the short term but supports equity markets in the medium term, provided the economy does not slide into a deep recession.
What Significance Does Sector Weighting Have for the S&P 500 Forecast?
The current dominance of technology stocks, especially the “Magnificent Seven,” has strongly influenced the S&P 500. This concentration represents both a strength and a potential risk. Broader market participation or rotation into other sectors could change the dynamics and risk profile of the index. Historically, the most sustainable bull markets were those with broad market participation across various sectors.
How Should Investors React to this S&P 500 Forecast?
Investors should interpret this forecast according to their individual investment horizon, risk tolerance, and financial goals:
- Long-term Investors: Focus on regular investments with increased buying during corrections
- Medium-term Investors: Use the identified support and resistance levels for strategic entry and exit decisions
- Short-term Traders: Trading within the trend channel with stringent risk management and adjusted position sizes
What Macroeconomic Warning Signals Should Investors Watch?
Critical warning signals that would require a reassessment of the positive forecast:
- Persistently inverted yield curve
- Significant deterioration in labor market data (rising unemployment)
- Widening of credit spreads in the corporate sector
- Significant downward revisions of corporate earnings
- Stubborn core inflation despite economic weakening
How Can the S&P 500 Forecast Be Applied to Individual Stocks?
The overall forecast for the S&P 500 provides an important context for individual stock analyses but does not replace them. Investors should consider:
- Sectoral differences in performance and valuation
- Beta values of individual stocks (sensitivity to market movements)
- Company-specific fundamental data and growth prospects
- Relative strength/weakness of individual stocks compared to the overall index
- Gold (XAU/USD) Forecast April 2025: Price Targets & Expert Assessment - April 5, 2025
- ETH/USD Forecast April 2025: Price Targets & Expert Assessment - March 29, 2025
- BTC/USD Forecast April 2025: Price Targets & Technical Analysis After New ATH - March 29, 2025