Table of Contents
Anzeigen
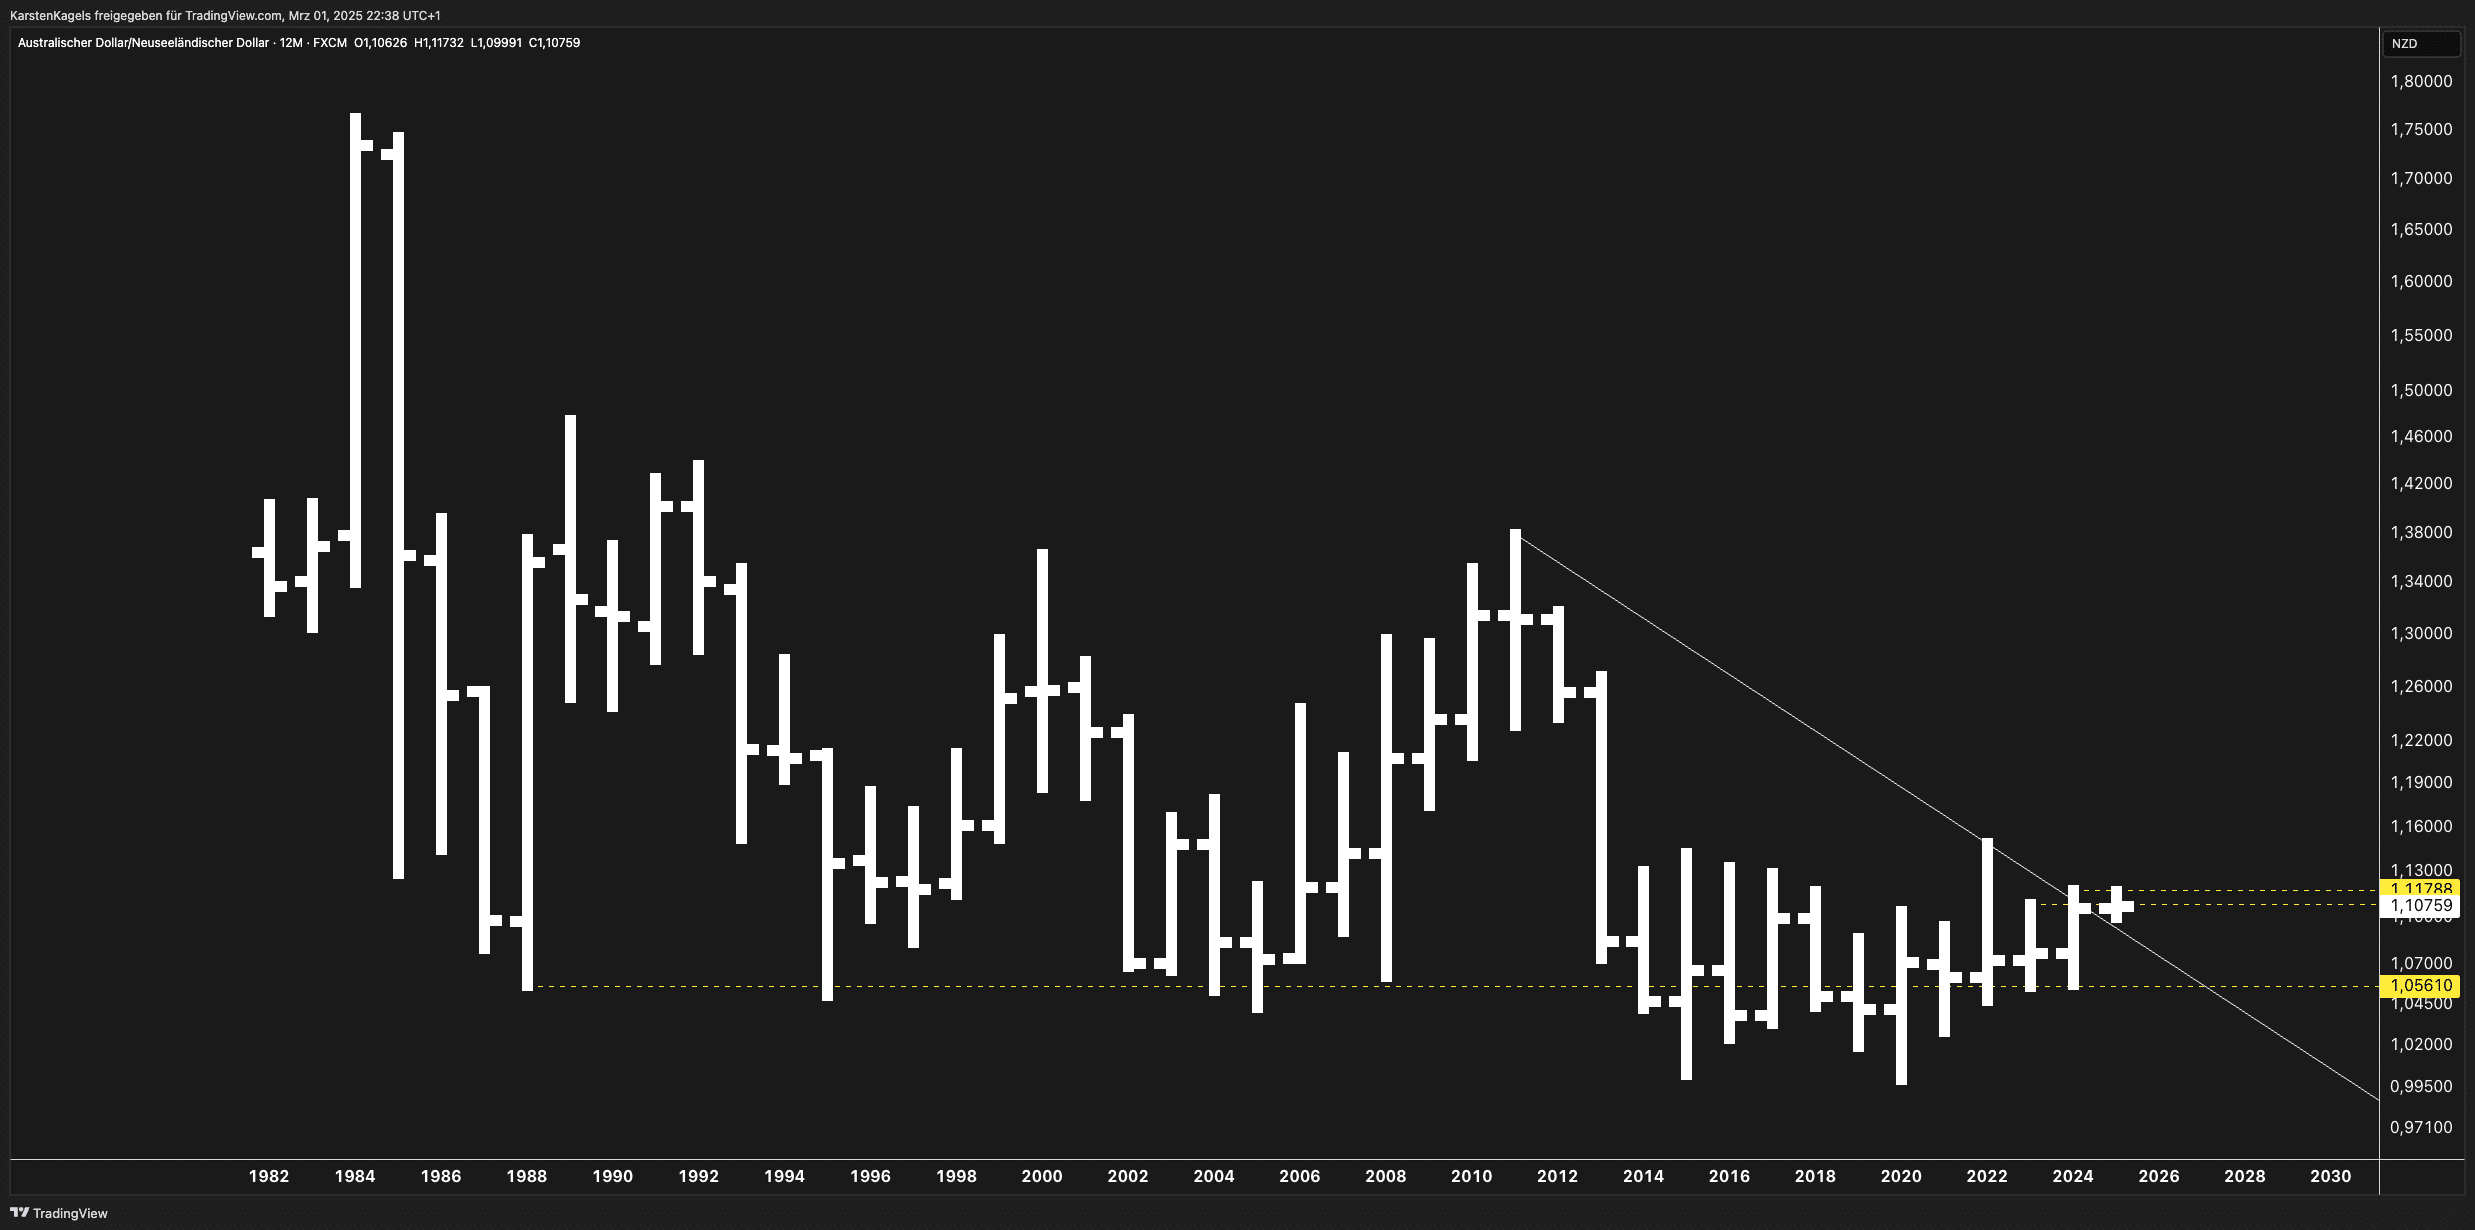
AUD/NZD Long-Term Forecast (Monthly Chart Analysis)
The long-term AUD/NZD monthly chart exhibits a multi-decade downtrend starting from its peak in 2011-2012. However, recent price action suggests a potential trend reversal or at least a significant breakout attempt.
Key Technical Observations:
- Descending Trendline Break:
- The chart shows a clear downtrend resistance dating back to 2011. The most recent price action appears to be testing or even breaking above this trendline.
- A confirmed breakout above this line could indicate a structural shift in market sentiment toward a bullish phase.
- Support & Resistance Levels:
- Key Resistance at 1.1173 (recent local high) → A breakout above this level would reinforce the bullish case.
- Current Price: ~1.1076 → Trading just below resistance, with a strong bullish structure.
- Key Support at 1.0561 → This level needs to hold for further bullish momentum.
- Historical Price Cycles:
- The price has oscillated in a wide range between 1.00 and 1.30 over the last decades.
- If the breakout is confirmed, the next upside targets could be 1.20 or higher, aligning with historical price action.
Forecast & Market Outlook:
- Bullish Scenario:
If AUD/NZD breaks and holds above 1.1173, we could see a further push toward 1.15-1.20 in the coming years. - Bearish Scenario:
If the breakout fails and the price falls below 1.0561, the long-term downtrend could resume, potentially revisiting parity (1.00 level).
Conclusion:
The market is at a crucial decision point. A confirmed breakout above 1.1173 would signal a trend reversal, favoring a long-term bullish outlook. However, failure to sustain above this level could lead to another rejection and continuation of the multi-year bearish trend. Traders should monitor price action around these key levels to determine the next major move.
Latest posts by Karsten Kagels (see all)
- Gold (XAU/USD) Forecast April 2025: Price Targets & Expert Assessment - April 5, 2025
- ETH/USD Forecast April 2025: Price Targets & Expert Assessment - March 29, 2025
- BTC/USD Forecast April 2025: Price Targets & Technical Analysis After New ATH - March 29, 2025