Gold (XAU/USD) Forecast April 2025: Price Targets & Expert Assessment
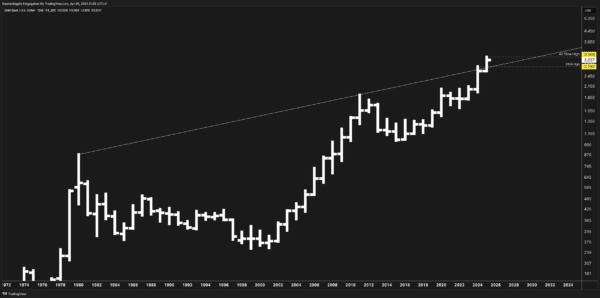
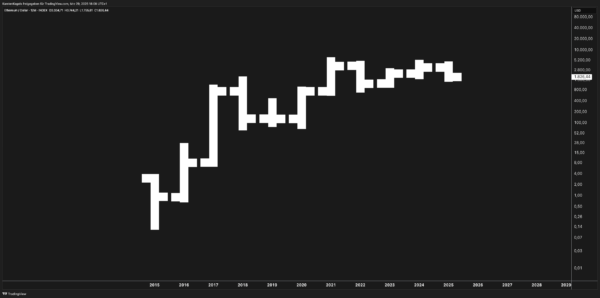
1. Introduction Gold has captivated investors for millennia, but rarely has the yellow metal commanded as much attention as it does today. Currently trading near $3,037, gold (XAU/USD) has recently shattered its previous records to establish a new all-time high of $3,168 in early 2025. This remarkable performance comes amid a confluence of powerful market …