Introduction: Why 10-Year T-Note Futures Matter for Traders and Investors
The 10-Year Treasury Note Futures (ZN) are one of the most closely watched financial instruments in the global markets. As a benchmark for long-term interest rates, ZN influences bond yields, mortgage rates, and overall economic sentiment. Investors, traders, and portfolio managers closely monitor these futures to gauge Federal Reserve policy shifts, inflation expectations, and economic growth prospects.
This analysis provides an in-depth forecast for 10-Year T-Note Futures based on technical indicators, macroeconomic trends, and historical price movements. We examine short-, medium-, and long-term price scenarios to help you navigate potential market opportunities.

1. Technical Analysis
1.1 Key Support and Resistance Levels
- Support:
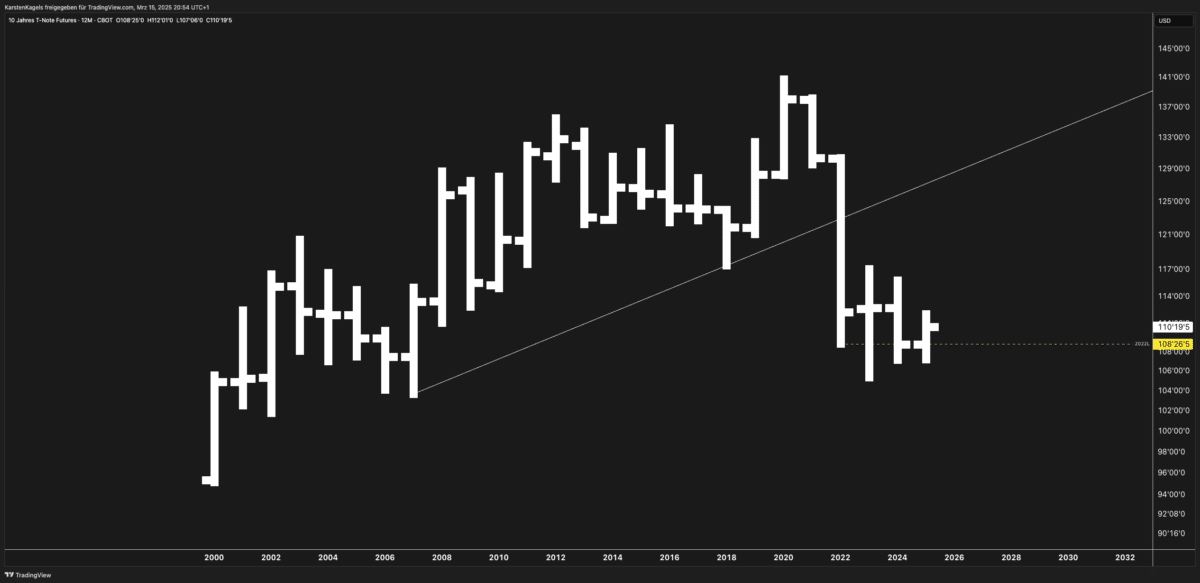
- The 108’26.5 level (marked in yellow on the chart) serves as a key support zone. A break below this level could accelerate the downtrend.
- The psychological 105’00.0 level may provide the next support if selling pressure intensifies.
- Further downside could test the 100’00.0 level, a round number that may attract buyers.
- Resistance:
- The 110’19.5 level is the closest resistance.
- A major resistance zone lies around 114’00.0 – 117’00.0, which previously acted as a consolidation area.
- If the price surpasses 117’00.0, the next major resistance is 125’00.0.
1.2 Chart Pattern & Trend Analysis
- The chart shows a long-term bearish structure, with a breakdown below the multi-decade trendline.
- The market has been consolidating near support levels since the breakdown, indicating potential accumulation or further downside if support fails.
1.3 Key Indicators (RSI & MACD)
- RSI (Relative Strength Index):
- If RSI is below 40, it indicates bearish momentum.
- A move above 50 would signal a potential trend reversal.
- MACD (Moving Average Convergence Divergence):
- A bearish crossover indicates continued downside.
- If the MACD line crosses above the signal line, it could signal a bullish reversal.
2. Macroeconomic Factors Impacting 10-Year T-Note Futures
2.1 Interest Rate Decisions
- The Federal Reserve’s stance on interest rates is the most crucial driver for the 10-Year T-Note.
- If the Fed signals rate cuts, bond prices (ZN) will rise, while rate hikes will pressure prices further.
- The upcoming FOMC meetings and CPI reports will provide key insights into policy shifts.
2.2 Inflation Trends
- High inflation keeps interest rates elevated, which negatively impacts bond prices.
- If inflation cools faster than expected, it could support bond prices.
2.3 Geopolitical Risks
- Global uncertainty (e.g., geopolitical tensions, economic downturns) often drives investors toward bonds as a safe haven.
- If risk-off sentiment prevails, bond prices could see a short-term rally.
3. Price Forecast Scenarios
3.1 Short-Term (Next 1 Week)
- Bearish case: If 108’26.5 fails as support, a drop toward 105’00.0 is likely.
- Bullish case: A bounce from current levels could see a retest of 110’19.5.
3.2 Medium-Term (3–6 Months)
- Bearish case: If inflation remains sticky and the Fed delays rate cuts, ZN could decline toward 105’00.0 or even 100’00.0.
- Bullish case: If economic slowdown fears grow, bonds could rally towards 114’00.0 – 117’00.0.
3.3 Long-Term (1 Year+)
- Bearish case: A prolonged rate-hike cycle could push bond futures toward the 100’00.0 level.
- Bullish case: A Fed pivot with aggressive rate cuts could drive ZN back to 125’00.0 or higher.
4. Comparative Analysis
- Compared to German Bunds (10-Year) and UK Gilts, ZN has been under heavier pressure due to the Fed’s higher-for-longer stance.
- In contrast, gold prices have held up well, benefiting from inflation hedging.
- Investors should consider diversifying with short-term bonds, inflation-protected securities (TIPS), or gold.
Conclusion
The 10-Year T-Note Futures remain under pressure, but the direction will depend on the Fed’s policy stance. Traders should monitor inflation data, interest rate decisions, and key technical levels to navigate the market successfully.
FAQ: 10-Year T-Note Futures (ZN) Explained
What are 10-Year T-Note Futures?
10-Year Treasury Note Futures (ZN) are contracts that allow investors to speculate on or hedge against changes in U.S. Treasury yields. They are one of the most traded fixed-income futures worldwide.
Why are 10-Year T-Note Futures important?
ZN serves as a benchmark for long-term interest rates and is heavily influenced by Federal Reserve policies, inflation expectations, and macroeconomic conditions.
What moves the price of 10-Year Treasury Futures?
Key drivers include:
- Federal Reserve interest rate decisions
- Inflation expectations
- Geopolitical risks & market sentiment
- Supply & demand dynamics in the bond market
Are bonds and bond futures a safe investment?
Bonds are traditionally seen as safe-haven assets, but their prices fluctuate based on interest rates. In rising rate environments, bond prices decline, while in falling rate environments, they increase.
How can traders take advantage of 10-Year T-Note Futures?
Traders can use technical analysis, macroeconomic data, and hedging strategies to navigate the bond market effectively. Leveraged positions can also amplify returns, but they carry higher risk.