Introduction: The Future of the SSE Composite Index
The SSE Composite Index (SSE) is one of China’s most important stock market benchmarks, tracking the performance of all A-shares and B-shares listed on the Shanghai Stock Exchange. As we move further into 2025, investors are looking for insights into the SSE forecast to make informed trading and investment decisions.
In this detailed analysis, we will cover:
- Technical analysis of the SSE Composite Index chart.
- Macroeconomic factors influencing China’s stock market.
- Comparative performance against global indices and commodities.
- Short-, medium-, and long-term price predictions.
Whether you’re a retail trader, institutional investor, or a beginner, this guide will provide valuable insights into the SSE stock market outlook for the coming years.
1. SSE Composite Index Technical Analysis
1.1 Long-Term Chart Patterns & Key Resistance Levels
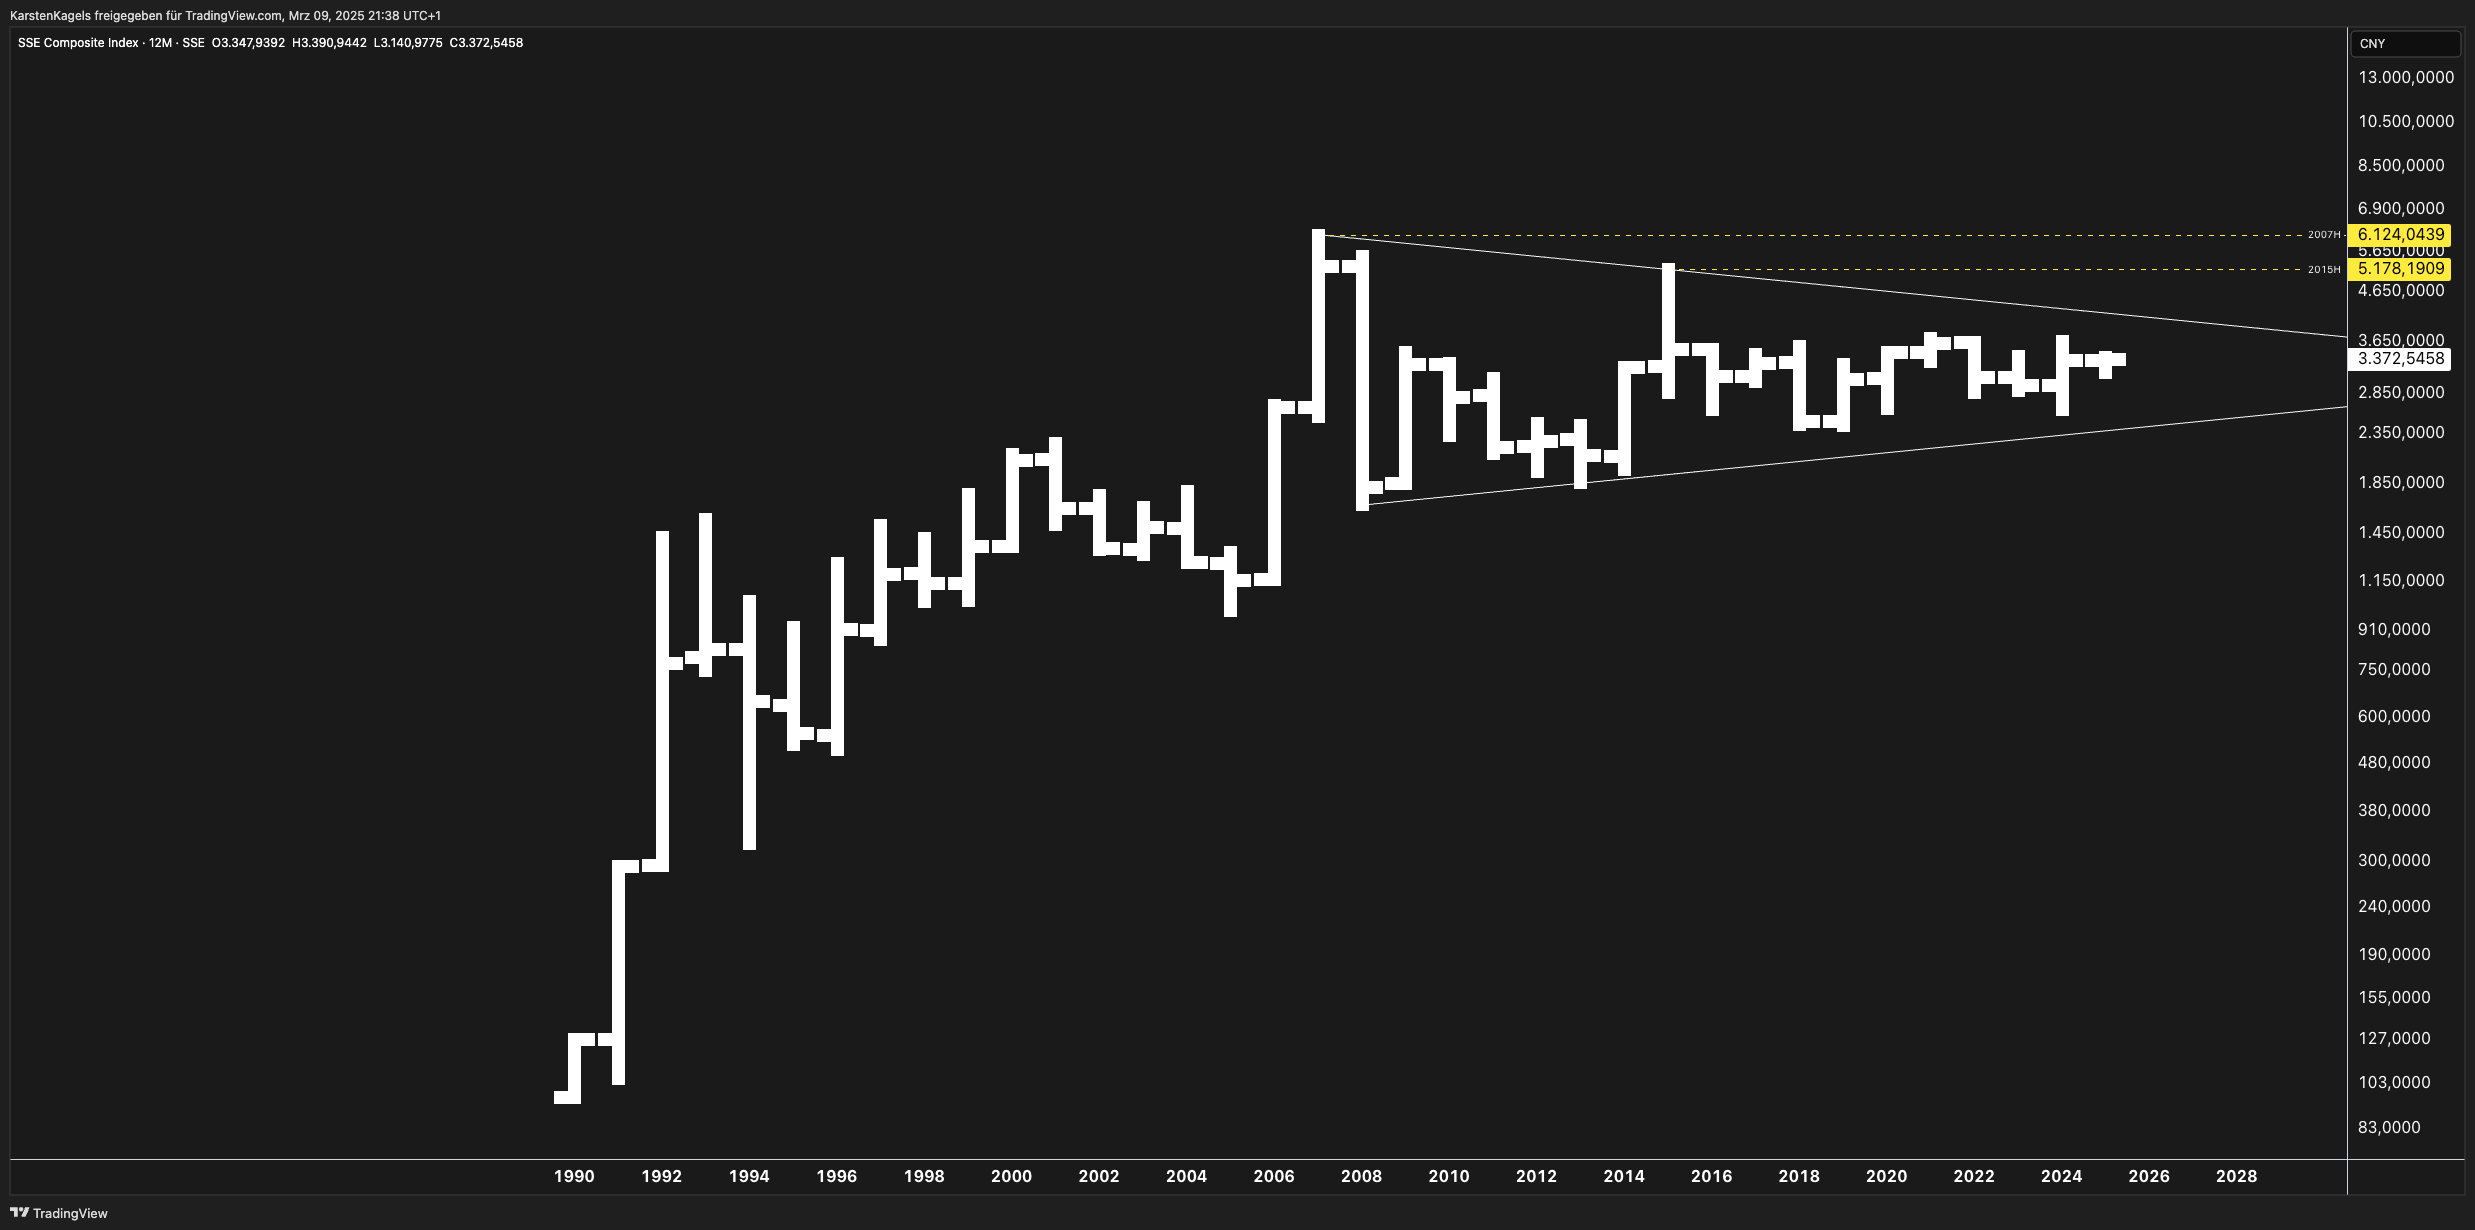
Analyzing the long-term SSE Composite Index chart, we observe the following key technical patterns:
- Symmetrical Triangle Formation: The index has been consolidating within a large symmetrical triangle pattern, with resistance around 6,124 (2007 high) and long-term support near 2,850.
- Breakout Potential: If SSE breaks above 5,178 (2015 high), a bullish breakout could push the index towards the 6,900 level.
- Key Support Levels: Downside risks remain if SSE breaks below 3,000, which could lead to a retest of 2,350.
1.2 Moving Averages & Fibonacci Retracement
- 200-Month Moving Average: Currently acting as strong dynamic support.
- Fibonacci Retracement: The 50% retracement from 2007 high to 2018 low is around 4,650, which serves as an intermediate resistance level.
1.3 Short-Term Technical Indicators
- RSI (Relative Strength Index): Currently neutral, suggesting neither overbought nor oversold conditions.
- MACD (Moving Average Convergence Divergence): Showing a potential bullish crossover on the monthly chart, which could indicate an upward trend shift.
2. Macroeconomic Factors Impacting SSE
2.1 China’s Economic Growth & Monetary Policy
- China’s GDP growth forecast for 2025 is around 4.5% – 5.0%, with policymakers emphasizing stimulus measures to support the economy.
- The People’s Bank of China (PBOC) is expected to maintain an accommodative monetary policy, potentially cutting interest rates to stimulate growth.
- Government stimulus programs focusing on tech, renewable energy, and infrastructure could benefit specific SSE-listed companies.
2.2 Global Economic Risks & Geopolitical Tensions
- The U.S.-China trade relationship remains a key factor, with potential tariffs impacting large-cap Chinese stocks.
- A stronger U.S. dollar and Federal Reserve interest rate decisions could influence capital flows into emerging markets, including China.
- Real estate market concerns in China continue to pose risks, with companies like Evergrande facing restructuring challenges.
3. SSE vs. Global Indices & Commodities
3.1 Performance Against Major Stock Indices
- S&P 500: The SSE has underperformed the S&P 500 over the last decade but could see a reversal if China’s economy stabilizes.
- Hang Seng Index: The SSE remains less volatile than the Hang Seng, which is heavily weighted towards tech stocks.
- Nikkei 225: Japan’s stock market has outperformed SSE recently due to strong corporate earnings and currency trends.
3.2 Comparison with Gold & Other Commodities
- Gold: If inflation fears persist, gold may outperform SSE as a safe-haven asset.
- Copper: As a leading economic indicator, copper prices correlate with SSE performance, particularly given China’s demand for industrial metals.
4. SSE Composite Index Forecast: Short-, Medium-, and Long-Term
4.1 Short-Term Forecast (Next 6 Months)
- Bullish Scenario: SSE breaks above 3,650, targeting 4,000 if economic recovery accelerates.
- Bearish Scenario: If SSE drops below 3,000, a retest of 2,850 is possible.
4.2 Medium-Term Forecast (2025-2026)
- Bullish Target: If China’s stimulus policies work, SSE could test 5,000.
- Neutral Case: SSE stabilizes between 3,800 – 4,500 with moderate economic growth.
- Bearish Risk: A breakdown below 2,850 would indicate prolonged economic weakness.
4.3 Long-Term Forecast (2027 & Beyond)
- Bull Market Scenario: If China’s economy continues growing at 5%+ per year, SSE could reach 6,900 (previous all-time high).
- Bearish Scenario: Structural issues (debt, geopolitical risks) could cap SSE below 4,500.
5. Beginner’s Guide to the SSE Composite Index
5.1 What is the SSE Composite Index?
The SSE Composite Index tracks all stocks traded on the Shanghai Stock Exchange, including large-cap industrials, financials, and technology stocks. It is considered the main benchmark for China’s equity market.
5.2 How to Invest in the SSE?
- ETFs: Investors can gain exposure through China-focused ETFs like the iShares MSCI China ETF (MCHI).
- ADR Stocks: Some Chinese stocks trade on U.S. exchanges via American Depositary Receipts (ADRs).
- CFDs & Futures: Active traders can speculate on SSE price movements via contracts for difference (CFDs) or SSE futures contracts.
- Gold (XAU/USD) Forecast April 2025: Price Targets & Expert Assessment - April 5, 2025
- ETH/USD Forecast April 2025: Price Targets & Expert Assessment - March 29, 2025
- BTC/USD Forecast April 2025: Price Targets & Technical Analysis After New ATH - March 29, 2025