In this in-depth article, we provide a detailed NZD/USD price forecast to help you navigate the currency pair’s potential trajectory. By combining technical analysis, macroeconomic data, and comparative assessments against other major assets, we aim to give both retail and institutional traders a clear picture of what lies ahead. Whether you’re an experienced forex trader or a beginner just starting out, this forecast offers valuable insights for the short-term, medium-term, and long-term horizons.
1. Historical Overview of NZD/USD
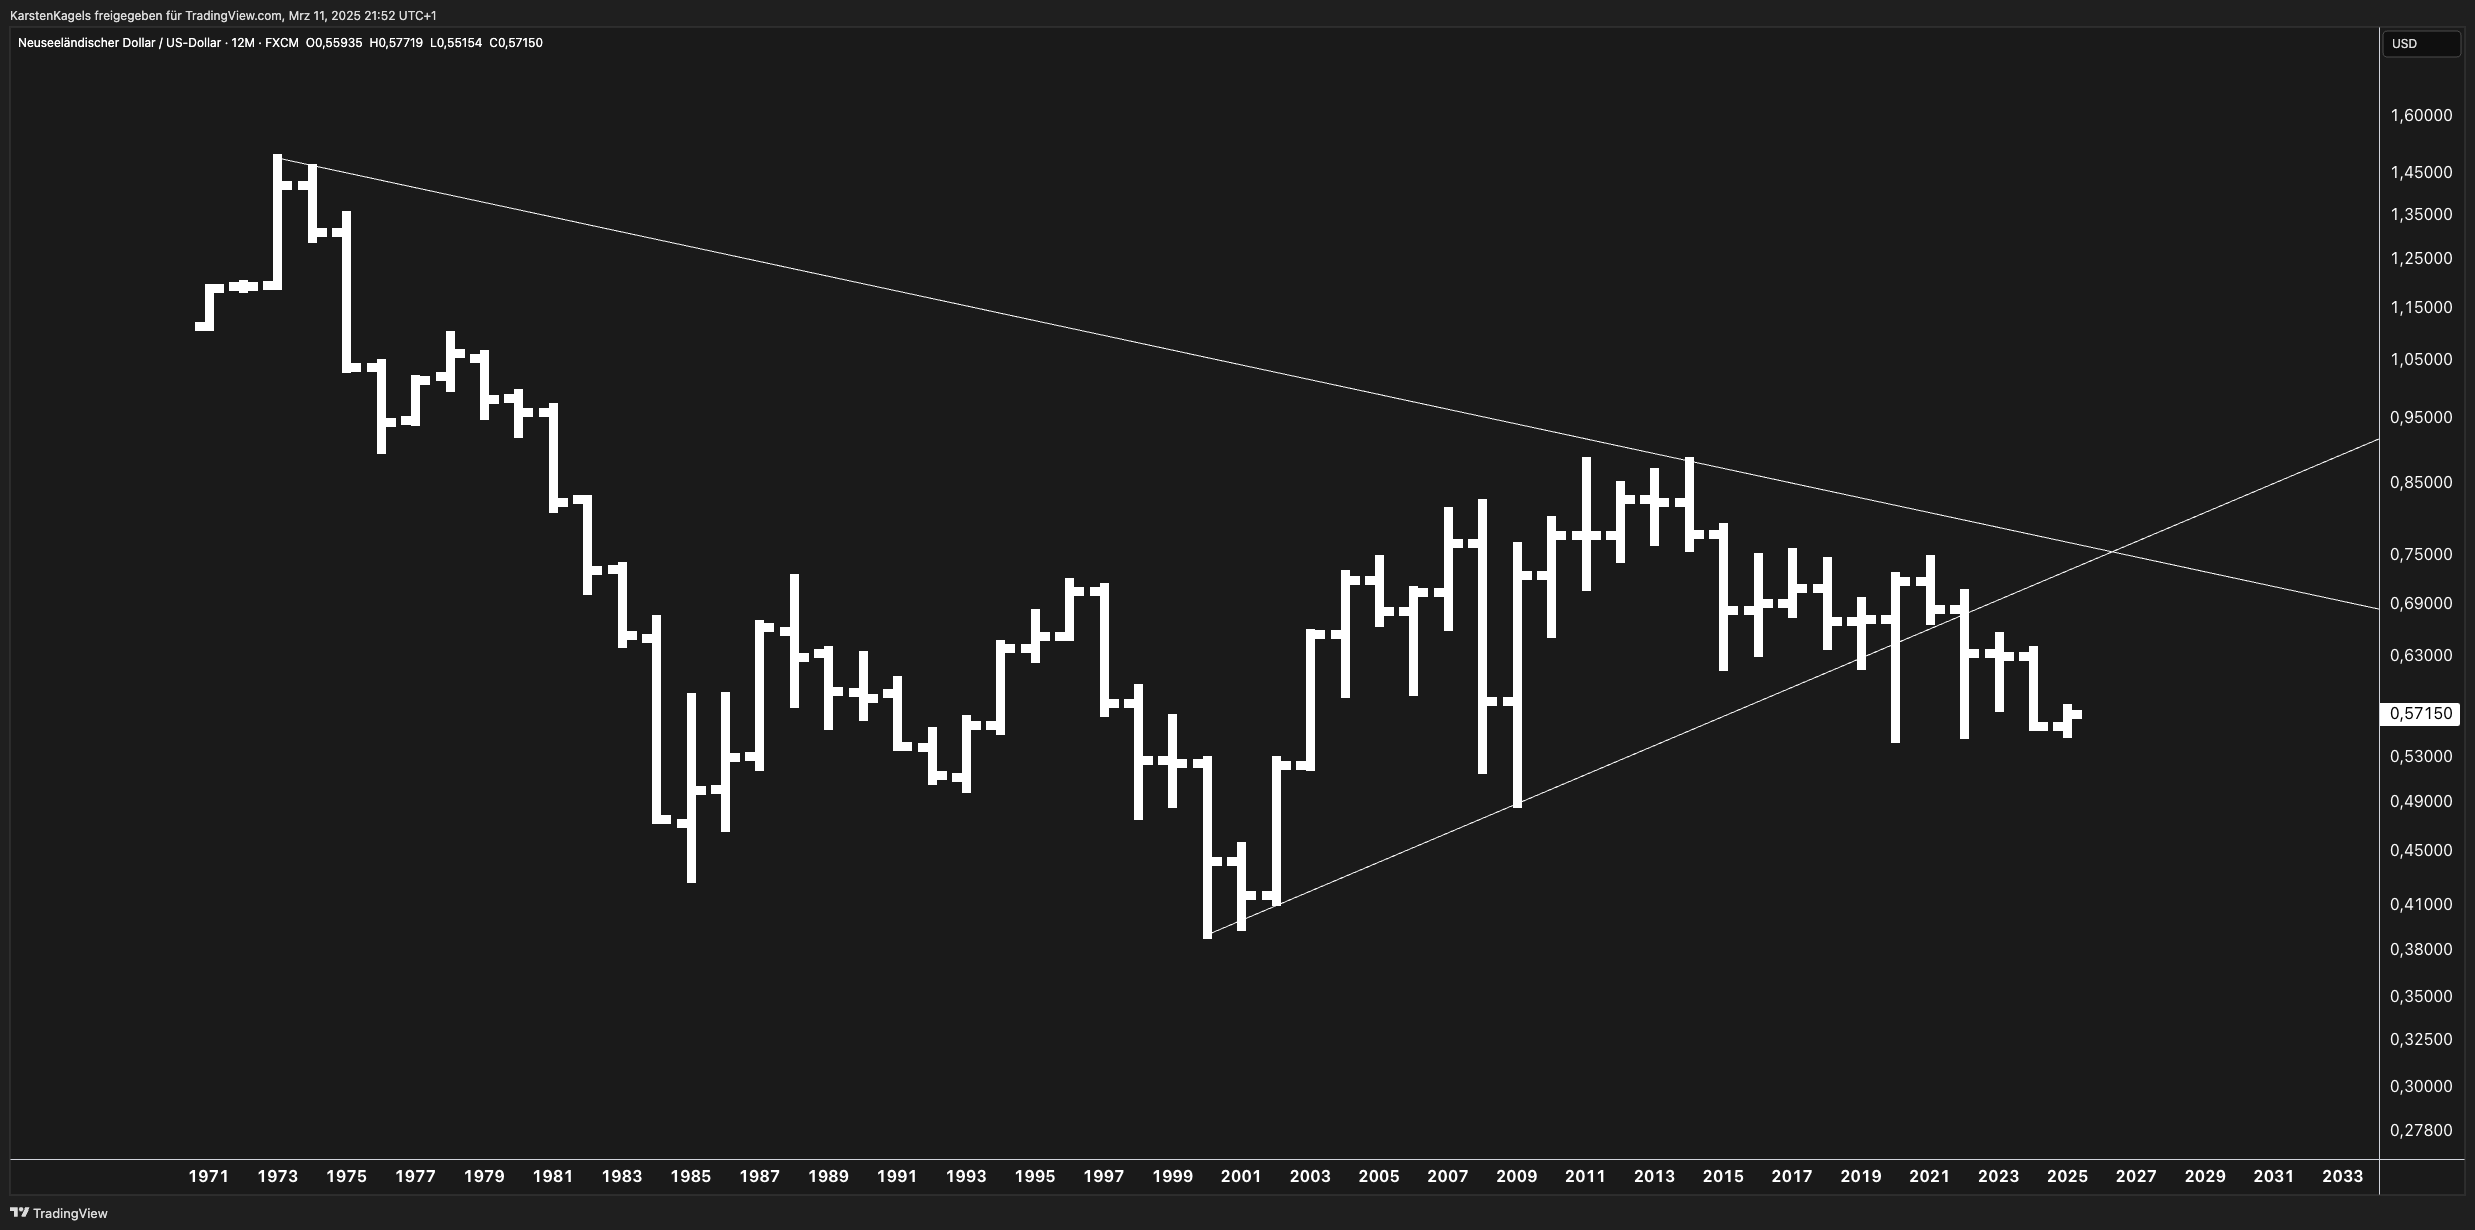
The NZD/USD (Kiwi vs. US Dollar) has seen multiple cycles since the early 1970s. Historically:
- 1970s: The pair traded at higher levels (above 0.80) before a long downtrend commenced.
- 1980s–1990s: NZD/USD declined sharply, reflecting economic challenges and a strong U.S. Dollar environment.
- 2000s: A significant bottom formed in the early 2000s, followed by a multiyear recovery.
- Recent Decade: The Kiwi has traded within a broad range, with noticeable peaks around 0.88 (2014) and troughs near 0.55 (2020, 2023).
Key takeaway: NZD/USD historically responds to commodity cycles, interest rate differentials, and global risk sentiment. On the long-term chart, it appears to be consolidating within a large wedge formation, suggesting a potential for a notable breakout over the coming years.
2. Key Macroeconomic Factors Influencing NZD/USD
- Reserve Bank of New Zealand (RBNZ) Monetary Policy
- The RBNZ’s decisions on interest rates and quantitative easing can heavily impact the Kiwi’s strength.
- High rates attract carry traders, potentially boosting NZD, while rate cuts can weaken it.
- Federal Reserve Policy
- The U.S. Federal Reserve’s stance on inflation, rate hikes, and balance sheet normalization influences USD strength or weakness.
- A hawkish Fed often pressures NZD/USD downward.
- New Zealand’s Commodity Exports
- New Zealand is a major exporter of dairy and agricultural products; global commodity price changes can move NZD/USD.
- A commodities boom typically supports the Kiwi against the U.S. Dollar.
- Global Risk Sentiment
- NZD is considered a “risk currency.” During times of global economic optimism, investors often favor NZD for higher returns.
- During risk-off periods, the USD can strengthen as a safe haven, pulling NZD/USD lower.
- China’s Economic Growth
- New Zealand’s economy is closely tied to Asia-Pacific trade. Slowdowns or accelerations in China’s economy can ripple into NZD/USD movements.
3. Technical Indicators: Chart Patterns and Moving Averages
- Chart Patterns
- Descending Trendline (1970s to recent highs) and Ascending Trendline (2000s lows to recent higher lows) converge, forming a long-term wedge.
- This pattern often precedes a sharp directional move once the pair breaks out.
- Fibonacci Retracements
- A common retracement cluster for NZD/USD sits around 0.50–0.55 (long-term 61.8% retracement).
- Another critical zone near 0.65–0.67 could act as strong resistance if the pair rallies.
- Moving Averages
- 200-Month Moving Average: Currently near the mid-0.60 range; crossing above or below this level often signals a significant momentum shift.
- 50-Month Moving Average: Useful for identifying shorter-term uptrends or downtrends.
- Momentum Indicators
- Watch for RSI or MACD divergences to confirm potential reversal points or continuations of the trend.
4. Short-Term Forecast (Next 3–6 Months)
- Range Expectation: 0.55–0.60
- Catalysts:
- Potential rate moves by RBNZ and the Fed.
- Ongoing inflation data.
- Commodity price fluctuations.
- Strategy:
- Short-term traders might look for oversold RSI bounces or retests of the 50-day moving average.
- Keep an eye on immediate support near 0.55 and resistance near 0.60.
5. Medium-Term Forecast (6–12 Months)
- Possible Upside Breakout: If global risk sentiment improves and the RBNZ remains hawkish, NZD/USD could push towards 0.65.
- Risk Factors:
- Aggressive Fed policies could limit upside momentum.
- Geopolitical tensions or global recession fears might spark risk-off behavior.
- Actionable Insights:
- Swing traders could accumulate positions on dips near 0.56–0.57, targeting 0.63–0.65.
- Hedging strategies may be prudent if volatility remains elevated.
6. Long-Term Forecast (1–5 Years and Beyond)
- Wedge Resolution: The converging long-term trendlines suggest a major move could unfold.
- Bullish Scenario:
- Sustained commodity demand, stable global growth, and dovish Fed policy could lift NZD/USD towards 0.70 or higher over a multi-year horizon.
- Bearish Scenario:
- A protracted risk-off environment or severe global downturn might push NZD/USD below 0.50.
- Investment Outlook:
- Institutional investors might focus on interest rate differentials and macro conditions.
- Retail investors with a multi-year horizon might consider accumulating on significant dips if they see a bullish commodity cycle ahead.
7. Comparative Analysis: Indices, Precious Metals, and Commodities
- NZD/USD vs. DXY (US Dollar Index)
- Inverse correlation: A rising DXY often spells lower NZD/USD levels.
- NZD/USD vs. S&P 500
- Risk correlation: NZD tends to rise with equities during bullish stock market phases.
- NZD/USD vs. Gold
- Gold is seen as a safe-haven asset; when gold rallies in risk-off environments, NZD/USD can weaken. However, during risk-on phases, both gold and NZD can trend higher if USD weakens.
- NZD/USD vs. Dairy Prices
- Dairy is a backbone of New Zealand’s exports. Tracking global dairy auction prices provides additional clues for NZD strength.
8. NZD/USD Trading Tips for Beginners
- Understand Volatility
- The Kiwi can experience sharp moves around RBNZ statements or major U.S. economic releases.
- Use Simple Indicators
- Start with support and resistance, moving averages, and trendlines before adding more complex tools.
- Risk Management
- Always use stop-loss orders and manage position sizes to mitigate risk.
- Forex markets can be highly leveraged; never risk more than you can afford to lose.
- Stay Informed
- Follow central bank announcements, global economic calendars, and commodity price updates.
- Keep an eye on broader market sentiment via stock indices and commodity trends.
9. Conclusion
The NZD/USD price forecast hinges on a confluence of technical indicators (long-term wedge pattern, moving averages, and key Fibonacci levels) and macroeconomic drivers (central bank policies, commodity exports, and global risk sentiment). In the short term (3–6 months), the pair may remain range-bound between 0.55–0.60, while in the medium term (6–12 months), a break towards 0.65 is possible if risk appetite remains healthy. Over the long term (1–5+ years), a decisive wedge breakout could either propel NZD/USD towards 0.70 or see it slip below 0.50, depending on the global economic climate and monetary policy shifts.
Whether you are a seasoned institution or a retail beginner, keeping a balanced view of technical analysis, fundamentals, and risk management will be crucial for trading success in this dynamic currency pair.
- Gold (XAU/USD) Forecast April 2025: Price Targets & Expert Assessment - April 5, 2025
- ETH/USD Forecast April 2025: Price Targets & Expert Assessment - March 29, 2025
- BTC/USD Forecast April 2025: Price Targets & Technical Analysis After New ATH - March 29, 2025