Date: November 8, 2025
Current Level: ~99.89
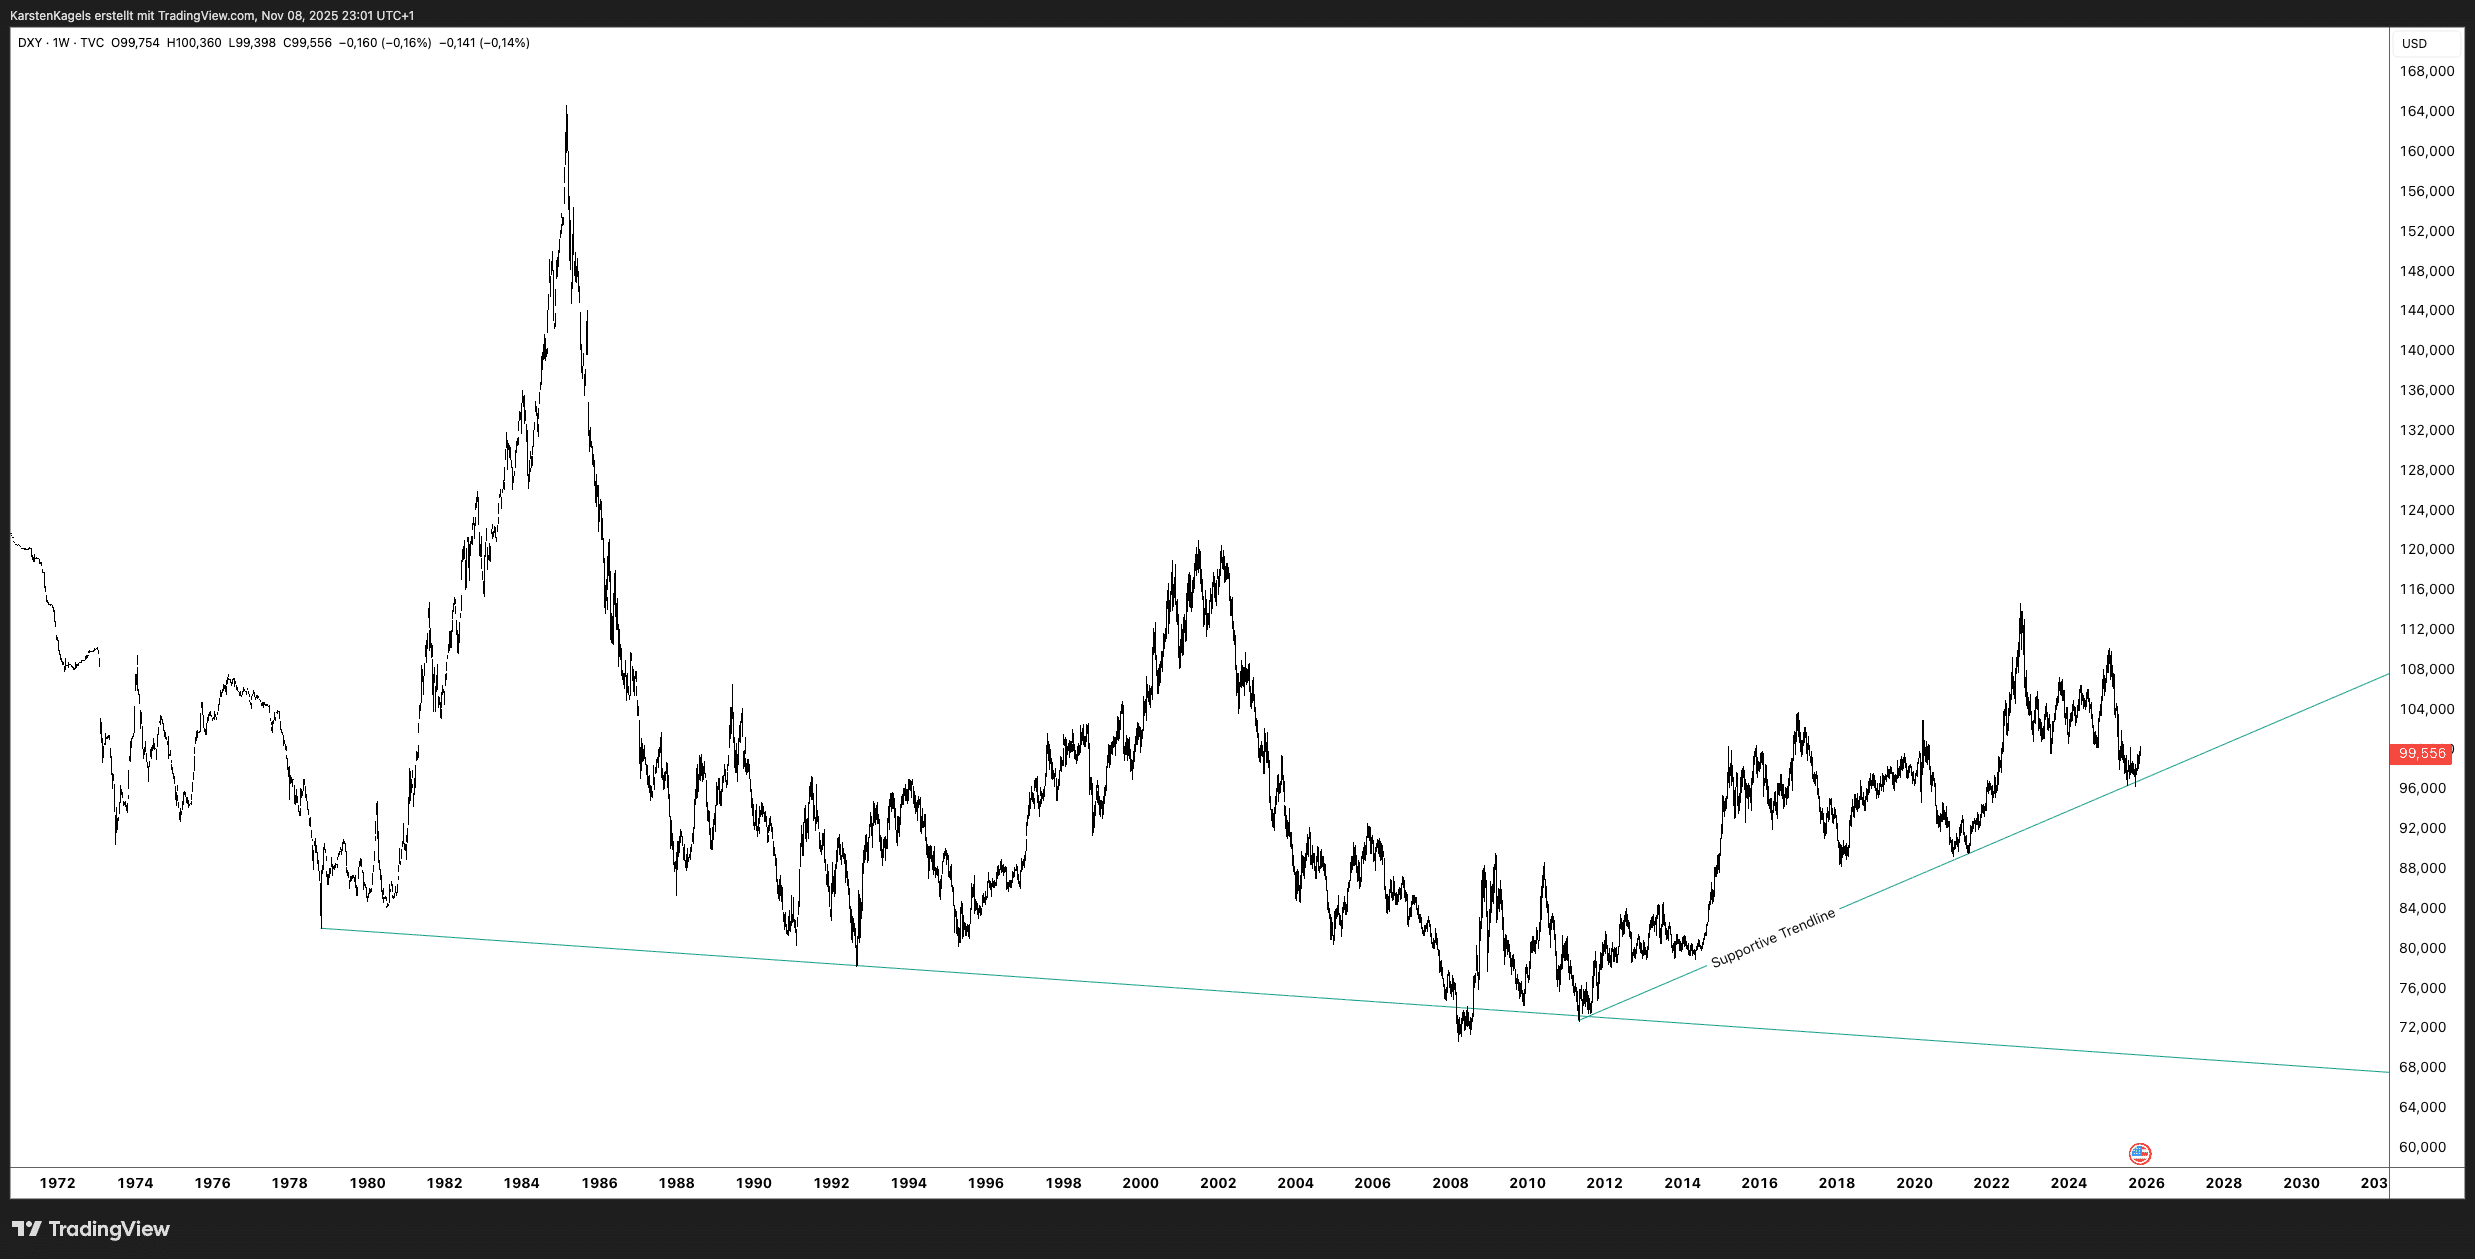
Critical Support Test: Trendline Holds!
The DXY is well above the key ascending trendline from 2012 (connecting 72 in 2012 and 89 in 2020). This support line currently sits at approximately 96.50 – and with price at 99.89, there’s still a comfortable buffer of over 3 points above this critical support.
Technical Picture: Bullish
Why the Bulls Are in Control:
- 2012 uptrend trendline (~96.50) still intact
- Price 3+ points above support = healthy distance
- 13-year trendline proven reliable
Key Levels:
- Critical Support: 96.50 (2012 trendline – THE KEY LEVEL)
- Immediate Support: 99.00 (psychological)
- Resistance: 102, 105, 108, 112-115
Price Forecast
Short-Term (1-3 Months) – 70% Bullish
- Support at 96.50 provides strong floor
- Target 1: 103-105
- Target 2: 108-110
- Timeline: Rally into Q1 2026
Medium-Term (6-12 Months) – 65% Bullish
- Target: 112-115 (retest 2022 highs)
- Extension: 118-120
- Timeline: By Q3-Q4 2026
Long-Term (2027-2030) – 60% Bullish
- Triangle breakout above 120
- Target: 130-140+
- Bull market continuation
Bear Case (30-35%)
- Only if weekly close below 96.50
- Then test 92-93
- Further targets: 88-90
Bottom Line
At 99.89, the DXY maintains a healthy 3+ point cushion above the critical 2012 trendline at 96.50. As long as this support holds, the bullish structure remains intact with targets at 105-115+. Only a weekly close below 96.50 would invalidate this setup. Risk/reward favors bullish positioning.
Not financial advice. Trade at your own risk.
- Gold (XAU/USD) Forecast April 2025: Price Targets & Expert Assessment - April 5, 2025
- ETH/USD Forecast April 2025: Price Targets & Expert Assessment - March 29, 2025
- BTC/USD Forecast April 2025: Price Targets & Technical Analysis After New ATH - March 29, 2025