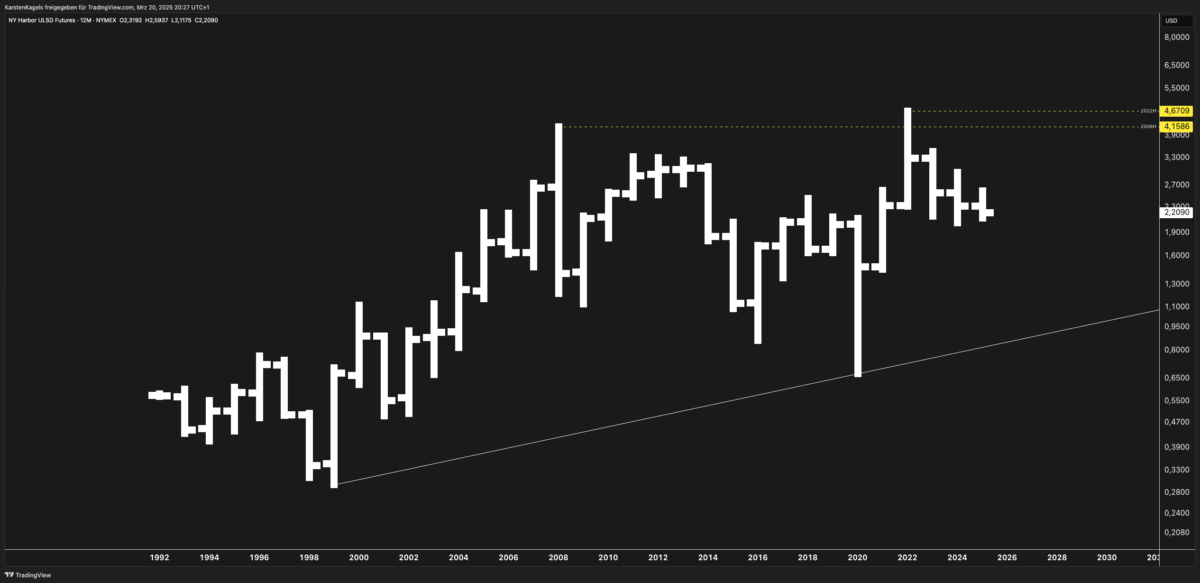
Looking at the long-term yearly chart for NY Harbor ULSD Futures (’12M’ NYMEX: HO), we can observe several significant price patterns and levels that will influence future price movement. This analysis will provide a comprehensive outlook based on both technical factors and fundamental drivers.

Technical Analysis
Major Price Levels and Patterns
The chart reveals a multi-decade price history with significant volatility. Key observations include:
- Current price level: Around 2.20-2.30 USD per gallon
- Major resistance zones:
- 3.30-3.40 (2022 high)
- 4.15-4.30 (2022 multi-year peak)
- Key support levels:
- 2.00 (psychological level)
- 1.60-1.70 (previous consolidation zone)
- 0.85-1.00 (long-term rising trendline)
The market has formed a long-term rising channel since the 1998-2000 lows, with prices generally respecting this upward trajectory despite periodic deep corrections.
Long-Term Trend Analysis
The market has experienced several major cycles:
- 1990s: Relatively low-volatility trading range
- 2000-2008: Strong bull market reaching peaks near 4.00
- 2008-2020: Volatile correction and consolidation
- 2020-2022: Sharp recovery from pandemic lows to multi-year highs
- 2022-Present: Correction and consolidation from recent peaks
The overall structure suggests a secular bull market with higher lows over multiple decades, though with significant retracements.
Price Forecast Scenarios
Bullish Case (40% probability)
If heating oil prices break above the 2.50-2.70 resistance zone, we could see a test of the 3.30-3.40 resistance level within 12-18 months. Should global supply constraints intensify or geopolitical tensions escalate, prices could challenge the 2022 highs around 4.15-4.30 over a 2-3 year timeframe.
Neutral Case (35% probability)
The most likely scenario suggests continued consolidation between 1.80 and 2.70 for the next 12-24 months. This pattern would respect the long-term uptrend while allowing the market to digest recent volatility and establish a firmer base for the next major move.
Bearish Case (25% probability)
A breakdown below 1.80 support could trigger a deeper correction toward the 1.30-1.50 range, particularly if economic recession materializes or renewable energy adoption accelerates faster than expected. However, the long-term rising trendline suggests strong support would likely emerge around these levels.
Fundamental Drivers
Supply and Demand Dynamics
- Refinery capacity constraints remain a key factor, with limited investment in new refining infrastructure putting pressure on distillate supplies
- Seasonal demand patterns continue to influence prices, with winter heating demand in the Northern Hemisphere creating cyclical price pressure
- Commercial inventory levels in major consuming regions (particularly the US Northeast and Europe) remain below historical averages
Macroeconomic and Geopolitical Factors
- Energy transition policies are creating uncertainty around long-term demand outlook
- OPEC+ production decisions continue to influence the broader petroleum complex, including heating oil
- Geopolitical tensions in major oil-producing regions present ongoing supply risk
- USD strength or weakness has historically shown inverse correlation with heating oil prices
Comparative Market Analysis
Heating oil maintains strong correlation with:
- Crude oil futures (WTI and Brent) with typical spread relationships
- RBOB gasoline futures though with distinct seasonal patterns
- Natural gas prices with substitution effects during extreme price movements
The current heating oil-to-crude spread remains somewhat elevated compared to historical averages, suggesting potential for compression if crude prices strengthen or heating oil demand softens.
Investor Positioning
Recent Commitment of Traders (COT) reports indicate:
- Commercial hedgers (primarily refiners and distributors) maintain moderate net-short positions
- Managed money (hedge funds and large speculators) have reduced exposure following the 2022 price spike
- Open interest levels suggest adequate market liquidity for most trading strategies
Key Considerations for Traders
- Monitor seasonal factors closely, particularly inventory builds during shoulder seasons
- Watch refinery utilization rates for early signs of supply constraints
- Track the heating oil/crude oil spread for potential trading opportunities
- Consider geopolitical risk premium in pricing, particularly during periods of Middle East tension
Conclusion
The long-term heating oil futures chart suggests a market that remains in a secular uptrend but is currently in a consolidation phase following the extreme volatility of 2020-2022. While further correction remains possible, the fundamental structure of the market and historical price patterns suggest limited downside over a multi-year timeframe.
Traders should maintain a balanced approach, watching for key technical levels to guide entry and exit decisions while remaining alert to the fundamental drivers that could accelerate moves in either direction.
FAQ Section
What are Heating Oil Futures and why are they important?
Heating Oil Futures (NYMEX: HO) are standardized contracts for the delivery of heating oil at a future date. They’re critical for energy market participants to hedge against price volatility and are widely used by refiners, distributors, and large consumers. They also serve as a key benchmark for the broader distillate market, including diesel fuel.
How do seasonal factors affect Heating Oil prices?
Heating Oil typically experiences price increases during fall and early winter as demand for home heating rises in the Northern Hemisphere. Prices often peak between December and February, then decline into spring. Weather forecasts and inventory reports become particularly significant during these seasonal transition periods.
What’s the relationship between Heating Oil and Crude Oil prices?
Heating Oil is refined from crude oil, so there’s a strong positive correlation between their prices. However, the “crack spread” (difference between crude oil and refined product prices) can vary significantly based on refinery capacity, seasonal demand, and inventory levels. When analyzing Heating Oil, always consider the crude oil market’s direction and the current crack spread.
How might the energy transition affect Heating Oil markets long-term?
The global push toward electrification and renewable energy creates uncertainty for petroleum-based heating. Policies encouraging heat pump adoption and building electrification could gradually reduce demand in developed markets. However, this transition will likely be measured over decades rather than years, with developing economies potentially offsetting some demand loss.
What economic indicators should I monitor when trading Heating Oil?
Key indicators include weekly EIA inventory reports, refinery utilization rates, GDP growth forecasts, manufacturing indices (particularly in heating-intensive regions), housing starts, and consumer sentiment surveys. Weather forecasts become critically important during winter months.