Introduction
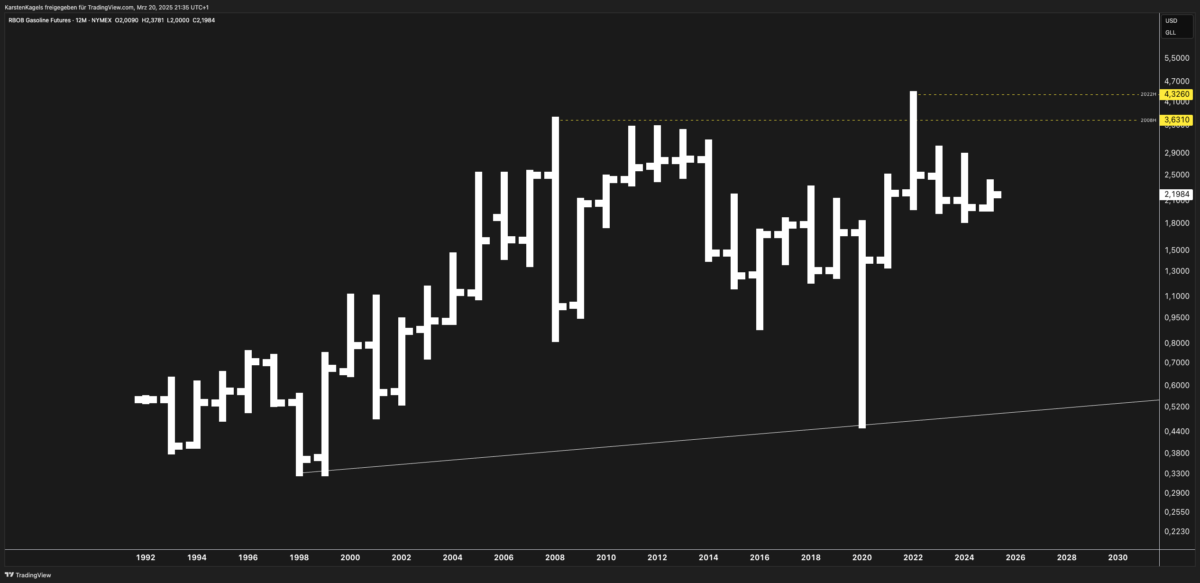
The RBOB Gasoline Futures chart (NYMEX) shows a remarkable price journey spanning from 1992 to the present, with projections extending to 2030. This analysis will examine key technical patterns, fundamental drivers, and potential future scenarios for gasoline futures based on the historical data presented in the chart.

Technical Analysis
Long-Term Price Structure
The gasoline futures market has demonstrated significant volatility and several distinct phases over the past three decades:
- 1992-2000: Relatively range-bound trading between approximately $0.30-$0.70 per gallon
- 2000-2008: Strong uptrend reaching the first major peak near $3.63
- 2008-2020: Extended consolidation period with significant volatility
- 2020-2022: Post-COVID recovery and surge to all-time highs above $4.32
- 2022-Present: Retracement and consolidation between $2.00-$2.50
Major Support & Resistance Levels
- Key Resistance: $4.32 (2022 high), $3.63 (2008 high)
- Key Support: $2.00 psychological level, $0.50 (2020 COVID low)
- Current Trading Range: Approximately $2.00-$2.50
Trend Analysis
The long-term chart reveals a clear secular uptrend since 1992, despite significant corrections. The upward sloping trendline connecting the 1998, 2020, and subsequent lows remains intact, suggesting underlying strength even during bearish phases.
Potential Price Scenarios
- Bullish Case: Break above $2.50 could target resistance at $3.00, with further strength potentially challenging the 2008 high of $3.63
- Neutral Case: Continued consolidation between $2.00-$2.50, respecting the range established since late 2022
- Bearish Case: Break below $2.00 could trigger a decline toward $1.50, especially if accompanied by economic recession or demand destruction
Fundamental Analysis
Supply Factors
- Refinery Capacity: Limited new refining capacity in developed markets creates potential supply constraints during peak demand periods
- Production Dynamics: U.S. refineries operating at high utilization rates, particularly during summer driving season
- Crude Oil Relationship: Gasoline prices maintain strong correlation with WTI and Brent crude benchmarks
Demand Factors
- Seasonal Patterns: Strong cyclical demand with peaks during summer driving season (May-September)
- Transportation Trends: Gradual EV adoption providing long-term headwinds, though internal combustion engines remain dominant
- Global Recovery: Post-pandemic travel recovery largely complete, with demand returning to pre-COVID levels
Regulatory Environment
- Emissions Standards: Increasingly stringent fuel specifications impact production costs and regional pricing
- Biofuel Mandates: Ethanol blending requirements and renewable fuel standards affecting gasoline composition and pricing
- Energy Transition Policies: Government initiatives promoting EV adoption represent gradual long-term demand risk
Comparative Market Analysis
Relationship to Crude Oil
Gasoline typically trades at a premium to crude oil, with the crack spread widening during high-demand periods. The chart pattern shows strong correlation with crude oil price movements, particularly during major trends.
Other Refined Products
When compared to heating oil and jet fuel futures, gasoline demonstrates greater seasonal volatility, typically outperforming during summer months and underperforming during winter.
Crack Spread Implications
The 3:2:1 crack spread (three barrels of crude oil yielding two barrels of gasoline and one barrel of distillate) offers insight into refining profitability and potential gasoline price movements.
Market Sentiment & Positioning
Based on the chart pattern and current market dynamics:
- Institutional Positioning: Commercial hedgers likely maintaining significant short positions to hedge physical production
- Seasonal Expectations: Market anticipating typical seasonal patterns despite energy transition uncertainty
- Price Action Signals: The multi-year consolidation suggests a market seeking equilibrium between evolving supply-demand dynamics
Forecast Scenarios (2025-2030)
Bullish Scenario
If economic growth remains robust and refining constraints persist, prices could retest the $3.00-$3.50 range, particularly during supply disruptions or geopolitical tensions affecting crude oil.
Base Case Scenario
Continued range-bound trading between $2.00-$3.00, with seasonal fluctuations and gradual upward bias following inflation and production costs.
Bearish Scenario
Economic recession combined with accelerated EV adoption could pressure prices below $2.00, potentially testing long-term support near $1.50.
Beginner’s Guide to Gasoline Futures
Gasoline futures (RBOB – Reformulated Blendstock for Oxygenate Blending) represent wholesale gasoline prices traded on the NYMEX exchange. Each contract represents 42,000 gallons (1,000 barrels) of gasoline.
These futures are important for:
- Refiners hedging production
- Distributors managing price risk
- Investors seeking exposure to energy markets
- Traders capitalizing on seasonal patterns
Conclusion
The gasoline futures market has demonstrated resilience through multiple economic cycles. While the long-term chart shows a clear upward bias since 1992, the energy transition creates uncertainty for extended forecasts. The current consolidation phase likely represents a market balancing traditional demand patterns against evolving energy trends.
Traders should monitor key technical levels while remaining attentive to fundamental shifts in transportation habits, refining capacity, and regulatory policies that could trigger the next major price trend.
FAQs
Q: What factors most influence gasoline futures prices?
A: Crude oil prices, refinery operations, seasonal demand patterns, inventory levels, and regulatory requirements all significantly impact gasoline futures.
Q: How do gasoline futures relate to pump prices?
A: Gasoline futures represent wholesale prices that typically lead retail pump prices by 1-2 weeks, making them a useful indicator for consumer fuel costs.
Q: What seasonal patterns affect gasoline trading?
A: Prices typically rise during spring, peak in summer driving season (May-September), and decline in fall and winter as demand decreases.