Introduction
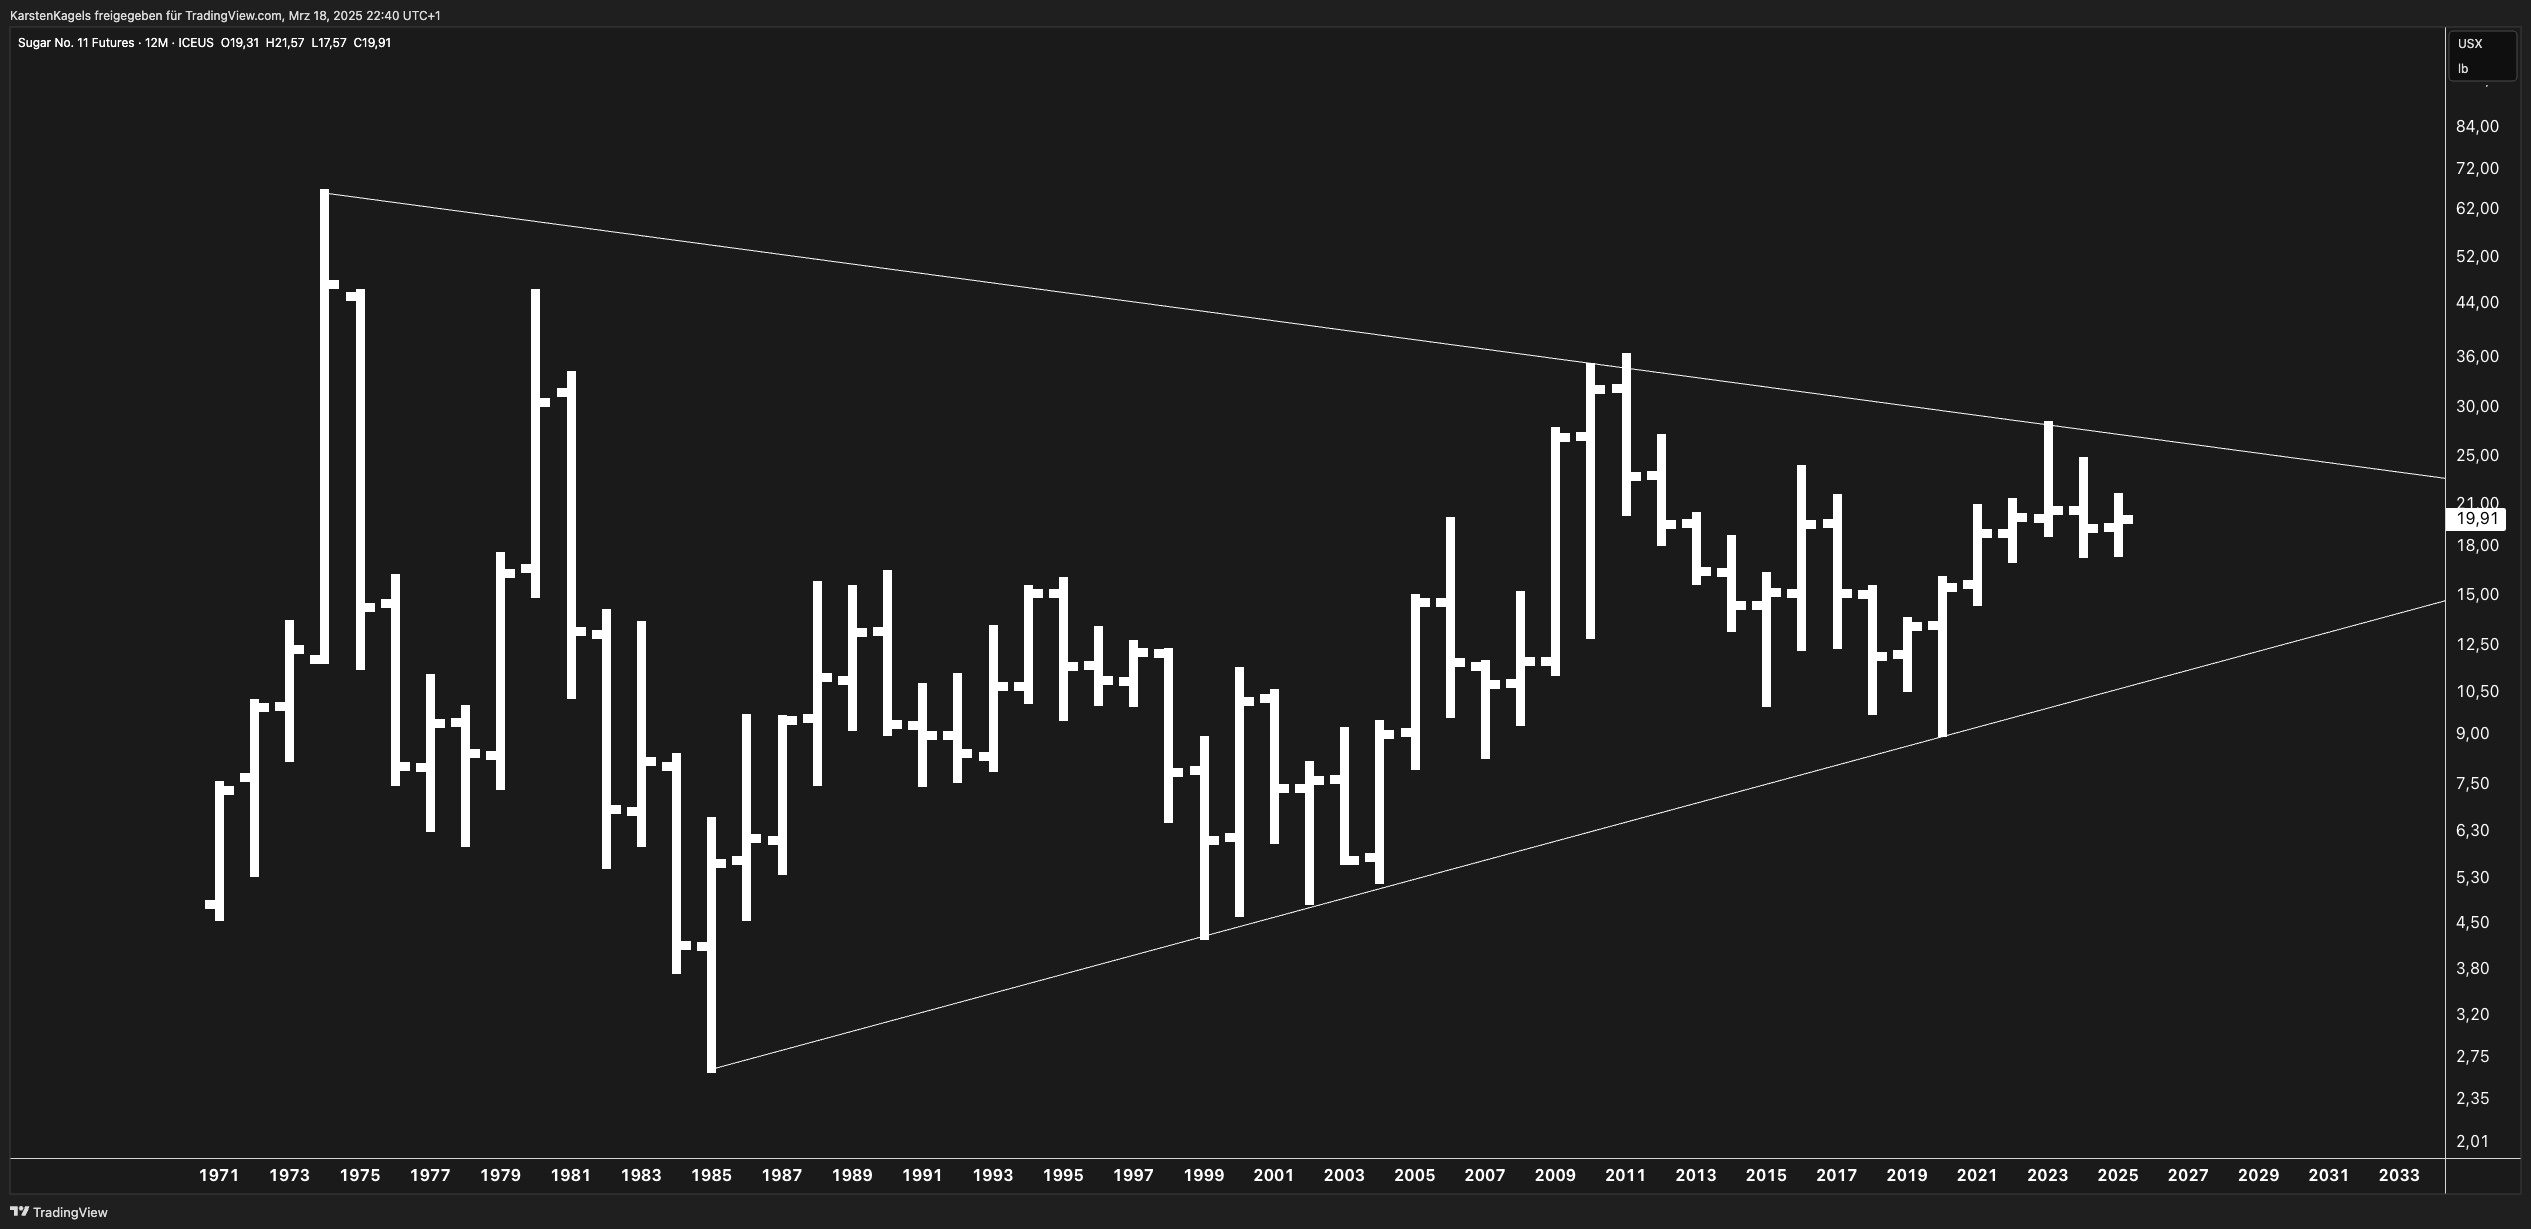
The chart shows a long-term view of Sugar No. 11 Futures spanning from approximately 1971 to projections reaching 2033. This analysis will provide a comprehensive multi-scenario forecast based on technical patterns, fundamental factors, and comparative market dynamics.
Technical Analysis
Major Support & Resistance Levels
The chart displays a clear symmetrical triangle formation that has developed over several decades. This pattern is defined by:
- Upper resistance trendline: Connecting major highs from the 1970s, declining from approximately 84 cents/lb to the 20-25 cents/lb range
- Lower support trendline: Connecting major lows, rising from about 2-3 cents/lb to the 10-15 cents/lb range
Current price action (as of March 2025) shows sugar trading within the 18-20 cents/lb zone, in the final third of this multi-decade triangle pattern.
Pattern Interpretation
The symmetrical triangle suggests a period of consolidation within a massive range. Historically, such patterns typically resolve with a significant breakout in either direction. As the pattern approaches its apex (projected around 2030-2033), we should expect increased volatility and a potential decisive move.
Price Scenarios
- Bullish Scenario: A break above the upper trendline (currently around 22-24 cents/lb) could trigger a major rally, potentially targeting previous highs in the 30-40 cents/lb range. This would represent a multi-decade breakout and could lead to a new structural bull market.
- Neutral Scenario: Continued consolidation within the triangle for another 2-5 years, with prices oscillating between 15-22 cents/lb as the pattern narrows further.
- Bearish Scenario: A breakdown below the lower support (currently around 15 cents/lb) could signal a return to the 10-12 cents/lb range, testing the multi-decade support levels.
Macroeconomic Factors
Supply and Demand Dynamics
- Production Centers: Brazil, India, Thailand, and China remain the dominant global producers, with weather patterns in these regions critically affecting global supply.
- Ethanol Connection: Brazil’s policies on ethanol production significantly impact sugar prices, as sugarcane can be diverted between sugar and ethanol production.
- Consumption Trends: Global sugar consumption growth has slowed in developed markets due to health concerns, while continuing to rise in developing economies.
External Factors
- Climate Change Impact: Increasing frequency of extreme weather events in major growing regions poses significant risk to production stability.
- USD Correlation: Sugar prices historically show inverse correlation with USD strength, making currency movements an important factor to monitor.
- Energy Prices: Oil price fluctuations affect production costs and ethanol demand, creating an important cross-market dynamic.
Comparative Market Analysis
Sugar vs. Other Agricultural Commodities
Sugar has shown moderate correlation with other soft commodities, particularly coffee and cocoa, but with distinct seasonal patterns and supply-side drivers. Recent sugar market movements have outperformed many agricultural markets due to specific supply constraints in major producing regions.
Hedging Opportunities
- Spread Trading: Sugar/Coffee and Sugar/Cocoa spreads offer potential hedging opportunities for agricultural portfolio managers.
- Food Manufacturing Sector: Companies in the food and beverage sector with exposure to sugar prices can utilize these futures for effective input cost management.
Market Sentiment & Positioning
Institutional vs. Retail Outlook
- Commercial Hedgers: Increasing hedging activity from commercial users suggests expectations of higher future prices.
- Speculative Positioning: Recent COT (Commitment of Traders) reports indicate growing speculative long positions, reflecting bullish sentiment among funds.
Key Liquidity Zones
Major liquidity clusters appear around the 20 cents/lb and 15 cents/lb levels, suggesting these will be important areas of support and resistance in the near term.
For Beginners: Understanding Sugar Futures
Sugar No. 11 is the global benchmark for raw sugar trading, representing the price of raw sugar physically delivered to the port of New York. Each contract represents 112,000 pounds of sugar, making it accessible to institutional investors but still manageable for sophisticated retail traders.
The market is characterized by significant seasonal patterns tied to harvest cycles in major producing regions, particularly Brazil’s harvest season (April-November). These seasonal factors create recurring trading opportunities for well-informed market participants.
Conclusion & Outlook
The sugar market appears to be approaching a critical juncture within its multi-decade consolidation pattern. Technical analysis suggests increasing probability of a significant directional move within the next 2-5 years as the symmetrical triangle pattern reaches its apex.
Short-term traders should focus on potential breakouts from the current range, while long-term investors might consider strategic positions in anticipation of the eventual resolution of this major pattern.
FAQ
Q: What are the key factors that could trigger a breakout in sugar prices? A: Major supply disruptions in Brazil or India, significant shifts in ethanol policies, or extreme weather events affecting multiple growing regions simultaneously.
Q: How does sugar typically perform during global economic downturns? A: Sugar has historically shown some defensive characteristics during economic downturns, though it remains vulnerable to demand destruction if consumer spending significantly contracts.
Q: What timeframes are most relevant for sugar traders? A: Weekly and monthly charts are most useful for identifying the major trends, while daily charts help with entry and exit timing within these larger cycles.
- Gold (XAU/USD) Forecast April 2025: Price Targets & Expert Assessment - April 5, 2025
- ETH/USD Forecast April 2025: Price Targets & Expert Assessment - March 29, 2025
- BTC/USD Forecast April 2025: Price Targets & Technical Analysis After New ATH - March 29, 2025