Introduction
Platinum (Platin) is a highly sought-after precious metal with industrial and investment demand. Traders and investors closely monitor its price trends for strategic decision-making. This analysis of the long-term Platin Futures chart provides a forecast based on technical indicators, trend patterns, and macroeconomic factors. If you are looking for the best Platin price forecast, this in-depth analysis will offer crucial insights.
1. Key Technical Analysis of Platin Futures (Long-Term)
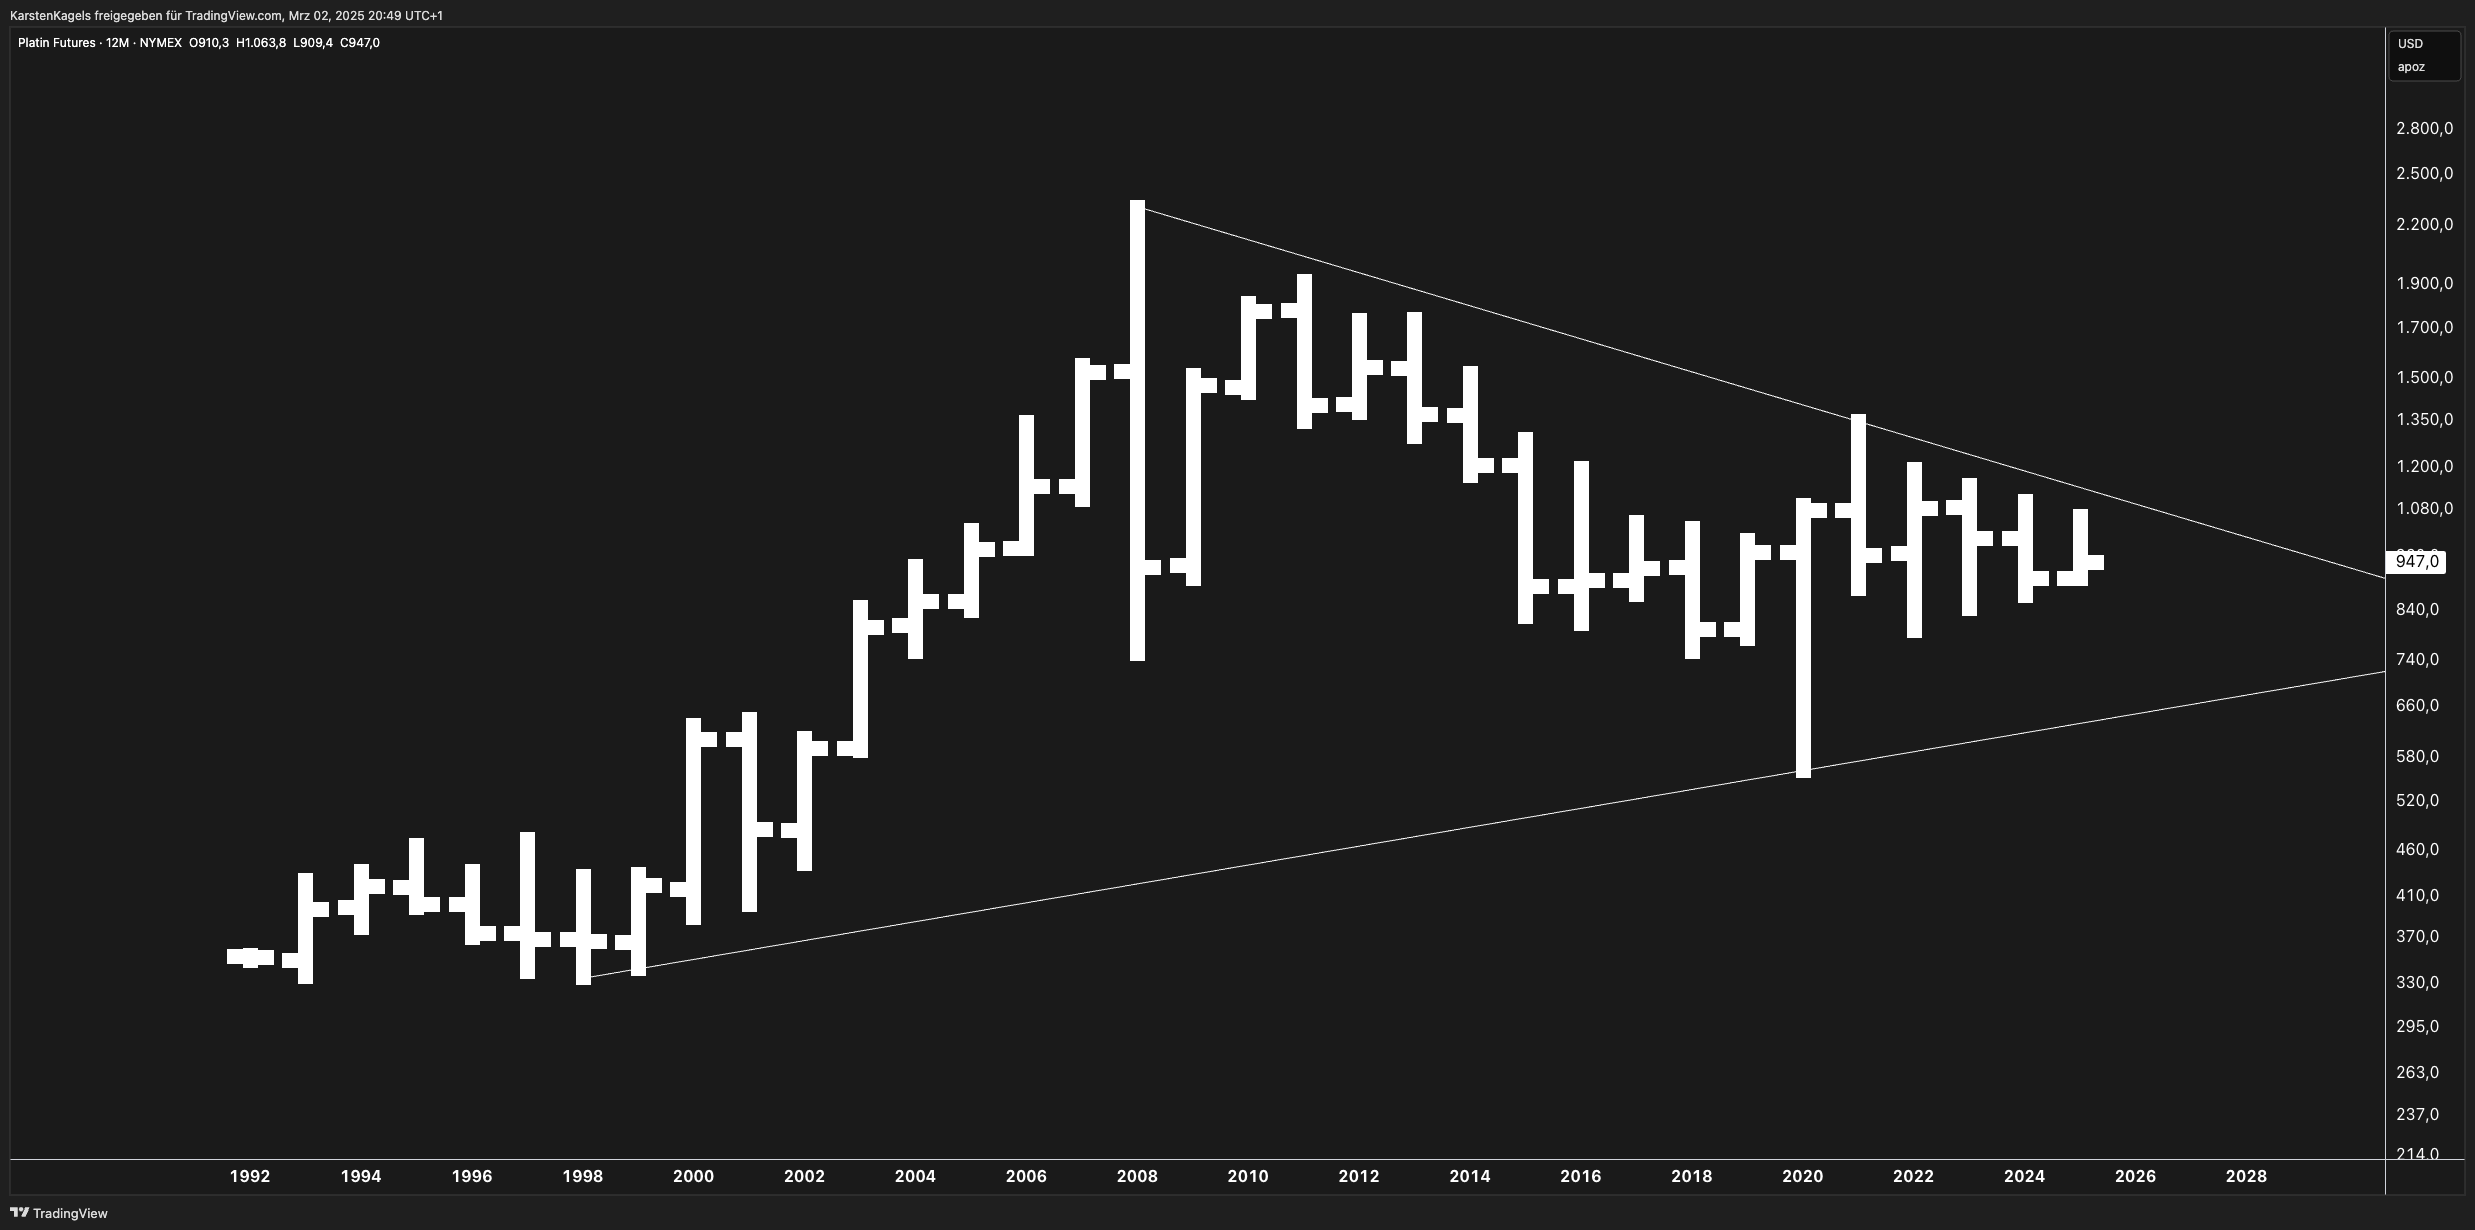
Analyzing the 12-month bar chart of NYMEX Platinum Futures, we observe a long-term symmetrical triangle pattern. This signals potential breakout scenarios, indicating key support and resistance levels.
1.1 Symmetrical Triangle Formation
- Support Zone: The lower trendline acts as strong long-term support, currently around $750-$800.
- Resistance Zone: The upper trendline, which has been a multi-decade resistance level, is near $1,200-$1,300.
- Price Squeeze: The chart shows price consolidation within the narrowing triangle, which suggests a high-probability breakout in the coming years.
1.2 Historical Price Trends
- The last major bull run in Platinum occurred from 1999 to 2008, with prices surging from $350 to $2,200, marking a nearly 530% increase.
- The 2008 financial crisis triggered a sharp crash, followed by a prolonged consolidation phase lasting over a decade.
- Since 2018, Platinum has been forming higher lows, signaling potential bullish momentum.
2. Platin Price Forecast Scenarios
Given the symmetrical triangle formation, two key breakout scenarios are likely:
2.1 Bullish Breakout Scenario (Above $1,200)
If Platin Futures break above the $1,200-$1,300 resistance zone, we could see a strong upward trend with key price targets:
- $1,500 – First major resistance
- $1,750-$1,800 – Multi-year high zone
- $2,200+ – Retest of 2008 all-time highs
🔹 Trigger: A sustained breakout above $1,200, ideally with increasing volume and macroeconomic tailwinds.
2.2 Bearish Breakdown Scenario (Below $800)
If the price fails to hold the $800-$850 support level, the following downside targets come into play:
- $650 – Strong support level from previous price action
- $500 – Psychological support and historical demand zone
- $350 – Long-term floor, aligning with 1999-2003 price levels
🔹 Trigger: A sharp breakdown below $800, driven by declining industrial demand or economic downturns.
3. Key Technical Indicators & Confirmation Signals
To validate the forecast, let’s analyze supporting technical indicators:
3.1 Moving Averages (MA)
- 200-month MA currently acts as dynamic support near $850.
- A golden cross (50-month MA crossing above 200-month MA) would signal long-term bullish strength.
3.2 Fibonacci Retracements
- The 38.2% retracement of the 2008 high aligns near $1,250, making it a crucial resistance zone.
- The 61.8% retracement at $1,600 could be the next major target in a bullish rally.
3.3 RSI & Momentum Analysis
- Relative Strength Index (RSI) on the long-term chart hovers around 50, indicating a neutral stance.
- A breakout above 60 RSI would confirm bullish momentum, while a dip below 40 signals bearish weakness.
4. Macroeconomic & Fundamental Factors Impacting Platin Prices
Beyond technical patterns, Platinum’s price is heavily influenced by macroeconomic and fundamental trends.
4.1 Demand from Automotive & Green Energy Sectors
- Catalytic converters in the automotive industry remain a key demand driver.
- Increasing focus on hydrogen fuel cells (where Platinum is essential) could boost long-term prices.
4.2 Inflation & USD Strength
- A weaker US Dollar (USD) historically correlates with higher Platinum prices.
- If inflation remains persistent, precious metals like Platinum could attract strong investment demand.
4.3 Supply Chain & Mining Challenges
- South Africa & Russia dominate global Platinum mining, and any supply disruption could lead to price spikes.
- Environmental regulations affecting mining operations might tighten supply in the coming years.
5. Conclusion: What’s Next for Platin Prices?
Short-Term (2025-2026)
- Bullish case: If prices breach $1,200, expect a run toward $1,500+.
- Bearish case: A breakdown below $850 could send prices toward $650-$700.
Long-Term (2027-2030)
- If Platinum demand from green energy & industrial sectors rises, $2,000+ is achievable.
- However, economic slowdowns or tech advancements in substitutes could pressure prices.
Trading Strategy for Investors & Traders
- Swing traders: Monitor $1,000-$1,200 for breakout opportunities.
- Long-term investors: Buy near support levels ($800-$900) and hold for potential upside.
📌 Final Thought: Platinum is at a critical inflection point. A breakout or breakdown from the symmetrical triangle will set the tone for the next multi-year trend. Keep an eye on macroeconomic trends and key technical indicators.