Table of Contents
Anzeigen
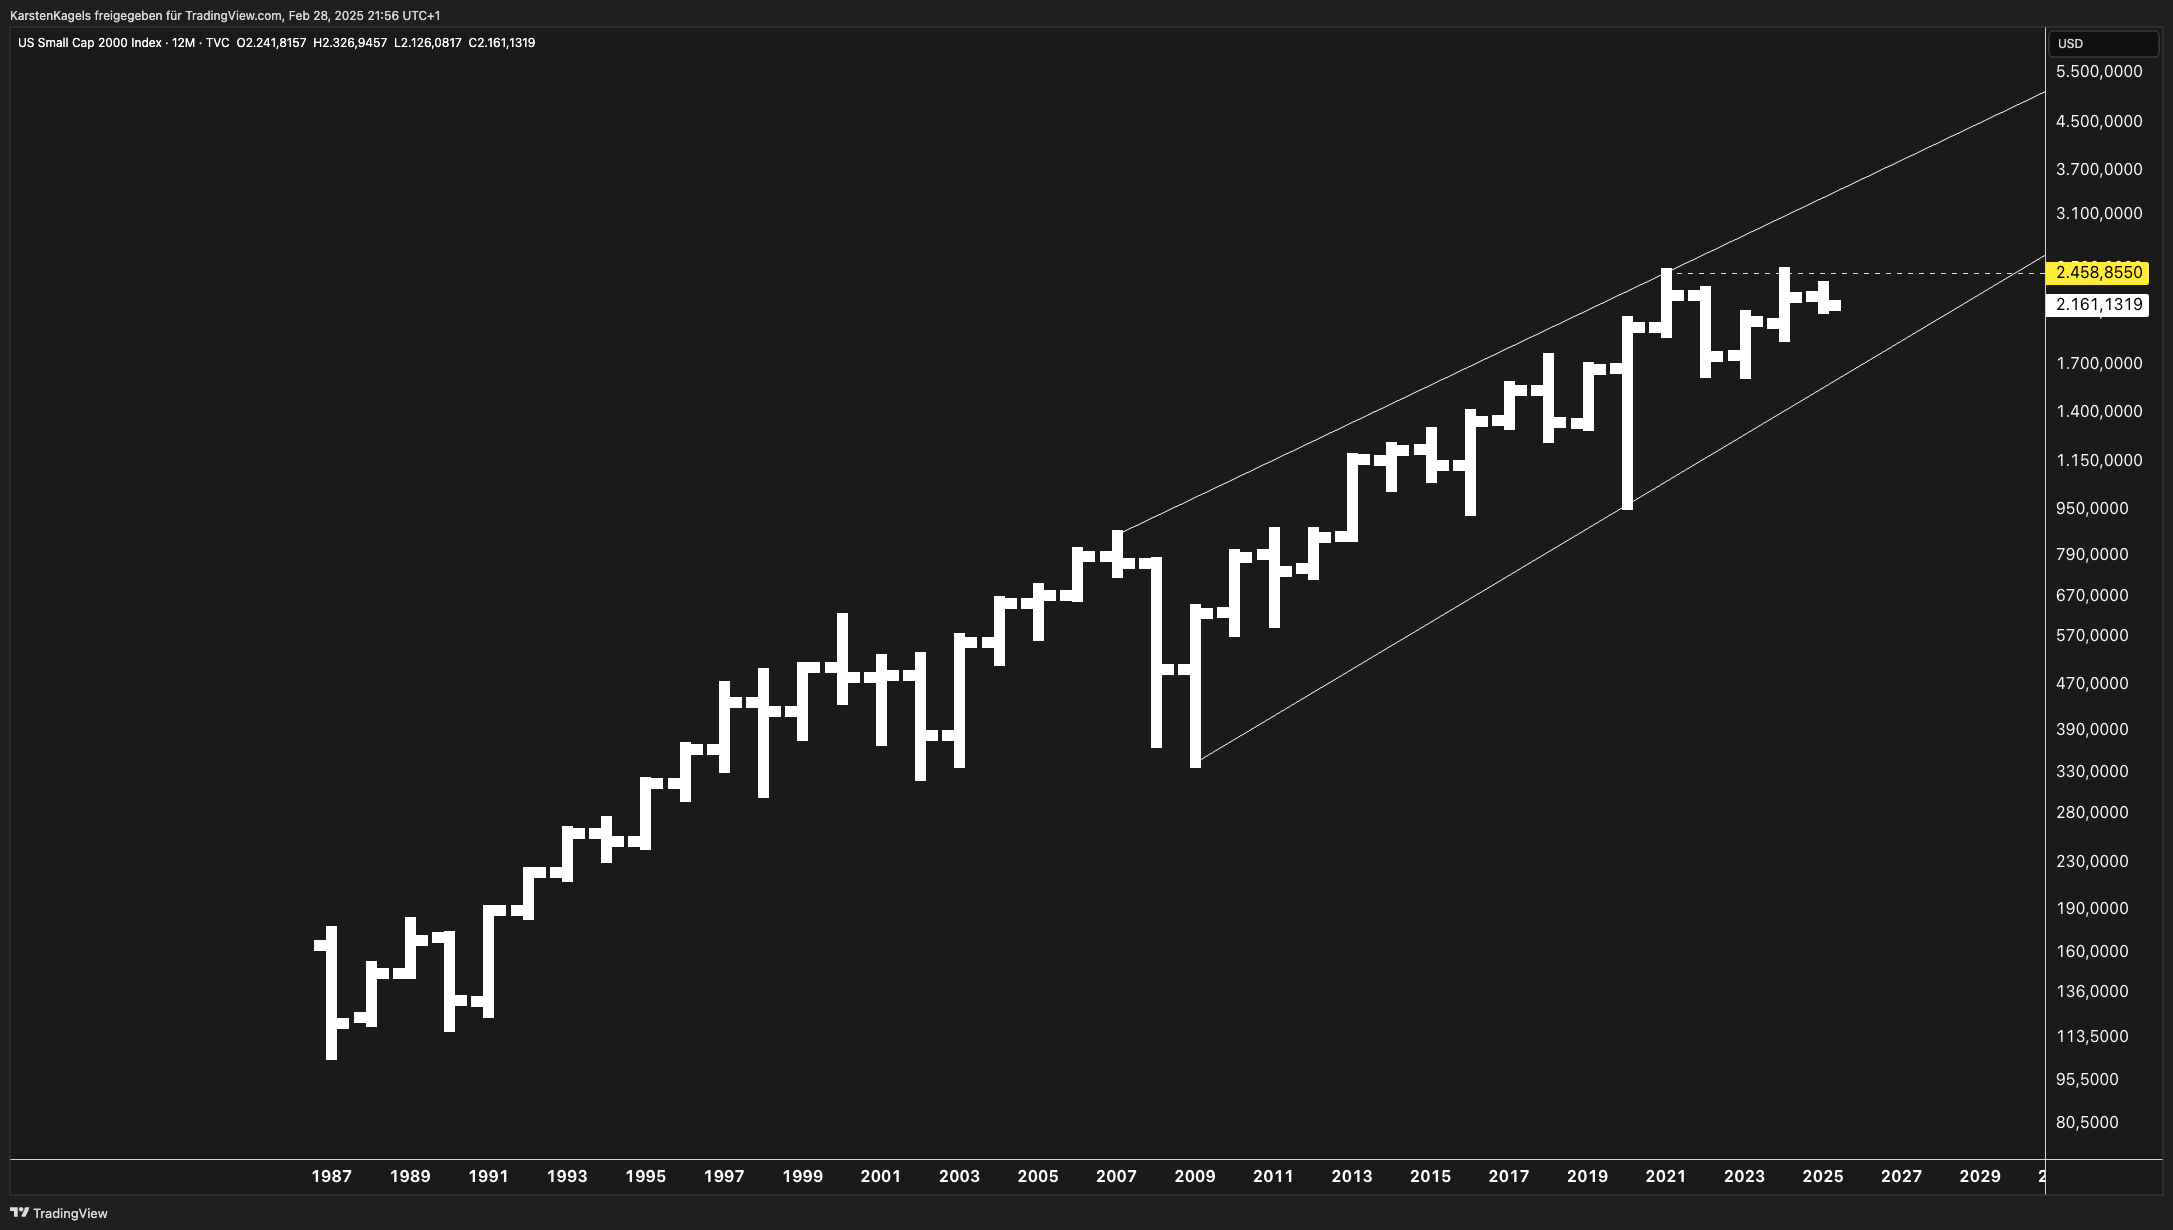
Long-Term Analysis and Forecast for the Russell 2000 Index
Technical analysis and forecast for the Russell 2000 Index (US Small Cap 2000 Index) based on the long-term yearly candlestick chart:
Technical Analysis:
- Long-Term Uptrend:
- The chart shows a strong long-term uptrend, with the Russell 2000 consistently forming higher highs and higher lows over the past decades.
- A well-defined ascending channel is visible, with price action respecting both the upper and lower trendlines.
- Key Support and Resistance Levels:
- Support: The lower boundary of the channel, currently around 1,700 – 1,800, serves as a long-term support level.
- Resistance: The upper boundary of the channel, currently around 3,100 – 3,500, acts as a strong resistance zone.
- Recent Market Behavior:
- The index has faced consolidation near the midpoint of the channel, struggling to break the 2,450 resistance level.
- Volatility remains a factor, as seen in previous market downturns (e.g., 2008 crash and 2020 pandemic drop), but the long-term trend remains intact.
Forecast for the Russell 2000:
- Bullish Scenario (Optimistic Projection):
- If the index maintains its long-term channel, the next major upside target lies around 3,100 – 3,500 within the next 3–5 years.
- A breakout above 2,450 would confirm bullish momentum and could accelerate gains toward the upper trendline.
- Bearish Scenario (Risk Factors):
- A breakdown below 1,800 could signal a deviation from the historical trend and potentially lead to a larger correction.
- Economic slowdowns, rising interest rates, or sectoral weaknesses in small-cap stocks could put downward pressure on the index.
Conclusion:
- The long-term trend remains bullish, with a high probability of continued upward movement.
- Investors should watch the 2,450 resistance level for confirmation of further bullish momentum.
- Downside risks remain, but as long as the 1,800 support level holds, the long-term uptrend is intact.
Latest posts by Karsten Kagels (see all)
- Gold (XAU/USD) Forecast April 2025: Price Targets & Expert Assessment - April 5, 2025
- ETH/USD Forecast April 2025: Price Targets & Expert Assessment - March 29, 2025
- BTC/USD Forecast April 2025: Price Targets & Technical Analysis After New ATH - March 29, 2025