Technical Analysis of Long-Term ZB Chart
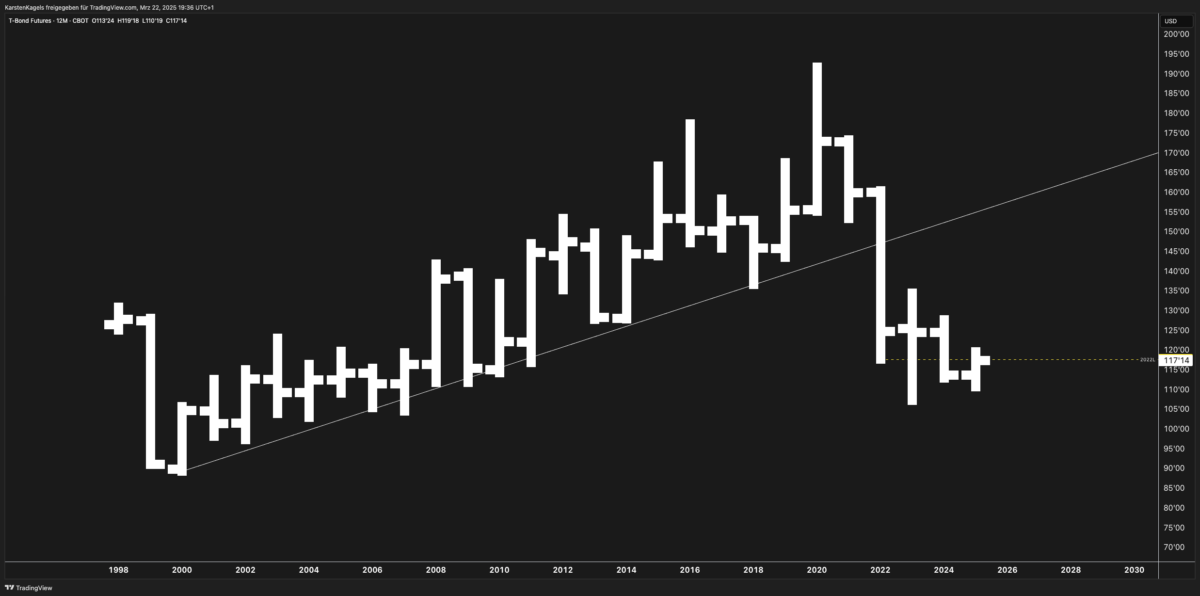
Looking at the uploaded chart for the 30-year Treasury Bond futures (ZB), I can see several significant technical patterns:
- Long-term uptrend: A clear ascending trendline from 1998 through 2020, showing the multi-decade bull market in bonds.
- Major price peak: The market reached its all-time high around 2020, approaching the 180 level.
- Recent correction/downtrend: Since 2020, there’s been a significant correction, with prices dropping to approximately the 115-120 level.
- Support level: Current prices appear to be finding support around the 117 level (marked with a horizontal dotted line on the chart).
- Trend relationship: Current prices have broken below the long-term ascending trendline that had been intact for over 20 years.

Multiple Scenario Forecast
Bullish Scenario
- Trigger: Federal Reserve pivoting to rate cuts, economic slowdown, or geopolitical crisis driving safe-haven demand
- Technical target: Potential recovery toward the 140-145 resistance zone
- Timing: Could develop over the next 12-18 months if inflation continues to moderate
Neutral/Consolidation Scenario
- Range: Prices could consolidate between 115-130 level
- Duration: Potentially lasting 6-12 months as markets digest economic data
- Key level: The 120 level appears to be an important psychological level
Bearish Scenario
- Risk factors: Persistent inflation, larger-than-expected government deficits, increased Treasury supply
- Technical target: Break below 115 could accelerate selling toward 100-105
- Support levels: Major long-term support exists around the 100 level from pre-2008 trading
Macroeconomic Factors Affecting T-Bonds
- Interest rate expectations: The primary driver, with Fed policy directly impacting bond valuations
- Inflation outlook: Higher inflation typically pressures bond prices lower (yields higher)
- Government deficit/debt levels: Increasing supply of Treasury bonds can weigh on prices
- Economic growth: Stronger growth often leads to higher yields (lower prices)
- International capital flows: Foreign buying/selling of US debt affects price dynamics
Comparative Market Analysis
- Correlation with other fixed income securities: T-Bond futures often move in tandem with other government and corporate bonds, but with different magnitudes
- Inverse relationship with equities: Generally, during periods of market stress, T-Bonds often rally as investors seek safety
- Dollar relationship: T-Bond prices can be sensitive to USD strength/weakness, especially during periods of international capital flow shifts
- Yield curve dynamics: Relationship between 30-year, 10-year, and 2-year Treasuries provides insights into economic expectations
Market Sentiment & Institutional vs. Retail Outlook
- Institutional positioning: Large asset managers and pension funds remain significant holders despite the recent downturn
- Central bank activity: Reduced buying from major central banks has impacted the demand side
- Retail sentiment: Generally bearish after experiencing significant drawdowns in bond funds
- Volatility expectations: The long-term chart suggests historically elevated volatility may persist as markets adjust to a new interest rate regime
Beginner Section: Understanding T-Bond Futures
The 30-year Treasury Bond futures contract (ZB) represents one of the most important financial instruments in global markets. It tracks the price of long-term US government debt, which serves as a benchmark for many other interest rates. Traders monitor T-Bonds for:
- Interest rate expectations: Bond prices move inversely to yields
- Economic outlook signals: The “smart money” often expresses views on future economic conditions through bond positioning
- Risk sentiment indicator: Flight-to-quality moves during market stress
- Portfolio hedging: Institutional investors use T-Bond futures to manage duration risk
FAQ Section
What causes T-Bond futures prices to rise or fall?
T-Bond futures prices rise when yields fall, typically during economic uncertainty, deflationary pressures, or when the Federal Reserve is expected to cut interest rates. Prices fall when yields rise, often during periods of inflation, strong economic growth, or when the Fed is hiking rates.
How do T-Bond futures relate to mortgage rates?
While not directly linked, T-Bond yields influence the broader interest rate environment. Mortgage rates tend to follow similar patterns but with additional risk premiums. When T-Bond prices rise (yields fall), mortgage rates typically decrease as well, though not always proportionally.
What is the relationship between the Fed and T-Bond futures?
The Federal Reserve’s monetary policy directly impacts short-term interest rates, which then influence longer-term rates reflected in T-Bond futures. Market participants constantly interpret Fed communications for clues about future policy changes and position accordingly.
How can retail traders use T-Bond futures?
Retail traders can use T-Bond futures for speculation on interest rate movements, portfolio hedging, or as part of spread trades. However, due to the contract size, many retail traders opt for ETFs like TLT that track similar exposures with smaller capital requirements.
What technical indicators work best for T-Bond futures?
Moving averages, trendlines, and support/resistance levels tend to work well for T-Bonds. Volume analysis can be particularly useful during major market turns. RSI and MACD can help identify potential reversals.