Introduction
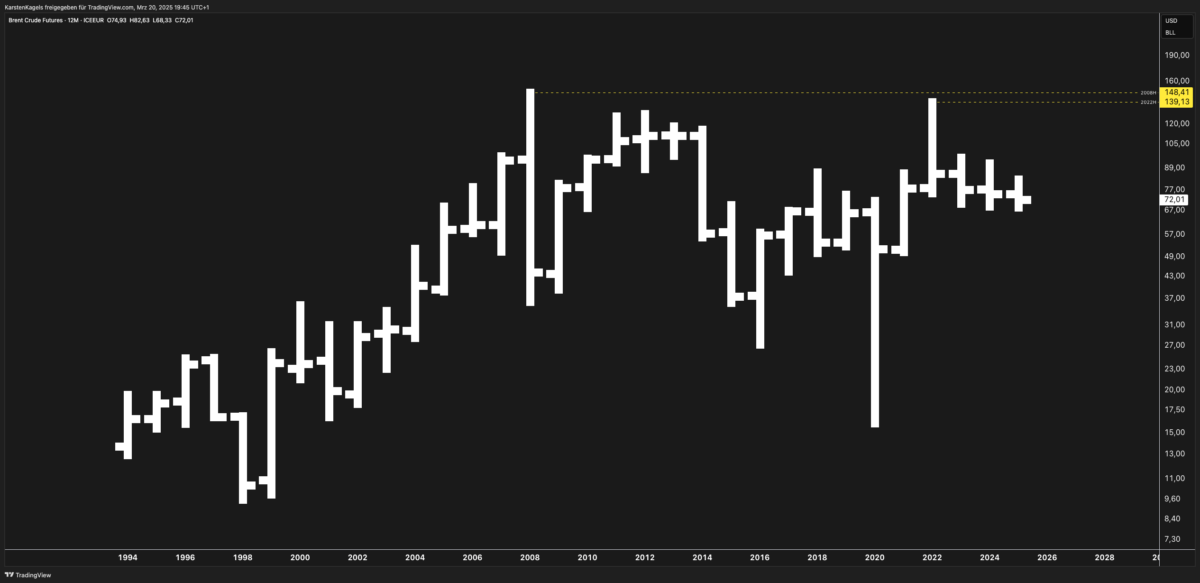
The chart shows the long-term price history of Brent Crude Futures (BRN) from approximately 1994 to early 2024, displaying a volatile price journey with significant highs and lows over nearly three decades. Currently, the price is trading around $72.01, well below historical peaks but maintaining a relatively stable range in recent years.

Technical Analysis
Major Support & Resistance Levels
- Strong historical resistance around $145-150 (seen in 2008 and 2022)
- Current trading range support around $65-70
- Historical support zones around $20-25 (tested in early 2000s and briefly in 2020)
Long-Term Trend Analysis
The Brent Crude market has experienced several distinct cycles:
- 1994-1999: Relatively low price environment ($10-25 range)
- 2000-2008: Strong bull market culminating in the 2008 peak near $145
- 2008-2009: Sharp correction during financial crisis
- 2009-2014: Recovery and stability around $100-120
- 2014-2020: Significant bear market and volatility
- 2020-present: Recovery from COVID lows and consolidation
The market appears to be in a long-term consolidation phase after the extreme volatility of 2020-2022, with prices stabilizing in the $70-90 range.
Fibonacci Retracement Analysis
From the 2020 low to the 2022 high, current prices represent approximately a 50% retracement, suggesting balanced market forces between bulls and bears.
Macroeconomic Factors
Supply Dynamics
- OPEC+ production decisions remain pivotal to global supply
- US shale production flexibility creates price ceiling effects
- Recent geopolitical tensions in the Middle East affecting risk premiums
Demand Considerations
- Global economic growth forecasts show mixed signals
- Energy transition efforts impacting long-term oil demand outlook
- Transportation sector evolution (electric vehicles) creates headwinds
Global Economic Risks
- Inflation pressures and central bank policies affecting energy consumption
- USD strength correlation with oil prices (inverse relationship)
- Potential economic slowdowns in major economies like China affecting demand
Multiple Price Scenarios
Bullish Case (12-24 months)
- Prices could retest the $90-100 range if:
- Geopolitical tensions escalate in key production regions
- OPEC+ maintains strict production discipline
- Global economic growth exceeds expectations
- Potential target: $85-95 range
Neutral Case (12-24 months)
- Continued consolidation in the $65-85 range if:
- Supply and demand remain relatively balanced
- No major geopolitical disruptions occur
- Economic growth remains moderate
- Potential range: $65-85
Bearish Case (12-24 months)
- Downside risks toward $50-60 if:
- Global recession materializes
- OPEC+ coordination breaks down
- Energy transition accelerates faster than expected
- Potential target: $55-65 range
Comparative Market Analysis
Energy Market Correlations
- Natural gas prices showing divergence from oil in recent years
- Refined products (gasoline, diesel) spreads indicating demand patterns
- Renewable energy investment trends creating long-term structural changes
Cross-Asset Relationships
- USD strength typically pressures oil prices
- Inflation expectations closely tied to energy prices
- Equity market correlations with oil becoming more complex
Market Sentiment & Positioning
Institutional vs. Retail Outlook
- Large speculators currently holding modest net long positions
- Commercials (hedgers) maintaining strategic short positions
- Retail sentiment appears mixed with slight bearish bias
Key Liquidity Zones
- $65-70 zone represents significant technical and psychological support
- $80-85 area has become important resistance in recent market structure
- The $100 mark remains a critical psychological level for market participants
For Beginners: Understanding Brent Crude Futures
Brent Crude is the international benchmark for oil prices, representing light, sweet crude oil from the North Sea. It’s used to price approximately two-thirds of globally traded oil. The futures market allows producers, consumers, and speculators to manage price risk and express market views.
Key factors that make Brent Crude important:
- Essential input for global transportation and industrial processes
- Significant impact on inflation and economic growth
- Geopolitical importance as a strategic resource
Conclusion
The Brent Crude market appears to be in a consolidation phase after extreme volatility in 2020-2022. The long-term chart suggests a market finding equilibrium between structural demand changes (energy transition) and traditional supply-demand fundamentals. Traders should monitor OPEC+ decisions, global economic indicators, and geopolitical developments for clues about future price direction.
FAQ
Q: What is the most significant factor affecting Brent Crude prices currently? A: OPEC+ production decisions, geopolitical tensions in the Middle East, and global economic growth expectations are the three most important factors.
Q: How does the energy transition affect oil price forecasts? A: The energy transition creates long-term headwinds for oil demand, potentially limiting upside price potential while making the market more sensitive to short-term supply disruptions.
Q: What technical levels should traders watch closely? A: The $65-70 support zone and $80-85 resistance area are crucial for near-term price action, while the psychological $100 level remains significant for longer-term sentiment.