
Market Profile: TPO Charts, Value Area and Costs


Contents
- Market Profile in 30 seconds
- What is the Market Profile?
- Where the Market Profile comes from
- How a Market Profile chart is built
- Day types and profile shapes
- Initiative or responsive: who is trading?
- Market Profile vs. volume profile
- Three Market Profile setups
- Which platforms include the Market Profile, and what does it cost?
- Pros and cons of the Market Profile
- Conclusion: who should use the Market Profile?
- Frequently asked questions about the Market Profile
- About the author
A candlestick chart shows where price was, but not how long it stayed there. That information often decides whether a level holds or breaks. The Market Profile turns the view around: it stacks every half hour of trading as a letter next to the price where it happened. The result looks like a bell curve on its side and shows at a glance which prices the market accepted and which it rejected at once.
This guide covers the craft and the cost. First the structure: the point of control, the value area, single prints and the profile types that separate a trend day from a range day. Then the question many guides skip: which platforms include a real Market Profile and what it costs, because it is not an indicator you can switch on in every free platform.
Karsten Kagels has traded since 1980 with price levels, not with the letter profile. He looks at the Market Profile from the outside, with an honest view of what it adds and where it overlaps with classic price action. Platform prices and plan details were checked on the providers’ pages on November 22, 2026. This article follows our editorial policy.
Market Profile in 30 seconds
- Time on the price axis: the Market Profile splits the session into periods of usually 30 minutes and marks each one with a letter at every price that traded in it.
- Point of control: the price with the most letters, where the market spent the most time. The volume point of control is its counterpart for volume.
- Value area: the zone that holds about 70 percent of the activity; prices above and below it were rejected as unfair.
- Day types and shapes: normal, normal variation, trend, double distribution and neutral days, plus D, P, b and B shapes, show who controlled the day.
- Cost: from $0 with the free ATAS Start plan, with delayed futures data; TradingView includes it from the Plus plan, and Sierra Chart’s TPO study with outside data connections costs $46 a month.
What is the Market Profile?
The Market Profile is a chart that splits the session into equal time periods and shows, for each price, how long the market traded there. A candlestick chart arranges time from left to right and compresses each period into four values. The Market Profile drops the time axis and collects all periods horizontally at their price. A level that traded for five hours becomes a long row; a price the market only touched briefly stays a single letter.
Behind it lies an economic idea, not a formula. The profile assumes that a market is an auction that keeps searching for a fair price. Where much time is spent, buyers and sellers found agreement; where price runs away at once, the price was rejected. That is why the Market Profile is a tool for reading market structure, not an indicator that produces signals. Our guide to auction market theory explains the ideas behind it.
A TPO, short for time price opportunity, is a single letter in the Market Profile and marks that a price traded in a given time period. The first half hour of the session is A, the second B, and so on. If price touches eight levels in that half hour, eight A’s stand on top of each other. The letters are a tally of time at price.
Where the Market Profile comes from
The Market Profile was developed by Peter Steidlmayer, a trader at the Chicago Board of Trade, in the 1980s. He looked for a way to see value develop during the day and built it from the exchange’s time and price records. The CBOT adopted the concept and published it under the name Market Profile.
Electronic charts made it available to private traders. Today it is built into several platforms, but often only in higher-priced plans or as an add-on, which is why it is still a niche tool for many traders.
How a Market Profile chart is built
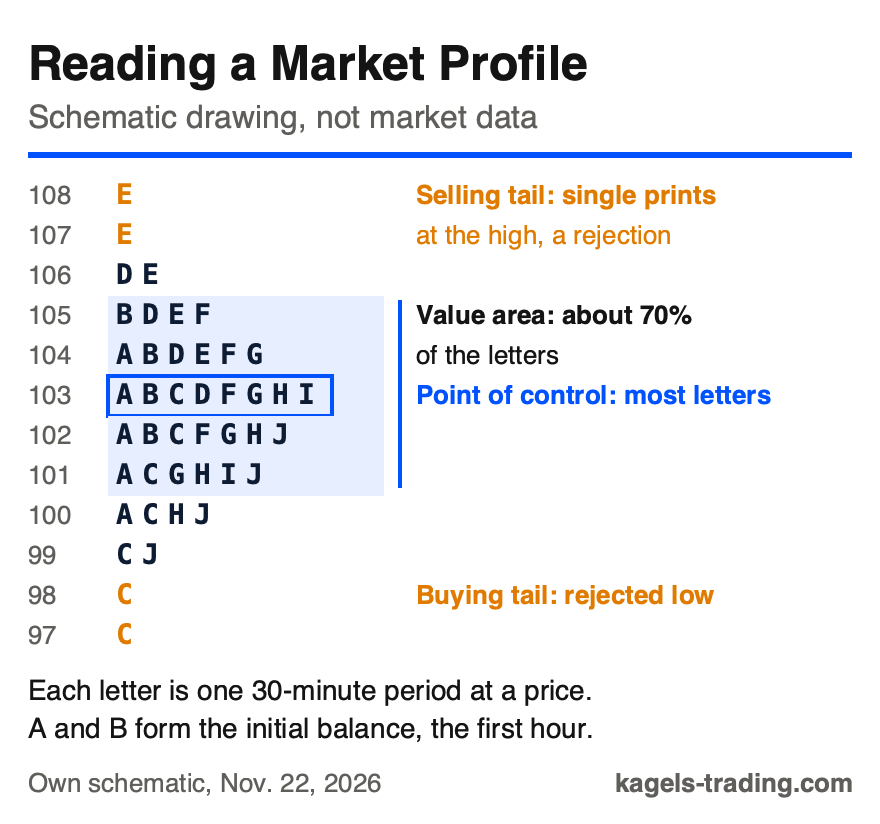
A Market Profile looks busy at first, but three building blocks make it readable: the letters, the point of control and the value area. The schematic below shows a single day with all the parts explained in this section, built from tick data. Clean data matter: if ticks are missing, letters are missing, and the point of control may land on the wrong level.
 Click to enlarge
Source: Kagels Trading, own schematic.
The letters and the initial balance
The letters run through the session in alphabetical order. A and B together cover the first hour and form the initial balance, the price range of the first two periods. It is the reference frame for the rest of the day.
A clear break beyond the initial balance is called a range extension. It hints that longer-term traders are taking control of the day. If trading stays inside the initial balance, the balance of power has not changed. Because many markets now trade far longer than the old CBOT session, platforms add lower-case letters for the later periods.
Point of control and volume point of control
The point of control, POC for short, is the price with the most TPOs, the level where the market spent the most time in the period. It is a statement about time, not about volume, and that is where the most common mix-up starts.
The volume point of control, VPOC, is the price where the most volume traded. The two often sit close together but are not the same. They split when price swings for a long time at one level on little volume. Check in your platform which of the two it draws as POC: a volume profile almost always shows the VPOC, a classic letter profile the time POC.
A naked POC is the point of control of an earlier session that price has not touched since. Such levels often act like a magnet, because much trading took place there. In Karsten’s own work, these are exactly the prices he notes as confluence levels, even without a letter profile.
The value area and the 70 percent mark
The value area is the price zone that holds about 70 percent of the activity in a period. The figure is a convention: it is close to one standard deviation of a normal distribution, which covers about 68.3 percent of values, but prices are not normally distributed, so the 70 percent is a practical rule, not a statistical proof. Some platforms let you set 68 or another share.
Inside the value area, the market is in balance. Above it lie prices the market treated as too high, below it prices treated as too low. In auction terms, both are unstable: if participants reject them, price tends to move back into the value area. In practice, you compare today’s price with yesterday’s value area.
Single prints and tails
A single print is a price with only one TPO, because the market touched it in just one period. Several single prints in a row at the low of the profile form a buying tail, at the high a selling tail: price was there briefly and was rejected.
Tails and internal single prints mean different things. A tail at the extreme shows a clear rejection of that price. Single prints inside the profile mark a fast move through a price zone without much trade; when price returns there, it often moves through again quickly. A high or low without a tail, a so-called poor high or poor low, lacks that rejection and is often seen as unfinished. Stops also cluster at the extremes of profiles, which leads to the moves we describe as a liquidity sweep, a fast run through those stops.
Day types and profile shapes
Market Profile traders classify a session in two different ways: by day type and by the shape of the profile. Day types describe how the range developed against the initial balance; shapes describe the silhouette of the finished profile. The two often go together, but they are not the same classification.
| Day type | How the range develops | What it suggests |
|---|---|---|
| Normal day | Wide initial balance, little or no range extension later | Balance; the range is set early, often after news at the open |
| Normal variation day | Range extension to one side later in the day | Longer-term traders set a new fair price |
| Trend day | Narrow initial balance, steady extension in one direction | Longer-term traders lead all day; positions can run |
| Double distribution day | A move to a new area that builds a second distribution | The thin zone between the two is often retested |
| Neutral day | Range extension on both sides of the initial balance, close near the middle or near one extreme | Neither side kept control |
The shapes are named after letters. A D-shape is balanced with the point of control near the middle. A P-shape has its value high in the range with a thin tail below, often from short covering; a b-shape is the mirror image, often from long liquidation. A B-shape shows two separate distributions on top of each other.
For day traders, trend days are often the most profitable and normal days the most two-sided. On a normal day, the extremes offer a good reward-to-risk ratio, because nobody controls the day. On a trend day, fading the move is the most expensive mistake, and holding a position with the trend pays best.
Initiative or responsive: who is trading?
The Market Profile divides participants into groups, and that is the real framework behind the picture. Longer-term traders have a view and the money to act on it, and only they can start new trends. Shorter-term traders react to the day’s structure, and day traders follow the move or look for imbalances.
James Dalton adds a finer distinction. Initiative buyers buy in or above the previous day’s value area; they act from conviction, because they pay yesterday’s value or more. Responsive buyers wait below the value area for a bargain. Buying above the old value area therefore points more to rising value than buying below it.
When the market trades outside the previous day’s value area, there is one question to answer. Does the imbalance resolve with a return into the value area, or does the move continue? That question is the core of every Market Profile strategy, and our guide to supply and demand trading describes the same imbalances in other words.
Market Profile vs. volume profile
The two tools look similar on the chart but measure different things. A volume profile spreads the traded volume across price levels; the Market Profile spreads the time. Mixing them up is the most common beginner mistake, and it costs money, because cheaper plans often include only one of the two.
An example shows the difference. If price drifts sideways in a narrow range for two hours on little volume, the Market Profile shows a long row of letters there, the volume profile only a short bar. One hectic minute with huge volume creates a long volume bar but only a single TPO.
Which tool is better depends on the market. In futures, real exchange volume is available, and the volume profile is meaningful. In forex there is no central volume, only each broker’s tick volume, so the time-based Market Profile is the more consistent view, because time is the same for every data feed.
If you want both in one view, you end up with order flow tools. Our guides to order flow trading and to the TradingView volume footprint show how volume can be split down to bid and ask, and platforms such as ATAS draw both profiles next to each other.
Three Market Profile setups
The Market Profile gives no buy signals; it gives reference levels where you can make a decision. Three setups appear again and again in the literature and in practice. They replace neither a trading plan nor risk control; they describe situations in which the profile asks a clear question.
The 80 percent rule
The 80 percent rule says that if price returns into the previous day’s value area and stays there for two periods, it usually travels to the opposite edge. The market opens outside yesterday’s value area, moves back inside and stays for two full periods, usually an hour. The target is the other edge of the value area; the stop sits outside the zone.
The 80 percent is a rule of thumb from the literature, not a published exchange statistic. It also applies only in balanced markets; on a trend day, price runs through the old value area. Our SPY test in the auction market theory guide linked above found the far edge reached in 50.7 percent of cases, but it used an approximate volume value area and a trigger of two periods touching value, not two full periods inside a TPO value area. Read it as a warning that the 80 percent needs checking, not as a test of this exact setup.
The naked POC test
An untouched point of control from an earlier session is a level with an open account. The setup waits for price to reach it and watches the reaction: if price bounces, the POC acted as support or resistance; if price runs straight through, the level is used up and loses its meaning.
The order of steps matters. You do not trade the POC itself, but the reaction at it. Buying only because a naked POC sits below the price is trading an assumption; our guide to the market structure shift shows how to define such a confirmation.
The range extension from the initial balance
The third setup uses the first hour as a frame. If price leaves the initial balance clearly and keeps pushing in the same direction, that points to initiative traders. The pattern belongs to the trend day and works best when the initial balance was relatively narrow; our guide to the opening range breakout trades a similar idea with fixed rules.
The most common trap is the false breakout. Price exceeds the initial balance by a few ticks, prints single letters there and turns back at once. Technically, that is still a range extension, but a failed one: it was a run on the stops, not the start of a trend.
Which platforms include the Market Profile, and what does it cost?
This is where it gets concrete, because it decides whether you can use the Market Profile at all. In most platforms, the time profile with letters is an extra, not a standard tool. We checked the providers’ pages on November 22, 2026; prices can change, and some depend on your region.
| Platform | Market Profile feature | Cost |
|---|---|---|
| MetaTrader 5 | Session Market Profile documented for the Android app, no direct POC | Free with a MetaTrader 5 broker |
| TradingView | Time price opportunity (TPO), not in Essential | From the Plus plan; price depends on region and billing |
| Sierra Chart | TPO Chart Study in Packages 5, 11 and 12 | $36 a month without outside data connections; $46 a month (Package 11) with them, plus data fees |
| ATAS | Market Profile and TPO in every plan | Free Start plan; Start and Plus get futures data with a 15-minute delay, live futures from Pro |
| NinjaTrader | Order Flow+ volume profiles, not a letter-based TPO profile | Unlocked with a funded NinjaTrader brokerage account |
Sources: TradingView and ATAS pricing pages, Sierra Chart service packages page and MetaTrader 5 help, read November 22, 2026; NinjaTrader as stated in our review.
TradingView draws the line in the middle of its plan list. On its pricing page, the volume profile indicators are included in every paid plan, but the time price opportunity feature, the real Market Profile, is marked as not included in Essential and included from Plus upward. Our TradingView guide covers the plans.
Sierra Chart draws a similar line. The standard Service Package 3 costs $26 a month; the TPO Chart Study is listed among the advanced features of Service Package 5 at $36 a month. Packages 3 and 5 cannot connect to outside data or trading services, such as Rithmic or CQG, or to Sierra Chart’s Denali feed; for the TPO study with those connections you need Service Package 11 at $46 a month, plus data fees.
The cheapest routes are ATAS and MetaTrader 5. ATAS includes Market Profile and TPO even in its free Start plan, but futures data arrive with a 15-minute delay until Pro, according to its pricing page. MetaQuotes documents a Market Profile indicator for the MetaTrader 5 Android app that draws time-at-price profiles for the Asian, European and American sessions; it is a session profile, not a letter profile, and it does not calculate a point of control directly. Our overview of trading sessions explains the sessions.
Real-time data are a separate bill. The software shows the profile, but the exchange sells the data, and without live data the profile does not build during the session. At NinjaTrader, for example, the CME Group Level I bundle for non-professionals is listed at $12 a month and free with a funded account, according to our NinjaTrader review. A Market Profile needs no Level II data, because it is built from traded prices, not from the order book.
Pros and cons of the Market Profile
After more than four decades in the market, Karsten is skeptical of tool promises. The Market Profile has real strengths, but it also has a price, and not only in dollars.
Pros of the Market Profile
- Time becomes visible: no other standard tool shows so directly how long a price was accepted.
- Clear reference levels: POC, value area and initial balance are defined exactly, unlike a trendline drawn by eye.
- Works without volume data: because it counts time, it is useful in forex, where central volume is missing.
- Day structure at a glance: the profile shape shows in seconds whether a session was a trend day or a range day.
Cons of the Market Profile
- It costs money: the real time profile often sits in an add-on or a higher plan, plus exchange fees.
- Steep learning curve: letters, TPOs, tails and six profile types are a lot of vocabulary.
- Context, not signals: the profile shows where important levels are, never when to trade.
- Much works without it: the prior day’s high and low and heavily traded zones are visible on a normal chart if you know what to look for.
Conclusion: who should use the Market Profile?
The Market Profile is not an indicator in the usual sense, and that is what makes it interesting. It calculates nothing; it sorts the session differently. What you see is an honest picture of which prices the market accepted and which it rejected.
The other half of the truth: the questions it answers can also be answered on a normal chart. If you note the prior day’s high and low, the heavily traded zones and the reaction at these levels, you work in a very similar way, only without letters. Karsten works like that, with a map of price levels across several time frames; the thinking of the Market Profile is in it, the tool is not.
It is most useful for two groups. Intraday futures traders get a more precise frame from POC and value area than from round numbers. And traders who have no fixed reference levels yet learn quickly from the profile why some prices hold and others do not. Plan for a few weeks of practice and the monthly budget from the cost overview above.
Frequently asked questions about the Market Profile
What is the Market Profile?
The Market Profile is a chart that splits the session into time periods of usually 30 minutes and marks each period as a letter at every price that traded. It was developed by Peter Steidlmayer at the Chicago Board of Trade in the 1980s. It shows how long the market stayed at each price, and so which prices it accepted.
What is the point of control?
The point of control is the price with the most letters, where the market spent the most time. It is a statement about time. The volume point of control is the price with the most volume; the two are often close but not identical.
What is the 80 percent rule in Market Profile?
It says that if price returns into the previous day’s value area and holds there for two periods, it usually travels to the other edge. The figure is a rule of thumb, not a published statistic. Our SPY test, which used an approximate volume value area and a looser trigger, found the far edge reached in 50.7 percent of cases.
How much does Market Profile software cost?
It ranges from free to a monthly subscription. ATAS includes it in its free Start plan with delayed futures data, TradingView from its Plus plan, and Sierra Chart’s TPO study costs $46 a month in the package that connects to outside data. Real-time exchange data come on top.
What is the difference between Market Profile and volume profile?
The Market Profile spreads time across price levels; the volume profile spreads traded volume. If price drifts for a long time on little volume, the Market Profile shows a lot there and the volume profile little. In forex, the time-based profile is the more consistent choice, because there is no central volume.
Is the Market Profile suitable for beginners?
Partly, because it takes practice to read. The basic idea takes ten minutes to understand; reading the profile types and tails fluently takes weeks. If you do not yet have a trading plan and a routine with reference levels, start there; the Market Profile refines both but replaces neither.
This English edition is based on our German edition on kagels-trading.de and has been adapted for international readers.
More Order Flow & Volume Analysis guides
- Read order flow
Order Flow Trading: What the Data Shows and What It Hides
Market and limit orders, DOM, tape, footprint and profile, three patterns, a worked ES example with a failure, and the limits of the data.
- Read volume by price
Volume Profile: POC, Value Area and a Test of 1,438 Days
POC, value area and volume nodes, the six TradingView profiles, and what 1,438 SPY daily profiles say about the popular rules.
- Understand the auction
Auction Market Theory: Balance, Value and the 80% Rule
Price vs value, balance and imbalance, initiative and responsive trading, and what our SPY test shows about the 80% rule.
- Test volume profile setups
Volume Profile Strategy: 3 Setups Backtested on SPY
POC bounce, value area reversal and breakout as fixed rules on 1,403 SPY days and QQQ: how often 2R came and why the POC result is fragile.
- Choose an order book tool
Bookmap Review 2026: Pricing, Data Costs and Who It Suits
What the Bookmap heatmap shows, the four packages, why US market data costs extra and how it compares with ATAS.
- Check ATAS
ATAS Review 2026: Prices, Free Plan and Order Flow Tools
The footprint platform: plan prices checked 21 November 2026, which plan unlocks real-time futures, the trial and refund terms and the MBO change on 1 December.
- Interpret volume
Volume Analysis in Trading: How to Read Volume Honestly
What volume counts in stocks, futures, forex and crypto, how to read it against its own average, and our SPY test of high-volume days since 2001.
- Check Deepcharts
Deepcharts Review: Order Flow, Pricing, and IQ Capital Access
Deepchart footprint, profile and DOM for futures: bundle prices checked 7 November 2026, data costs, the narrow refund terms and access through IQ Capital.