
Auction Market Theory: Balance, Value and the 80% Rule


Contents
- Auction market theory in 30 seconds
- What is auction market theory?
- Price vs value: the most important distinction
- Balance, imbalance and transition: the auction cycle
- Value area and point of control
- Initiative and responsive activity
- How the open relates to value
- The 80% rule: what it says and what my SPY test shows
- Auction market theory and order flow
- How to use auction market theory in your trading
- Strengths and limits of auction market theory
- Books on auction market theory
- Conclusion: a map of the auction, not a forecast
- Frequently asked questions about auction market theory
- About the author
Auction market theory explains why price rotates in a range for days and then suddenly runs. It treats every market as a two-way auction that searches for a price where both sides keep trading. Where that works, the market is in balance. Where it fails, price moves until it finds new business.
This guide explains the core ideas in plain terms and checks the most quoted rule against real data. You will learn the difference between price and value, how the value area and point of control work, what initiative and responsive trading mean, and how the theory connects to order flow. In my test of 1,412 pairs of trading days in the S&P 500 ETF SPY, the famous 80% rule reached its target about half the time. This article follows our editorial policy.
Auction market theory in 30 seconds
- The idea: the market’s job is to facilitate trade. Price moves up to find sellers and down to find buyers.
- Price vs value: price is any traded level. Value is the zone where most trading happened, the value area around the point of control.
- Two states: in balance the market rotates inside value. In imbalance it leaves value and searches for a new one.
- Who acts: initiative buyers buy within or above the prior value area, initiative sellers sell within or below it. Responsive traders fade price back toward value.
- My SPY test: after the popular 80% rule trigger, price reached the far edge of value in 50.7 percent of cases, well short of the 80 percent in the rule.
What is auction market theory?
Auction market theory (AMT) is a way of reading markets as a continuous two-way auction in which price moves to find the level where buyers and sellers agree to trade, and where time and volume show which prices the market accepts.
The theory grew out of the Market Profile at the Chicago Board of Trade. According to TradingView’s help on the TPO indicator, J. Peter Steidlmayer formulated the concept of time price opportunity at the CBOT in the 1980s. The exchange released the Market Profile to the public in 1985 as part of a CBOT product. James Dalton and his co-authors later built the trading framework that most traders now call auction market theory.
The core claim is simple: the market is not trying to go up or down, it is trying to trade. When price rises, it is advertising for sellers. When it falls, it is advertising for buyers. If the advertising works, volume comes in and the market stays there for a while. If it fails, price moves on quickly, because nobody wanted to trade at that level.
I have traded price action since 1980 and added order flow late; AMT provides context rather than a complete trading system. It does not tell you when to click buy. It tells you where the market has done business, where it has not, and whether it is currently rotating or searching. That context makes a price action setup at a level easier to judge.
Price vs value: the most important distinction
Price is where the market trades right now; value is where it traded most over a period. A spike to a new high is a price, but it is not yet value. It becomes value only when the market spends time there and builds volume.
This distinction gives you two questions for every move: was the new price accepted or rejected? Acceptance means the market keeps trading at the new level, builds volume and does not snap back. Rejection means price touches the level, finds no business and returns fast, often leaving a thin tail in the profile. Traders read the same wick on a candlestick chart as rejection.
Value moves over time, and the direction it moves in tells you more than any single bar. If each day’s value area sits above the prior one, value is migrating higher. If the value areas overlap day after day, the market is in balance, even when individual bars look dramatic.
Balance, imbalance and transition: the auction cycle
Markets alternate between balance and imbalance, and AMT is mostly about recognising which state you are in. In balance, buyers and sellers agree roughly on value. Price rotates between the edges of a range, and moves away from the middle tend to come back. In imbalance, one side is clearly more urgent, and price travels in one direction until a new agreement forms.
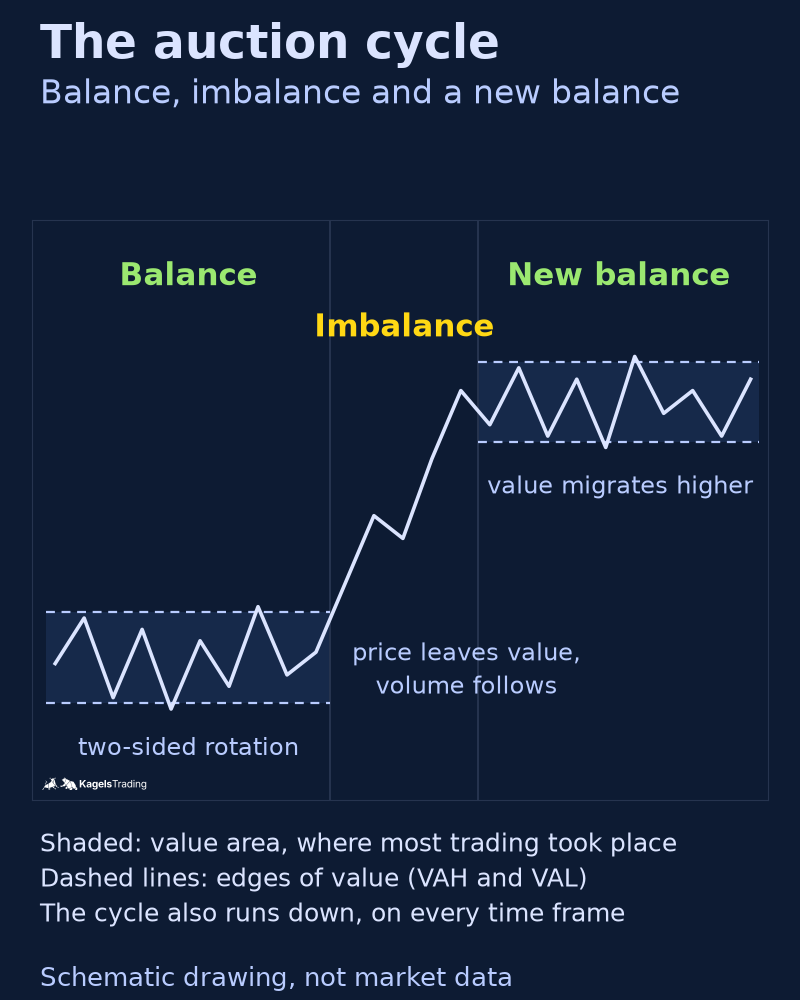 Click to enlarge
Source: Drawing by Kagels Trading.
The transition from balance to imbalance usually needs a reason that changes what traders think is fair. That can be news, an economic release, an earnings report or a central bank decision. Inside the range the move often starts as a test of the edge. If the market accepts prices outside, the balance is over. If it rejects them, price falls back into the range, and a failed breakout often runs to the other side.
The same cycle appears on every time frame, which is why traders stack profiles. A single day can be in balance inside a week that is trending. A composite profile over several weeks shows the larger balance area, a daily profile the current session. Most mistakes come from trading a balance pattern while the higher time frame is in imbalance, or the other way round.
Balance and imbalance ask for different trades. In balance, fading the edges toward the middle has the market’s habit on its side, and targets are modest. In imbalance, fading is fighting the move, and trend-following entries with wider targets fit better. Our guides to range trading and breakout trading cover both sides in detail.
Value area and point of control
The value area is the price range that holds a set share of the period’s activity, normally 70 percent, and the point of control (POC) is the single price with the most activity.
Seventy percent is a convention from the early Market Profile work, not a law of the market. It is close to one standard deviation of a normal distribution, which covers about 68 percent. TradingView uses 70 as the default in both its TPO indicator and its volume profiles. The figure is a convention only: real value areas are rarely symmetric around the POC. The upper edge is the value area high (VAH), the lower edge the value area low (VAL).
There are two ways to measure activity, and they do not always give the same levels. The original Market Profile counts time: each 30-minute period that trades at a price adds a letter, a TPO. The volume profile counts traded contracts or shares at each price. The TPO version works where there is no central volume, for example in spot forex. The volume version shows where the size actually traded. Our guide to the volume profile explains the volume method, the settings and a test of 1,450 SPY daily profiles.
Inside a profile, a few shapes carry most of the information. A long, narrow tail at an extreme is a rejection. Single prints, levels away from the profile’s extremes with only one TPO block, mark a fast move where the market spent little time. A profile with its POC near the middle is a picture of balance, while a profile with most activity at one end shows where the market found its business after a move.
Initiative and responsive activity
In Dalton’s framework, initiative activity is buying within or above the previous day’s value area or selling within or below it; responsive activity is buying below that value area or selling above it.
The idea is that the location of a trade tells you something about the trader’s intention. A buyer who pays yesterday’s value or more is read as someone who believes value is moving higher. A buyer who waits until price drops below value is read as reacting to a bargain. Both buy, but the usual interpretation is that they bet on different things.
| Activity | Where it happens (previous day’s value area) | Usual interpretation |
|---|---|---|
| Initiative buying | within or above | value moves higher |
| Initiative selling | within or below | value moves lower |
| Responsive buying | below | price returns to value |
| Responsive selling | above | price returns to value |
In balance, responsive trades dominate; in a trend, initiative trades do. When initiative buying gets follow-through and the next day’s value area forms higher, the market has accepted the move. When responsive sellers push price back into the old range, the initiative failed. This table is a reading of location, not a measurement of who traded. No public data feed identifies the intention behind an order.
How the open relates to value
Where a session opens relative to the prior day’s value area is the first clue to the day’s auction. An open inside value says the market still accepts yesterday’s prices, and rotation inside the range is the default. An open outside value says something changed overnight, and the first hour has to show whether the new prices are accepted.
After an open outside value, there are two outcomes to watch. Either price holds outside and builds volume there, which is acceptance and often leads to a trend day, or it trades back into the old value area, which suggests the overnight move was rejected. In my volume profile measurement, an open above value alone did not predict the close: the day closed above its open in 52.3 percent of such days, against 53.6 percent on all days.
Many Market Profile traders also watch the initial balance, usually the range of the first hour. A narrow initial balance leaves room for range extension later in the day. A wide one often means the main move has already happened. TradingView lets you set the number of TPO blocks that form it, so check the setting before you compare levels.
The 80% rule: what it says and what my SPY test shows
The popular 80% rule says that if the market opens outside the prior value area and then trades back inside it for two 30-minute periods, it has an 80 percent chance of crossing the whole value area to the other side. It is one of the most quoted rules in the Market Profile world, and a typical search question on the topic. Dalton’s own value-area rule in Mind Over Markets ties the move to acceptance inside the prior value and to the market’s context; the fixed 80 percent is the shorthand traders built on it. The wording also varies: some versions demand two consecutive periods, others only two.
I tested the popular version on six years of SPY data with an approximate volume profile. I used the same 5-minute bars of the regular session as in the volume profile test (Twelve Data). For each day I spread every bar’s volume evenly across its high to low range, in rows of about 0.02 percent of the prior close, and grew the value area from the POC toward a 70 percent target. That is an estimate, not trade-level volume at price and not a copy of TradingView.
The test counts only complete days and a fixed trigger. Both sessions of a pair had to have all 78 bars; 12 pairs with faulty bars in the data (a close outside the bar’s high and low) were left out, which leaves 1,412 pairs. The trigger was the first two consecutive 30-minute periods from 9:30 a.m. ET that each touched or overlapped the value area, even if they closed outside it, ending by 3:30 p.m. The target was the opposite edge, counted from the next 5-minute bar until the close.
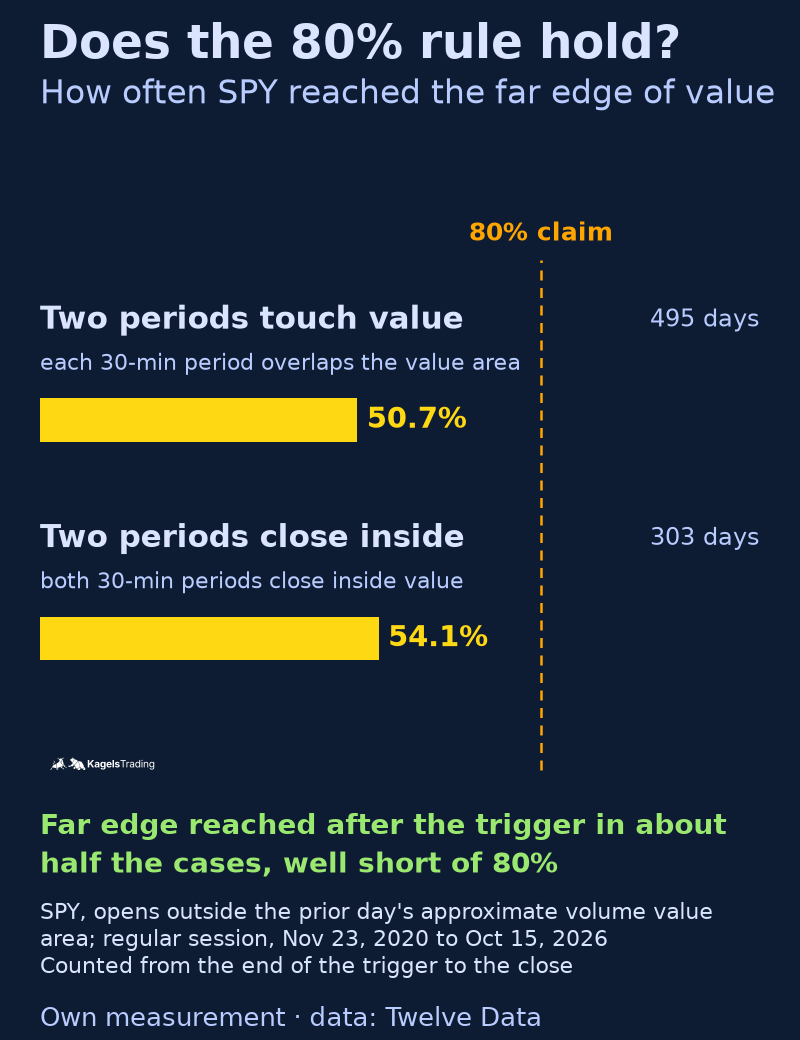 Click to enlarge
Source: Kagels Trading, own measurement.
After the trigger, price reached the far edge in 50.7 percent of 495 days. With a stricter trigger, two periods that closed inside value, it was 54.1 percent of 303 days. On 118 of the 495 days the far edge had already been reached before or during the trigger, and they stayed in the sample: a hit counted only if price reached the far edge again after the trigger. For context only: over the whole session, all opens outside value reached the far edge in 30.8 percent of 943 days, and all days that touched the value area at some point in 49.2 percent of 589 days.
These numbers describe hit rates, not a trading result. The context figures cover a different time window, so they do not isolate what the 30-minute trigger adds. And a hit rate near 50 percent says nothing about profit without an entry, a stop and the size of win and loss. What the test does show is that the far edge was reached far less often than 80 percent in this sample.
The test has limits, and they matter. It uses an approximate volume value area, and its results need not transfer to TPO profiles or other value-area calculations. It covers one market, the SPY ETF, not the E-mini futures, and only the regular session. It ignores costs and slippage, and six years are one sample of one market’s auction.
My conclusion: treat the 80% rule as a description of what can happen, not as a probability. If price returns into value after an open outside, the old value area is in play again and the far edge is a sensible target. Whether the trade is worth taking depends on the higher time frame, the reaction at the edge and your risk, not on a fixed 80 percent that my data did not show.
Auction market theory and order flow
Auction market theory tells you where to look; order flow shows you what happens when price gets there. AMT works with value areas, POCs and balance edges built over hours or days. Order flow reads the individual trades and the order book at one of those levels in real time.
The two fit together through the question of acceptance and rejection. At the edge of value, a footprint chart can show whether aggressive buyers keep lifting the offer and price makes progress, which supports acceptance, or whether heavy buying meets passive sellers and price does not move, which is absorption and points to rejection. Our guide to order flow trading explains the tools and the patterns in detail, with a worked E-mini example.
You do not need expensive software to start with AMT, but order flow needs real exchange data. TradingView’s volume footprint is an entry point, but it estimates the buy and sell split from intrabar data. Dedicated tools such as Bookmap for the order book heatmap or Deepcharts for footprint and delta profiles work with live exchange data feeds, and US futures data comes with exchange fees.
How to use auction market theory in your trading
AMT gives you a routine of questions before each session rather than a single signal. These five steps structure a preparation with it, as a frame for the levels you already trade:
- Find the larger state. Mark the composite value area of the last few weeks. Is the market rotating inside it or trading away from it?
- Mark the prior day. Note yesterday’s value area high, low and point of control, plus any tails and single prints.
- Read the open. Inside value means rotation is the default. Outside value means the first hour has to show acceptance or rejection.
- Wait for the reaction at a level. An edge of value is a place to watch, not an entry. Use price action or order flow to see whether the edge holds or breaks.
- Fit the trade to the state. In balance, fade the edges toward the POC or the other edge with a stop beyond the tail. In imbalance, trade with the move and let the target reach the next area of old value.
Every one of these trades needs a stop and a position size before the entry. A value area edge can break at any time, and news can turn balance into imbalance within minutes. Our guides to risk management and the risk-reward ratio show how to size and place the stop so that one wrong read does not hurt the account.
Strengths and limits of auction market theory
The strength of AMT is that it explains market behaviour instead of predicting it. It gives you a vocabulary for what you see on the chart, works on every time frame, and turns a vague range into concrete levels with a reason behind them. It also connects naturally to volume profile and order flow, so you can add tools step by step.
Its main limit is that the same picture allows different readings. Whether a move outside value is acceptance or the start of a rejection is often clear only afterwards. Popular rules such as the 80% rule are quoted with precise probabilities that my test did not confirm. And in markets without central volume, such as spot forex, you have to rely on time instead of volume.
AMT also says nothing about who is trading. Terms like “institutions defending a level” are interpretations of location and size. The data shows that trades happened at a price, not why. Keep your reading on what the profile and the tape can actually prove.
Books on auction market theory
Three books cover most of what traders mean by auction market theory, and all three come from its originators. I list them without affiliate links; check the current edition before you buy.
- Steidlmayer on Markets: Trading with Market Profile by J. Peter Steidlmayer and Steven B. Hawkins, second edition, Wiley, January 2003. The originator’s own explanation of the profile, extended to stocks.
- Mind Over Markets: Power Trading with Market Generated Information by James F. Dalton, Eric T. Jones and Robert B. Dalton. Wiley published the updated edition in 2013; Dalton’s preface dates the original publication to 1990. It is the standard text on value, day types and initiative and responsive activity.
- Markets in Profile: Profiting from the Auction Process by James F. Dalton, Robert B. Dalton and Eric T. Jones, Wiley, 2007. It connects the Market Profile with behavioural finance and longer time frames.
If you read only one, start with Mind Over Markets. It explains the auction process step by step, and the updated edition adds a comparison of TPO and volume profiles. For a wider list of titles, see our guide to trading books.
Conclusion: a map of the auction, not a forecast
Auction market theory is a useful way to read what the market is doing, not a promise of what it will do next. It separates price from value, balance from imbalance, and initiative from responsive trading. That gives every level on your chart a reason and every session a set of questions.
Use it as context, and check its rules before you trust them. In my SPY test, the far edge was reached after the 80% rule trigger in about half the cases, not in 80 percent. The value of AMT lies in the framework, combined with a clear setup, a stop and a position size you can live with.
Frequently asked questions about auction market theory
What is auction market theory in simple terms?
Auction market theory says that markets move to find a price where buyers and sellers keep trading. When price rises, it looks for sellers; when it falls, it looks for buyers. Where trading happens for a long time, the market has found value.
Who created auction market theory?
The ideas go back to J. Peter Steidlmayer, who developed the Market Profile at the Chicago Board of Trade in the 1980s. The CBOT released the Market Profile to the public in 1985. James Dalton and his co-authors later turned it into the trading framework now called auction market theory.
What is the difference between balance and imbalance?
In balance, the market rotates inside a value area because both sides agree on value. In imbalance, one side is more urgent, and price leaves value until a new agreement forms at another level.
What is the 80% rule in Market Profile?
The 80% rule says that after an open outside the prior value area and two 30-minute periods back inside, price will cross to the other side of value 80 percent of the time. In my test of SPY from 2020 to 2026 with an approximate volume value area, price reached the far edge after the trigger in 50.7 percent of 495 days.
How does auction market theory relate to order flow?
AMT shows you where the important levels are; order flow shows what happens when price reaches them. At an edge of value, a footprint chart or the order book can show whether aggressive orders make progress, which supports acceptance, or meet absorption, which points to rejection.
Does auction market theory work in forex and crypto?
The concepts work in any market, but the data differs. Spot forex has no central exchange volume, so a TPO profile based on time is the more honest choice there. For crypto, a volume profile shows the volume of a single exchange or data source, not of the whole market.
Is auction market theory the same as volume profile?
No, auction market theory is the way of thinking, and the volume profile is one tool to measure it. The original tool was the Market Profile, which measures time at each price. The volume profile measures traded volume; both give a point of control and a value area.
This article is market education, not investment advice. The SPY test is a hypothetical evaluation of past data before costs and says nothing certain about future results.
More Order Flow & Volume Analysis guides
- Read order flow
Order Flow Trading: What the Data Shows and What It Hides
Market and limit orders, DOM, tape, footprint and profile, three patterns, a worked ES example with a failure, and the limits of the data.
- Read volume by price
Volume Profile: POC, Value Area and a Test of 1,450 Days
POC, value area and volume nodes, the six TradingView profiles, and what 1,450 SPY daily profiles say about the popular rules.
- Choose an order book tool
Bookmap Review 2026: Pricing, Data Costs and Who It Suits
What the Bookmap heatmap shows, the four packages, why US market data costs extra and how it compares with ATAS.