
Grid Trading: How It Works and Why Trends Hurt It


Contents
- Grid trading in 30 seconds
- What is grid trading?
- How does a grid work in practice?
- The main grid variants
- How to set the grid parameters
- Is grid trading profitable?
- The five biggest risks of grid trading
- Pros and cons of grid trading
- Grid bots: what to check
- Conclusion: a tool for one market phase
- Frequently asked questions about grid trading
- About the author
Grid trading places a ladder of buy and sell orders above and below the price and earns a little every time the market swings back and forth. You do not need to predict the direction, only movement. That makes it popular for automated trading, especially in markets that trade around the clock. The catch is just as simple: when the market keeps moving in one direction, the grid keeps buying into the loss.
This guide explains the mechanics, the variants and the math, without recommending any platform. We show a worked example, what two independent analyses found and how to size a grid so that a trend cannot ruin you. It is education, not investment advice. How we research is on our editorial policy page.
Grid trading in 30 seconds
- What it is: a set of limit orders at fixed price steps. When price falls, the grid buys; when it rises one step, it sells.
- What it needs: volatility inside a range, not a trend.
- The math: a research paper found an expected return of essentially zero for the classic grid, but only under simple assumptions: equal odds of up and down moves, no fees, and a sale below the grid.
- The main risk: a trend without pullbacks fills every buy level and leaves a large open loss, often called inventory risk.
- The hidden trap: many statistics count only closed trades, which are mostly winners, while the losers stay open.
What is grid trading?
Grid trading is a rule-based strategy that places buy and sell orders at fixed price intervals above and below a reference price. Every move through a level triggers an order automatically. The trader does not choose an entry; the market chooses which orders it touches.
The grid is the set of all these orders placed in advance. Buy orders sit below the reference price, sell orders above it. Each time a buy fills, the system places a sell one step higher. Each completed buy and sell earns the distance between two levels, minus fees.
Grids run best where markets trade around the clock. That is why they are most common in currencies and crypto. On a stock exchange, the grid stands still overnight, and a gap at the next open can jump over several levels at once.
How does a grid work in practice?
A worked example makes the mechanics clear. Assume an asset trades at $100. You place a buy order of $1,000 at each of ten levels, $2 apart, from $98 down to $80. Each filled buy gets a sell order one level higher.
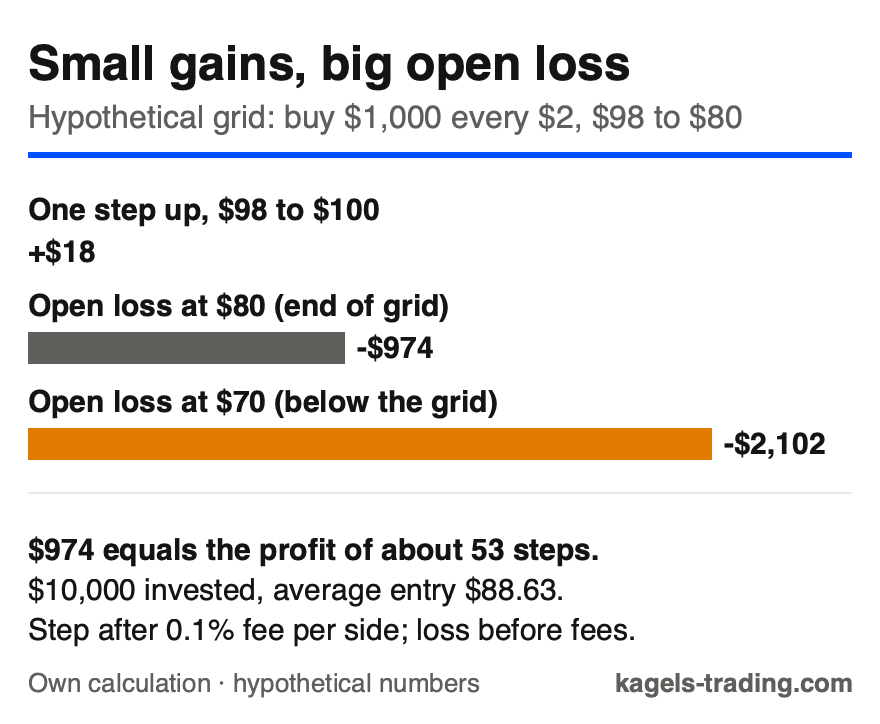
In a range, the grid earns small, steady gains. If price swings between $96 and $100, the buys at $98 and $96 fill and sell again one step higher. One step from $98 to $100 earns about $18 after a 0.1 percent fee on each side. That is the profit grid trading is sold on.
In a falling market, the picture turns. If price drops to $80 without a meaningful bounce, all ten buys fill. You hold $10,000 worth of the asset bought at an average price of $88.63, now worth $9,026. The open loss is $974, the profit of about 53 completed steps. If price falls to $70, below the grid, the open loss grows to $2,102, and the grid has no rule that sells.
 Click to enlarge
Source: Kagels Trading, own example; grid mechanics as described by Quantpedia.
The upper edge has a problem too. If price rises above the top of the grid, every position is sold and the grid stops. It earns nothing while the market keeps running. A grid fits only a range that matches the market’s volatility.
The main grid variants
Grids differ in one question: how do they handle a view on direction? The choice decides whether the grid fits the current market phase and how much inventory it builds up when that phase ends.
Symmetrical grid: equal spacing and equal order sizes above and below the price. It bets only on swings, not on direction, and works best in sideways markets. In a lasting trend, losing positions build up on one side. Our range trading guide covers the market phase this variant needs.
Asymmetrical grid: more orders on one side, for example more buys below the price if you expect a rise. It combines a directional view with grid mechanics. If the view is wrong, the imbalance makes the loss larger.
Trend grid: an indicator decides the direction, for example only buy levels while a 50-day average is above the 200-day average. It works in clear trends but gets reset again and again in sideways markets, when the indicator keeps flipping. More on such filters is in our guide to moving averages.
Mean reversion grid: larger orders where the price is furthest from its average. It needs an asset that really tends to return to its mean. In a structural downtrend, the assumption is wrong and the grid keeps buying the decline.
Martingale grid: doubles the order size after each loss so that one winner recovers everything. This needs unlimited capital. In a lasting trend, the account runs out before the reversal comes; it is not suitable for private traders.
Anti-martingale grid: raises the order size after gains and cuts it after losses. That matches basic risk management, but it also slows the recovery after a losing phase.
How to set the grid parameters
Four settings decide the result: the upper and lower limit, the spacing, the number of levels and the size of each order. Every grid tool asks for exactly these, and most fill them with a default that few traders check.
The spacing must beat the fees
This is the one rule you can calculate before you start. A completed cycle is a buy and a sell, so the fee is charged twice. If the spacing is smaller than the round-trip cost, the grid loses from the first trade. Spreads and slippage come on top, as our guides to the bid-ask spread and slippage explain.
| Fee per side | Cost per buy and sell | Spacing for about 0.1% net |
|---|---|---|
| 0.05% | 0.10% | 0.20% |
| 0.10% | 0.20% | 0.30% |
| 0.20% | 0.40% | 0.50% |
Approximate minimum spacing per grid step so that about 0.1 percent remains after fees; exact values are slightly higher (0.2001, 0.3003 and 0.5010 percent). Spread and slippage not included. Own calculation.
Derive the spacing from volatility
A fixed percentage rarely fits. In its grid primer, Quantpedia set the spacing at 10 percent of the previous day’s volatility with ten levels on each side, and closed each position one and a half grid steps from the entry. A market that moved 0.4 percent yesterday never fills a grid with 3 percent spacing; a market that moves 5 percent a day triggers a 0.2 percent grid hundreds of times. The ATR indicator gives you the volatility figure.
Capital and an exit below the grid
Calculate the capital before the start, not when price sits at the bottom. It equals the number of buy levels times the order size: ten levels of $1,000 tie up $10,000 exactly when the market is weakest. That is also when adding more money feels most tempting.
Put a stop below the lower limit. Without a stop, the classic grid has no rule for losing sales, so losses can keep growing below the grid; in an unleveraged grid they can eat up most of the invested capital. Quantpedia lists a stop-loss price below the lowest level as one of the most common additions. Work out the loss at that stop in dollars before you start, and size the grid with our position sizing guide so that it fits your risk budget.
- Range: derive it from the price history of recent weeks, not from a feeling.
- Spacing: at least twice the round-trip fee, better three times.
- Levels: fewer levels with clean spacing beat many levels eaten by fees.
- Order size: all buy levels together must stay within your risk budget.
- Stop: below the lower limit, with the loss calculated in advance.
Is grid trading profitable?
The short answer: under certain conditions yes, and a simple model says no edge on average. One analysis is a mathematical model with a crypto backtest; the other is a short forex test that shows when a grid wins and when it loses.
The National Taiwan University study
Three researchers showed that the classic grid has an expected return of essentially zero under three simple assumptions: price moves up or down one step with equal probability, no fees, and everything is sold when price falls below the grid. Kai-Yuan Chen, Kai-Hsin Chen and Jyh-Shing Roger Jang published their paper Dynamic Grid Trading Strategy on arXiv in June 2025. It is a preprint, not a peer-reviewed journal article. In that model, the small gains of the swings and the losses of the open positions cancel out. Real markets can deviate from these assumptions in both directions, and real fees push the result below zero.
Their dynamic version did much better in the test, with an important caveat. The dynamic grid resets its levels whenever the market leaves the old range. On minute data of Bitcoin and Ethereum from January 2021 to July 2024, with a 0.08 percent fee, its annualized return stayed positive and reached up to 60 to 70 percent. The authors write that this was largely due to the strong rise in crypto prices in those years. For Ethereum, the maximum drawdown was about 50 percent while the market fell about 80 percent.
That is a backtest on two assets in one period, not a forecast. Most ready-made grid tools use the static grid, for which the paper’s model finds zero expectation under its assumptions.
The Quantpedia EUR/USD test
The second analysis comes from forex. In December 2021, Quantpedia tested a simple intraday grid on EUR/USD with one-minute data in two periods of seven trading days. From January 21 to February 2, 2021, the price swung within the days and the grid made money. From February 2 to 11, the price trended within the days, and the same settings produced several losing days in a row.
The key lesson is about reporting. A grid closes mostly winning trades during the day, while the losers stay open. Quantpedia contrasts mark-to-market reporting, which values the account every minute, with closed-trades reporting, which shows a smooth rising line that drops in one jump when everything is closed. Many bot statistics and advertising screenshots show the second kind.
The five biggest risks of grid trading
Grid trading is often sold as low risk. That is a dangerous simplification. These five points explain why accounts with a running grid can lose far more than the small gains suggest, especially when a trend starts.
1. Trend persistence: a move without a pullback works the grid all the way down. In our example, a fall from $100 to $80 left a $974 open loss, about 53 steps of profit, without a single realized loss. The drawdown sits entirely in open positions, which makes it easy to ignore.
2. Inventory risk and tied-up capital: after a strong trend, most of the money is stuck in positions that are below their cost. Getting out means taking the loss; waiting can take months. The opportunity cost never shows up in a grid statistic.
3. Risk grows as prices fall: Quantpedia calls grid trading a textbook example of a martingale strategy, because the risk grows with the loss. In the classic grid, each order stays the same size, but the sum of open positions grows level by level, the opposite of sound money management.
4. Fees add up: an active grid produces hundreds of executions a month. With 200 buys and 200 sells of $100 each and a 0.1 percent fee per side, the fees reach $40. If you make the grid tighter, the number of trades rises faster than the profit per trade.
5. Market timing: the grid avoids a forecast of direction, but it needs a forecast of the market phase. A grid started at the beginning of a trend is wrong from the first minute, and nobody recognizes the phase reliably in advance. One strong trend can erase months of grid gains.
Leverage makes every risk larger. A futures grid trades futures contracts instead of the asset itself. Futures use leverage, so a small move against you is a large share of your margin, and the position can be liquidated before the market comes back. A grid that buys the asset itself can at least hold it. If you are new, avoid leverage in a grid entirely.
Pros and cons of grid trading
Pros
- No direction forecast: profits from swings in both directions.
- Runs around the clock: in 24-hour markets, an automated grid keeps working at night.
- Strong in ranges: earns when trend followers struggle.
- Fixed rules: orders are set in advance, which removes emotional decisions.
Cons
- No edge in the simple model: the study’s model finds zero expectation for the classic grid before fees, under its assumptions.
- Fails in trends: a one-way move leaves large open losses.
- Ties up capital: every buy level needs money, plus a buffer.
- Flattering statistics: closed-trade reports hide the open losses.
Grid bots: what to check
A grid bot is a program that places, fills and replaces the grid orders automatically. It makes no decisions of its own; it follows the parameters you set. Our guide to trading bots explains how to judge any bot and why a good backtest is not a promise.
Check the costs in two places. Some platforms build grids into their trading screens and earn on the trading fee; external tools charge a subscription on top. With hundreds of executions a month, the trading fee is usually the larger cost.
Protect your account access. An external bot needs an API key to your trading account. Never allow withdrawals for that key, only trading, and restrict it to a fixed IP address if possible. Check whether the platform is licensed where you live before you deposit anything.
If you can code, you do not need a subscription. The grid logic is short: calculate the levels, place the orders, replace each filled order with its opposite. Our guide to building a Python trading bot shows how to start.
Be wary of systems with a grid signature. Many trading systems sold as “AI” are grids without a stop at their core. A smooth closed-trade curve with a deep hidden drawdown is the typical sign.
Conclusion: a tool for one market phase
Grid trading is a tool for sideways markets, not a strategy for all seasons. In the study’s simple model, the classic static grid has no edge before fees, and fees turn that into a loss. If you still want to use it, get three things right.
First, the market and the phase. Pick liquid markets with tight spreads that move within a range, and switch the grid off or change the variant when a trend starts. Second, the costs: calculate the spacing against the round-trip fee before you start. Third, the downside: size the grid and its stop so that a full run to the bottom is a loss you can accept. Test every setting in a backtest or a demo account first, then with very small amounts.
Frequently asked questions about grid trading
What is grid trading in simple terms?
You place buy orders below the price and sell orders above it at fixed steps. When price falls, the grid buys; when it rises one step, it sells. Each completed step earns the spacing minus fees.
Is grid trading profitable?
Not reliably; it depends on the market phase and the costs. A study from National Taiwan University found an expected return of essentially zero for the classic grid under simple assumptions: equal odds of up and down moves, no fees and a sale below the grid. Grids can earn in ranges with steady swings and lose in trends.
Which markets suit grid trading?
Liquid markets that trade around the clock and move within a range. Major currency pairs and large crypto assets are the usual candidates. Stocks are less suitable, because the grid stands still overnight and gaps jump over levels.
What is the difference between a spot grid and a futures grid?
A spot grid buys the asset itself; a futures grid trades futures contracts. A spot position can be held as long as you want, and the loss is limited to the price decline. Futures use leverage, so a futures grid can be liquidated before the market comes back.
How do I set the grid spacing?
The spacing must be larger than the fee for a buy and a sell together. At 0.1 percent per side, one cycle costs 0.2 percent, so the spacing should be at least 0.3 percent. Derive the range itself from recent volatility, not from a fixed percentage.
Can I trade a grid manually?
Possible, but rarely practical. You would have to replace every filled order at once and watch the grid all day. That routine work is the reason grid trading almost always runs automated.
This English edition is based on our German edition on kagels-trading.de and has been adapted for international readers.
More Algo Trading guides
- Get started
Algo Trading: How It Works, Platforms and Risks
What algo trading is, the six stages of a trading system, platforms and languages, risks and US rules.
- Choose an API broker
Alpaca Trading Review 2026: API Broker Tested
Alpaca tested with paper-trading orders: fees, data plans, the API and AI connector, regulation and fines.
- Compare an options API broker
Tradier Review 2026: Pricing, API and MCP Server
Tradier from its own documents: the three plans, the API and sandbox, the MCP server for AI assistants and two fines.
- Code your first bot
Python Trading Bot: Step-by-Step SMA200 Backtest
A four-block SMA200 backtest in Python on the Nasdaq 100, with honest results and the path to paper trading.
- Pick a trading bot
Trading Bots: How They Work, Costs and Risks
Six common bot approaches, provider desk research, costs with billing basis, legal checks and what to verify before you connect an account.
- Understand the speed race
High-Frequency Trading: Strategies, Risks and Rules
How HFT firms make money, what the Flash Crash and Knight Capital taught, where spoofing starts and the rules in the US and Europe.
- Check QuantConnect
QuantConnect Review 2026: Pricing, LEAN and Who It Suits
The LEAN engine and cloud platform: tier prices checked 8 November 2026, what the free plan leaves out, and who it suits.