
Options Strategies: How to Choose, With Payoffs and Risks


Contents
- Options strategies in 30 seconds
- What is an options strategy?
- How to choose an options strategy: four questions
- The example: one option chain for every strategy
- All 19 strategies compared
- Buying options: long call and long put
- Stock and cash: covered call, cash-secured put, protective put and collar
- Straddles and strangles: trading the size of the move
- Vertical spreads: debit and credit
- Iron condor, iron butterfly and butterfly: trading a range
- Implied volatility: why the price matters before expiry
- Assignment and expiry: when the maximum loss stops applying
- Options approval: what it limits and what it does not
- Costs and taxes
- Conclusion: choose the structure after you choose the risk
- Frequently asked questions about options strategies
- Sources
- About the author
No options strategy is best in every market: the right one depends on what you expect and what you can afford to lose. You can use options to trade a rise, a fall, a quiet range or a large move in either direction, and to protect shares you own. This guide compares 19 strategies with one set of made-up prices, so you can see the maximum gain, maximum loss and break-even of each side by side.
Every strategy here gets the same six facts: market view, setup, maximum gain, maximum loss, break-even and main risk. If calls, puts, strikes and premiums are new to you, start with our guide to options trading for beginners. This guide is about US listed options and is a map for choosing, so the popular strategies get a clear overview here rather than full depth.
Risk warning: options carry a high level of risk and are not suitable for all investors. This guide is education, not investment or tax advice. All examples are hypothetical. Premiums and break-evens are per share. Dollar results are per complete strategy position, using standard 100-share option contracts and the quantities shown, at expiry and before fees, unless stated otherwise.
Options strategies in 30 seconds
- Start with your view: Up, down, quiet or a big move. The view narrows the choice before you compare any numbers.
- Check the worst case first: Some strategies have a fixed maximum loss. A short call without shares has no upper limit.
- Read the units: Quotes and break-evens are per share. Results are for the complete position, so a net $3.40 a share means $340.
- At expiry only: Maximum gain and loss describe expiry. Before that, the position moves with price, time and implied volatility.
- Assignment can break the numbers: A sold option can leave you with shares and a risk the payoff chart does not show.
- Approval limits what you may trade: It does not limit what you can lose.
- No proof of a winner: We found no primary source showing that one strategy beats the others after costs.
What is an options strategy?
An options strategy is a planned position of one or more options, sometimes combined with shares, built to fit a market view or a hedging goal.
The legs together decide the risk. A leg is one part of the position, such as one bought call. The OCC defines a spread as being the buyer and writer of the same type of option on the same underlying, and a straddle as buying or writing a put and a call with the same strike and expiry. Writing means selling an option to open a position.
Traders often split strategies into defined and undefined risk. With defined risk, the maximum loss at expiry is known when you enter. With undefined risk, it is not: a sold call has no upper limit. “Defined” is not the same as small, because a covered call can lose nearly the full value of the shares.
How to read the figures in this guide
All dollar results in this guide use the same four rules unless a sentence says otherwise. They make the strategies comparable, but real trades can differ on every point, especially when positions are closed early or assigned.
- Premiums and break-evens per share: A premium of $3.00 means $3.00 for each share, and a break-even is a stock price.
- Results per complete position: Each result covers the whole strategy with the quantities shown, using standard contracts of 100 shares. An iron condor is four contracts, and a covered call includes 100 shares.
- At expiry: We assume the position stays open until expiry and settles at the stock’s final price.
- Before fees: Commissions, regulatory fees, the gap between bid and ask, margin interest, dividends and taxes are left out.
How to choose an options strategy: four questions
Four questions narrow the list quickly, and the first one is your market view. The chooser below starts there. It matches a view with a structure, but it does not tell you whether that view is right or whether the trade suits you.
What do you expect until expiry?
- A sharp rise, with no cap on the gainLong call
- A moderate rise, and a capped gain is acceptableBull call spread
- Flat or rising, and you want a credit up frontBull put spread
- A sharp fallLong put
- A moderate fall, and a capped gain is acceptableBear put spread
- Flat or falling, and you want a credit up frontBear call spread
- A large move, direction unknownLong straddle
- A quiet range until expiryIron condor
- You own shares and would sell them at a higher priceCovered call
- You own shares and fear a dropProtective put
- You want to buy shares at a lower priceCash-secured put
One example for each view, not a recommendation. Each section shows the alternatives and the main risk.
Then ask three more questions before you look at any quote. The answers often rule out more strategies than the market view does. Our guide to position sizing shows how to turn the maximum loss into a trade size.
- What is the most you can lose? If you cannot state a figure, the position is too large or too complex.
- Are you willing to own or deliver the shares? Any sold stock option can be assigned, and the shares can cost far more than the premium.
- Does your account allow it? Your approval level and your cash decide which strategies are open to you.
A higher maximum gain does not make a strategy better. In a fairly priced market, a large possible gain for a small possible loss tends to come with a lower chance of reaching it, and the reverse also holds. The payoff table shows what can happen, not how likely it is. That logic is general and is not a test of any strategy.
The example: one option chain for every strategy
All 19 strategies use the same hypothetical stock, XYZ, trading at $100, with 45 days to expiry. These are round numbers for teaching, not real quotes. They sit close to Black-Scholes model values (35% implied volatility, 4% interest rate, no dividends), and each is within $0.10 of the model value.
| Strike | Call premium, per share | Put premium, per share |
|---|---|---|
| $90 | $1.20 | |
| $95 | $8.00 | $2.50 |
| $100 | $5.10 | $4.60 |
| $105 | $3.00 | |
| $110 | $1.70 |
Real chains are not this tidy. Implied volatility usually differs by strike and expiry, and the prices you can trade at depend on the bid and ask. We calculated every result below with a script that checks all stock prices from $0 to $600 in one-cent steps, then compares the maximum gain, maximum loss and break-even with the formulas. The numbers will change on a real stock, but the structure of each payoff will not.
All 19 strategies compared
This table is the short version of the whole guide: results per complete position as set up below, at expiry and before fees. Positions use standard 100-share contracts, and break-evens are stock prices. A figure “at $0” means the stock falls to zero. “No limit” means no upper limit as the stock rises.
| Strategy | Max gain / max loss | Break-even |
|---|---|---|
| Long call | No limit / $300 | $108.00 |
| Long put | $9,250 at $0 / $250 | $92.50 |
| Covered call | $800 / $9,700 at $0 | $97.00 |
| Cash-secured put | $250 / $9,250 at $0 | $92.50 |
| Protective put | No limit / $750 | $102.50 |
| Collar | $550 / $450 | $99.50 |
| Long straddle | No limit / $970 | $90.30, $109.70 |
| Long strangle | No limit / $550 | $89.50, $110.50 |
| Short straddle | $970 / No limit | $90.30, $109.70 |
| Short strangle | $550 / No limit | $89.50, $110.50 |
| Bull call spread | $660 / $340 | $103.40 |
| Bear put spread | $660 / $340 | $96.60 |
| Bull put spread | $130 / $370 | $93.70 |
| Bear call spread | $130 / $370 | $106.30 |
| Iron condor | $260 / $240 | $92.40, $107.60 |
| Reverse iron condor | $240 / $260 | $92.40, $107.60 |
| Iron butterfly | $680 / $320 | $93.20, $106.80 |
| Long call butterfly | $420 / $80 | $95.80, $104.20 |
| Short call butterfly | $80 / $420 | $95.80, $104.20 |
The figures depend on the strikes and premiums you pick. Do not compare a credit spread with a debit spread by these numbers alone, because moving a strike changes gain, loss and break-even together. Calendar spreads, ratio spreads and other structures are left out on purpose: calendars have two expiry dates, so they do not fit a simple at-expiry table.
Buying options: long call and long put
A bought option is the simplest way to limit the loss to a known amount. You pay the premium and can lose all of it, and the OCC warns that this can happen in a relatively short period. The stock has to move far enough and soon enough, because being right after expiry earns nothing.
Long call
A long call profits from a rise above the strike plus the premium. It costs far less than 100 shares, which here would cost $10,000, but it has an end date.
- Market view: Bullish, expecting a sharp rise before expiry.
- Setup: Buy the 105 call at $3.00. You pay $300.
- Maximum gain: No upper limit.
- Maximum loss: $300, at $105 or lower.
- Break-even: $105 plus $3.00, or $108.00.
- Main risk: Time. If the stock stays below $105, you lose the whole premium even if you were right about the company.
Long put
A long put profits from a fall below the strike minus the premium. It lets you take a bearish view without shorting shares, and without the open-ended risk of a short stock position.
- Market view: Bearish, expecting a sharp fall before expiry.
- Setup: Buy the 95 put at $2.50. You pay $250.
- Maximum gain: ($95 minus $2.50) × 100, or $9,250, if the stock falls to $0.
- Maximum loss: $250, at $95 or higher.
- Break-even: $95 minus $2.50, or $92.50.
- Main risk: Time and a stock that does not fall far enough. Below $95 but above $92.50, you still lose part of the premium.
Stock and cash: covered call, cash-secured put, protective put and collar
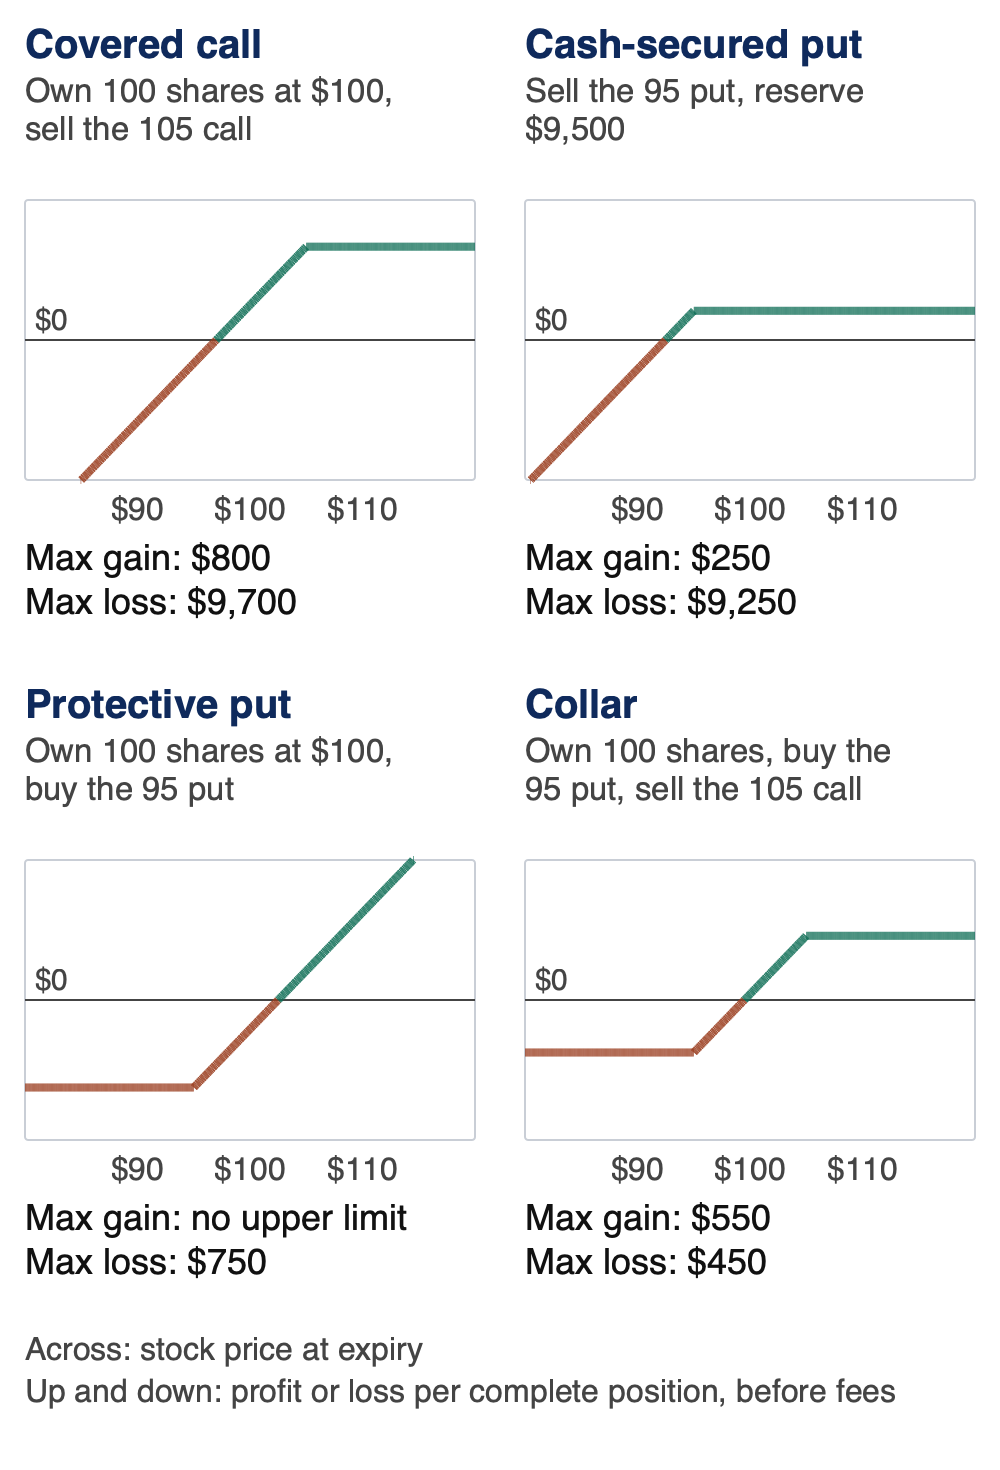
These four strategies are tied to owning shares or being ready to buy them. Two collect a premium and two buy protection, and the collar does both. The results for the stock positions assume you buy the shares at $100, so a different cost basis moves the numbers.
 Click to enlarge
Source: Kagels Trading, own diagram.
Covered call
A covered call trades the gain above the strike for a premium today. The OCC calls you a covered writer when you own the shares a call can demand. It does not reduce the risk of a falling stock by more than the premium.
- Market view: Neutral to moderately bullish, for a steady or slightly rising stock.
- Setup: Own 100 shares at $100 and sell the 105 call at $3.00. You receive $300.
- Maximum gain: ($105 minus $100 plus $3.00) × 100, or $800, at $105 or higher.
- Maximum loss: ($100 minus $3.00) × 100, or $9,700, if the stock falls to $0.
- Break-even: $100 minus $3.00, or $97.00.
- Main risk: A falling stock. You keep nearly all of the downside, give up the gain above $105 and can have your shares called away.
Cash-secured put
A cash-secured put pays you a premium while you wait to buy shares at a lower price. It has the same payoff as any sold put: only the cash set aside differs. That cash limits your borrowing, but it does not limit the loss from a falling stock.
- Market view: Neutral to moderately bullish, with a wish to own the stock at the strike.
- Setup: Sell the 95 put at $2.50, receive $250 and set aside $9,500 to buy the shares.
- Maximum gain: $250, at $95 or higher.
- Maximum loss: ($95 minus $2.50) × 100, or $9,250, if the stock falls to $0.
- Break-even: $95 minus $2.50, or $92.50.
- Main risk: Assignment into a falling stock. You must buy at $95 even if the shares trade far lower, and the OCC calls the risk of writing puts substantial.
Protective put
A protective put works like insurance on shares you own, for a fixed price and a fixed period. The put sets a minimum selling price until expiry, so the worst case is known in advance. The cost is the premium, which you lose if the stock stays above the strike.
- Market view: Bullish over time, but worried about a drop before expiry.
- Setup: Own 100 shares at $100 and buy the 95 put at $2.50. You pay $250.
- Maximum gain: No upper limit.
- Maximum loss: ($100 minus $95 plus $2.50) × 100, or $750, at $95 or lower.
- Break-even: $100 plus $2.50, or $102.50.
- Main risk: Cost. Buying this protection again and again adds up, and it ends at expiry.
Collar
A collar puts shares between a floor and a ceiling for the life of the options. The bought put sets the floor, and the sold call sets the ceiling and helps to pay for it. In this example the call brings in more than the put costs, so you receive a small net credit. It is a hedge for shares you own, not a way to profit from a fall.
- Market view: Neutral to moderately bullish, with concern about a decline.
- Setup: Own 100 shares at $100, buy the 95 put at $2.50 and sell the 105 call at $3.00. You receive $50 net.
- Maximum gain: ($105 minus $100 plus $0.50) × 100, or $550, at $105 or higher.
- Maximum loss: ($100 minus $95 minus $0.50) × 100, or $450, at $95 or lower.
- Break-even: $100 minus $0.50, or $99.50.
- Main risk: Assignment of the short call. You can lose the shares and the rest of a rally, especially just before an ex-dividend date.
Straddles and strangles: trading the size of the move
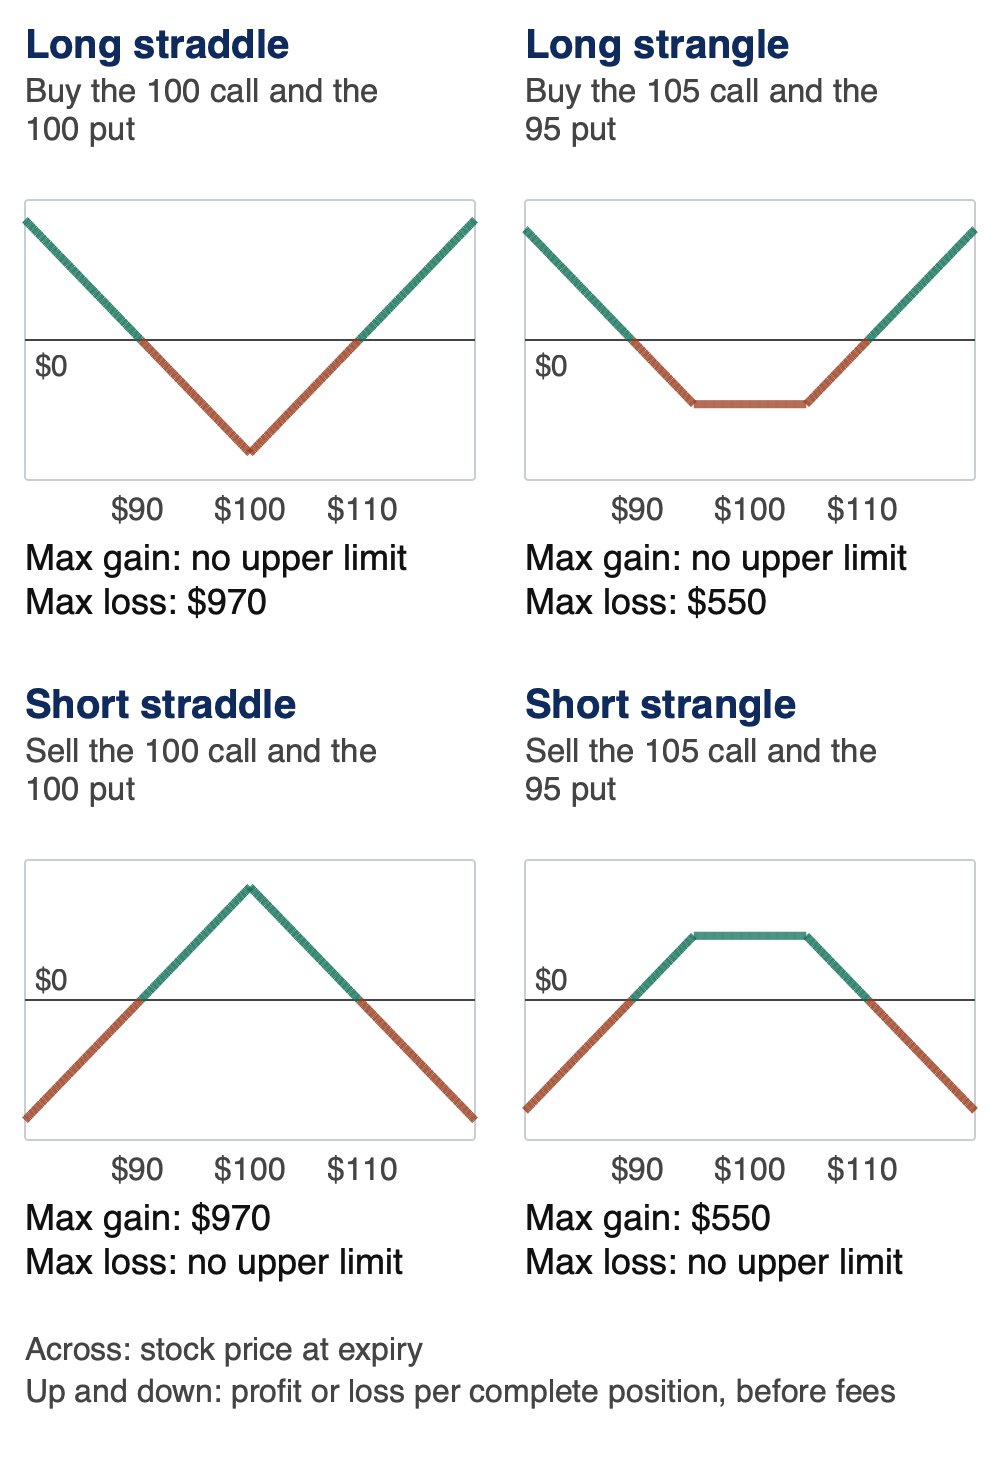
A straddle and a strangle both combine a call and a put with the same expiry, but they use different strikes. A straddle uses the same strike for both options. A strangle uses two different strikes, normally both out of the money, so it costs less but needs a larger move. Buying either one is a bet on a big move, and selling either one is a bet against it.
 Click to enlarge
Source: Kagels Trading, own diagram.
Long straddle
A long straddle profits when the stock moves far enough in either direction. It is often considered before events such as earnings, but those expected moves are usually part of the price already. Each side has to pay for both premiums.
- Market view: A large move, direction unknown.
- Setup: Buy the 100 call at $5.10 and the 100 put at $4.60. You pay $970.
- Maximum gain: No upper limit on a rise. On a fall, ($100 minus $9.70) × 100, or $9,030, if the stock reaches $0.
- Maximum loss: $970, with the stock at exactly $100.
- Break-even: $90.30 and $109.70.
- Main risk: A quiet stock and falling implied volatility. Before expiry, both can hurt the position at the same time.
Long strangle
A long strangle is the cheaper version of the same idea, with a wider range to overcome. You pay $420 less than for the straddle, but the stock now needs to move past $110.50 or $89.50, not $109.70 or $90.30.
- Market view: A large move, direction unknown.
- Setup: Buy the 105 call at $3.00 and the 95 put at $2.50. You pay $550.
- Maximum gain: No upper limit on a rise. On a fall, ($95 minus $5.50) × 100, or $8,950, if the stock reaches $0.
- Maximum loss: $550, anywhere from $95 to $105.
- Break-even: $89.50 and $110.50.
- Main risk: Both options can expire worthless if the stock stays between the strikes.
Short straddle
A short straddle collects two premiums and gives up all protection. The most you can make is the credit, and only if the stock ends exactly at the strike. The Options Industry Council (OIC), the education arm of the OCC, sums up the position as limited rewards for unlimited risk.
- Market view: A steady stock and falling implied volatility.
- Setup: Sell the 100 call at $5.10 and the 100 put at $4.60. You receive $970.
- Maximum gain: $970, with the stock at exactly $100.
- Maximum loss: No upper limit on a rise. On a fall, $9,030 if the stock reaches $0.
- Break-even: $90.30 and $109.70.
- Main risk: A sharp move or gap. You can be assigned on the call, the put, both or neither, and margin calls can come at a bad time.
Short strangle
A short strangle gives the stock more room, but it collects less and keeps the same open-ended risk. It keeps the full $550 anywhere between the two strikes. It is an uncovered position on both sides, so it is no place for a beginner to start, and Fidelity, for example, puts uncovered options in its highest tier.
- Market view: A steady stock and falling implied volatility.
- Setup: Sell the 105 call at $3.00 and the 95 put at $2.50. You receive $550.
- Maximum gain: $550, anywhere from $95 to $105.
- Maximum loss: No upper limit on a rise. On a fall, $8,950 if the stock reaches $0.
- Break-even: $89.50 and $110.50.
- Main risk: Small gains can be wiped out by one large move. The call side has no upper limit on the loss.
Vertical spreads: debit and credit
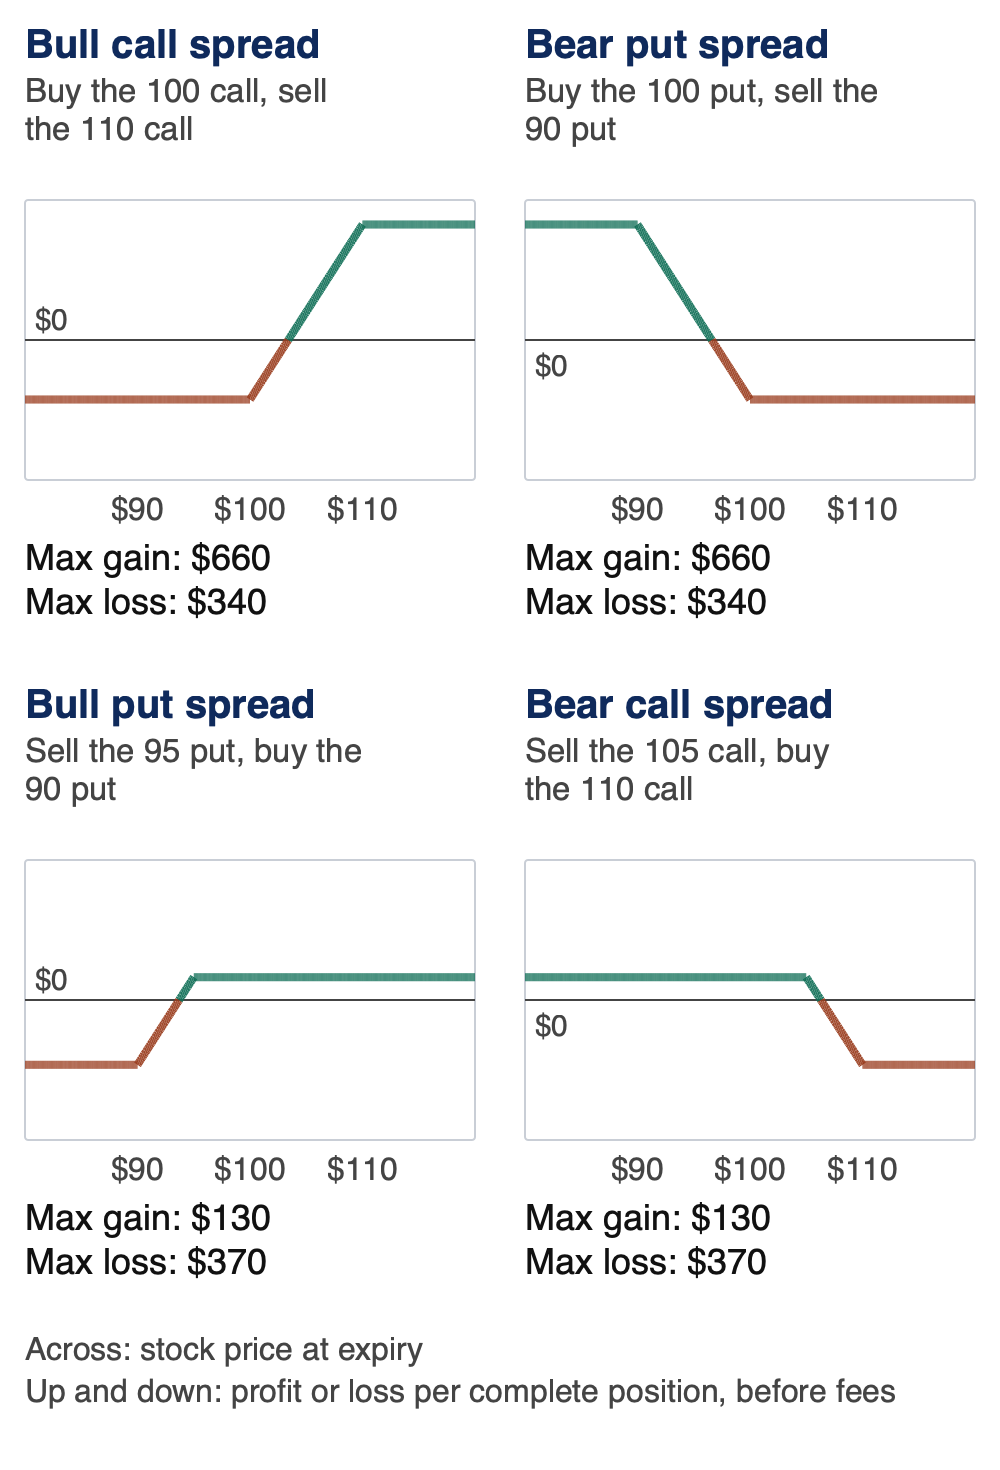
A vertical spread buys one option and sells another of the same type and expiry at a different strike. You pay a net amount for a debit spread and receive one for a credit spread. Either way, the maximum gain and maximum loss at expiry are set by the distance between the strikes and the net premium.
Debit and credit spreads express a similar view in different ways. A debit spread needs a move in your direction to make its full gain. A credit spread with strikes away from the current price can earn its full credit without any move, but it risks more than it can earn in our example. Neither version is better by construction.
A spread limits the loss only if the bought option protects the sold one. The OCC warns that a spread may not offset the risk of a short leg, for example if the long call has a higher strike or an earlier expiry. FINRA’s margin rule for spreads requires that the short option expires on or before the long option. See the section on assignment risk for the case where one leg ends up alone.
 Click to enlarge
Source: Kagels Trading, own diagram.
Bull call spread
A bull call spread lowers the cost of a call by giving up the gain above the higher strike. The sold 110 call pays for part of the bought 100 call, so this position costs $340 instead of $510 for the call alone. That is a debit spread for a moderate rise.
- Market view: Moderately bullish.
- Setup: Buy the 100 call at $5.10 and sell the 110 call at $1.70. You pay $3.40 per share, or $340.
- Maximum gain: ($110 minus $100 minus $3.40) × 100, or $660, at $110 or higher.
- Maximum loss: $340, at $100 or lower.
- Break-even: $100 plus $3.40, or $103.40.
- Main risk: The stock does not rise enough before expiry. Near $110 at expiry, you also face assignment uncertainty on the short call.
Bear put spread
A bear put spread lowers the cost of a put by giving up the gain below the lower strike. It is the mirror image of the bull call spread: you pay $340 and can make at most $660. It can also be a cheaper hedge than a single put, if protection down to the lower strike is enough.
- Market view: Moderately bearish.
- Setup: Buy the 100 put at $4.60 and sell the 90 put at $1.20. You pay $3.40 per share, or $340.
- Maximum gain: ($100 minus $90 minus $3.40) × 100, or $660, at $90 or lower.
- Maximum loss: $340, at $100 or higher.
- Break-even: $100 minus $3.40, or $96.60.
- Main risk: The stock does not fall enough before expiry. Near $90 at expiry, you also face assignment uncertainty on the short put.
Bull put spread
A bull put spread earns a credit if the stock stays above the sold put. The stock may rise, stay flat or even fall a little. The bought 90 put limits the loss, which a single sold put would not.
- Market view: Neutral to bullish.
- Setup: Sell the 95 put at $2.50 and buy the 90 put at $1.20. You receive $1.30 per share, or $130.
- Maximum gain: $130, at $95 or higher.
- Maximum loss: ($95 minus $90 minus $1.30) × 100, or $370, at $90 or lower.
- Break-even: $95 minus $1.30, or $93.70.
- Main risk: A fall through both strikes. The maximum loss is nearly three times the maximum gain here, and the short put can be assigned early.
Bear call spread
A bear call spread earns a credit if the stock stays below the sold call. The stock may fall, stay flat or even rise a little. The bought 110 call turns the open-ended risk of a sold call into a fixed maximum loss at expiry.
- Market view: Neutral to bearish.
- Setup: Sell the 105 call at $3.00 and buy the 110 call at $1.70. You receive $1.30 per share, or $130.
- Maximum gain: $130, at $105 or lower.
- Maximum loss: ($110 minus $105 minus $1.30) × 100, or $370, at $110 or higher.
- Break-even: $105 plus $1.30, or $106.30.
- Main risk: A rise through both strikes, and assignment on the short call, most often just before an ex-dividend date.
Iron condor, iron butterfly and butterfly: trading a range
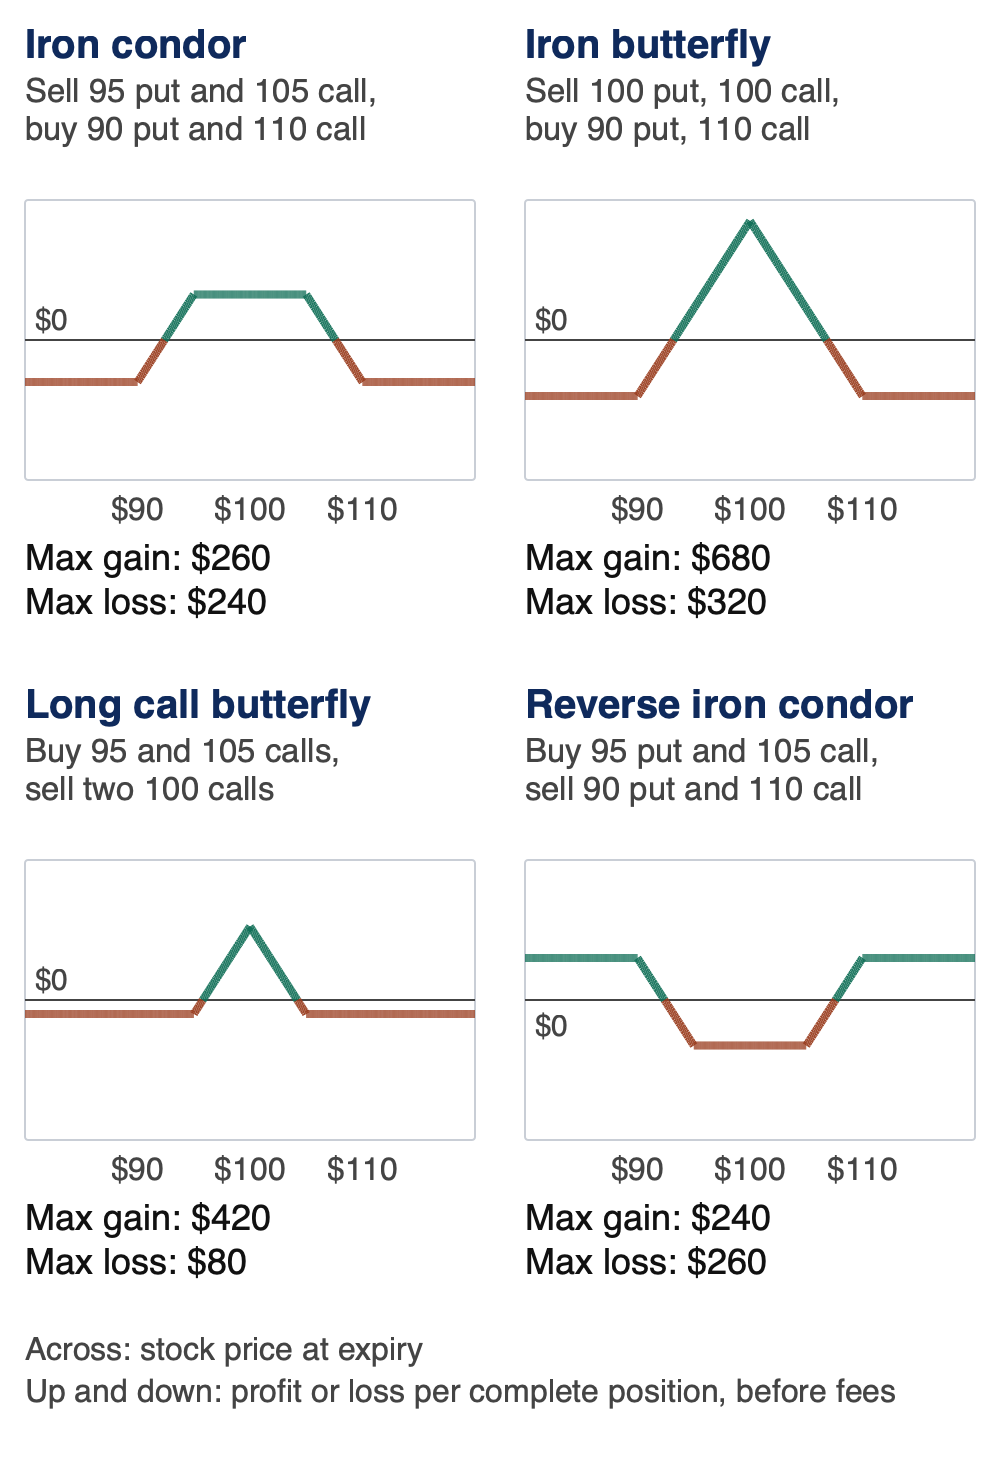
These positions earn the most if the stock ends near a chosen price or within a chosen range. They combine spreads into three or four legs, with defined maximum losses at expiry. The extra legs also mean more transaction costs, which the OCC calls especially significant for strategies with multiple purchases and sales.
 Click to enlarge
Source: Kagels Trading, own diagram.
Iron condor
An iron condor combines a bull put spread and a bear call spread on the same stock and expiry. Here it uses the two credit spreads above, which together bring in $260. At expiry the stock can only be on one side, so only one spread can lose. If the two widths differ, the maximum loss comes from the wider one.
- Market view: A quiet stock that stays in a range until expiry.
- Setup: Sell the 95 put at $2.50 and the 105 call at $3.00, and buy the 90 put at $1.20 and the 110 call at $1.70. You receive $2.60 per share, or $260.
- Maximum gain: $260, anywhere from $95 to $105.
- Maximum loss: ($5 width minus $2.60) × 100, or $240, at $90 or lower, or at $110 or higher.
- Break-even: $95 minus $2.60, or $92.40, and $105 plus $2.60, or $107.60.
- Main risk: A breakout in either direction. With the same width, strikes farther away would give a larger range, but a smaller credit and a larger maximum loss.
Reverse iron condor
A reverse iron condor is the same position with every leg flipped, so it profits from a large move. It costs $260 and needs the stock to leave the range, like a strangle with a capped gain. A long strangle or long straddle keeps the gain open if that matters to you.
- Market view: A large move, direction unknown.
- Setup: Buy the 95 put at $2.50 and the 105 call at $3.00, and sell the 90 put at $1.20 and the 110 call at $1.70. You pay $2.60 per share, or $260.
- Maximum gain: $240, at $90 or lower, or at $110 or higher.
- Maximum loss: $260, anywhere from $95 to $105.
- Break-even: $92.40 and $107.60.
- Main risk: The stock stays in the range. You need the whole move before expiry, and the gain is capped.
Iron butterfly
An iron butterfly sells a put and a call at the same strike, which raises the credit and narrows the range. It collects far more than the iron condor here, $680 against $260, but it pays the full amount only with the stock at exactly $100. One of the two short options will nearly always be in the money, so early assignment is more of a concern.
- Market view: The stock ends very close to one price.
- Setup: Sell the 100 put at $4.60 and the 100 call at $5.10, and buy the 90 put at $1.20 and the 110 call at $1.70. You receive $6.80 per share, or $680.
- Maximum gain: $680, with the stock at exactly $100.
- Maximum loss: ($10 width minus $6.80) × 100, or $320, at $90 or lower, or at $110 or higher.
- Break-even: $100 minus $6.80, or $93.20, and $100 plus $6.80, or $106.80.
- Main risk: Assignment and expiry uncertainty. Near $100 at expiry, you cannot be sure which short option will be exercised.
Long call butterfly
A long call butterfly is a low-cost bet that the stock will finish near one price. It uses calls only: buy one at each outer strike and sell two at the middle. It costs just $80 here, but the full gain needs a precise finish, and the OIC describes its expiration risk as extremely high.
- Market view: The stock ends very close to one price.
- Setup: Buy the 95 call at $8.00 and the 105 call at $3.00, and sell two 100 calls at $5.10. You pay $0.80 per share, or $80.
- Maximum gain: ($100 minus $95 minus $0.80) × 100, or $420, with the stock at exactly $100.
- Maximum loss: $80, at $95 or lower, or at $105 or higher.
- Break-even: $95 plus $0.80, or $95.80, and $105 minus $0.80, or $104.20.
- Main risk: The target is narrow, and the short calls in the middle can be assigned.
Short call butterfly
A short call butterfly flips the same position, so it profits if the stock moves away from the middle. It collects $80 and risks $420, and that ratio alone cannot tell you whether the trade is attractive, because that also depends on probability and price. We show it because it is the other half of this payoff.
- Market view: A move away from one price, direction unknown.
- Setup: Sell the 95 call at $8.00 and the 105 call at $3.00, and buy two 100 calls at $5.10. You receive $0.80 per share, or $80.
- Maximum gain: $80, at $95 or lower, or at $105 or higher.
- Maximum loss: $420, with the stock at exactly $100.
- Break-even: $95.80 and $104.20.
- Main risk: A stock that finishes near $100, plus assignment on the two outer short calls.
Implied volatility: why the price matters before expiry
Implied volatility is the amount of future movement that option prices imply, and it changes while you hold a position. It does not appear in the at-expiry figures above, because an expiring option is worth only its intrinsic value. Before expiry, it can make a position gain or lose even if the stock does not move.
As a rule, bought premium likes rising implied volatility, and sold premium dislikes it. The OIC notes that a long straddle is fueled by an increase, while an increase hurts a short strangle and a short iron butterfly. The OIC rates the effect on vertical spreads as slight, which fits a position that holds both a bought and a sold option.
“Buy when volatility is low, sell when it is high” is a common idea, not a proven rule. Volatility can stay low or high for longer than a position lasts, and a high reading can mean that a real event is ahead. We do not give a fixed threshold here, because we have no evidence that any single number works across markets. Our guide to gamma exposure shows how the hedging of market makers can add to or dampen moves.
Assignment and expiry: when the maximum loss stops applying
The maximum loss of a spread holds at expiry only if both legs settle as the payoff assumes. Sold options bring in a risk that a chart cannot show. A standard stock option is American-style, so the OCC says its writer can be assigned at any time until it expires or the position is closed. Once assigned, you can no longer close that short option.
You may also find out late. The OCC warns that notice may arrive one or more days after the assignment. The OIC adds that assignment risk grows as an option goes deeper in the money and expiry approaches, just before the ex-dividend date for short calls, and just after it for short puts.
Worked example: when one spread leg stays alone
A stock that finishes between the two strikes at expiry is a clear case of expiry assignment risk. Take the bear call spread from above, sold for $1.30. XYZ closes on expiry day at $107, between the $105 and $110 strikes. The 105 call is in the money, so you are likely to be assigned. Your 110 call is out of the money, so we assume you give no instruction to exercise it and it expires worthless.
You now hold a position that the bought option no longer protects. You are short 100 shares at $105, and you may only learn this at the next session. If you buy the shares back at $107, your loss is ($107 minus $105 minus $1.30) × 100, or $70. If news lifts the stock to $125 first, your loss is ($125 minus $105 minus $1.30) × 100, or $1,870. That is far above the $370 “maximum” loss.
Expiry evening adds to the uncertainty, especially near a strike. Pin risk is the uncertainty when a stock closes very close to a short strike, because you cannot be sure whether you will be assigned. Holders can decide after the 4:00 p.m. ET close: on a normal expiry day, FINRA rules set 5:30 p.m. ET as the cut-off for customer exercise instructions, and many brokers set an earlier one. Late news can change that decision, even for a stock that closed just out of the money. Our guide to triple witching covers the expiry calendar.
Closing the position before expiry avoids this particular risk. The OIC says the same thing plainly: the only sure way to avoid assignment is to close out the short option. FINRA also warns that a broker can close one leg of a multi-leg position automatically, for example if your account lacks the funds to follow through on an assignment.
Cash-settled index options work differently
Many index options remove the share delivery problem, but they do not remove the market risk. Standard SPX and weekly SPXW options on the S&P 500 are European-style and cash-settled, according to Cboe, so they can only be exercised at expiry and no shares change hands. The multiplier is $100, so one SPX contract at an index level of 6,000 represents $600,000 (our arithmetic). A narrow spread can limit the loss, but an uncovered index option has a very large notional value.
Options approval: what it limits and what it does not
Options approval limits which strategies you may trade, not how much you can lose. Your brokerage firm must approve your account for a specific level of options trading, FINRA says, because some strategies involve substantial risk. A level that allows a strategy is not a sign that the strategy suits you or that its losses are capped. Our guide to US brokerage accounts explains the difference between cash and margin accounts.
The levels differ from broker to broker. The SEC says firms generally offer five levels. Fidelity described three tiers on its FAQ page on November 7, 2026, and it shows how such a ladder works:
| Fidelity tier | Strategies named by Fidelity | From this guide |
|---|---|---|
| Tier 1 | Buying calls and puts, covered calls, cash-covered puts, long straddles and strangles | Long call, long put, covered call, cash-secured put, protective put, long straddle, long strangle |
| Tier 2 | Tier 1, plus spreads of up to 4 legs | Vertical spreads, iron condor, iron butterfly, butterflies |
| Tier 3 | Tier 2, plus uncovered calls and puts and short straddles | Short straddle, short strangle |
The last column is our reading of Fidelity’s list. Fidelity does not name the collar, the condors, the butterflies or the short strangle, so ask your broker about those. Other brokers draw these lines differently.
Spreads usually come with account requirements of their own. Fidelity lists a margin agreement, a Tier 2 options agreement and a $10,000 minimum equity balance for equity and index spreads in non-retirement accounts. Its stated requirement is the debit paid for a debit spread. For a credit spread, it is the lower of the strike difference and the short option’s uncovered requirement: at most $500 for the $5-wide spreads here, against which you have received $130. FINRA Rule 4210 sets the minimum on the short side of a qualifying spread at the lesser of the normal requirement and the maximum potential loss, and firms can ask for more.
Uncovered positions can demand much more. The OCC warns that uncovered writers may have to meet calls for substantial additional margin when the market moves against them. A broker can raise its margin requirement, so you should keep spare cash in reserve. If you cannot meet a call, your broker can close positions at a bad price.
Costs and taxes
Costs matter more as the number of legs grows. Opening and closing one iron condor means eight contract trades. If all eight incur the standard $0.65 per contract Fidelity listed on November 7, 2026, that is $5.20, plus regulatory fees, or 2% of the example’s $260 credit. Fidelity waives the fee on online buy-to-close orders priced at $0.65 or less. Our beginners guide compares fees across brokers.
The gap between bid and ask is often the bigger cost. Suppose each of the four legs is quoted $0.10 wide and you pay half of that gap on every leg, both ways. That is $0.05 × 4 × 100, or $20 to open and $20 to close, which is more than the commissions. Most brokers let you enter a multi-leg order at one net limit price, and it is worth using.
US tax rules can treat these positions differently from single trades. Under IRS Publication 550 (2025), a straddle for tax purposes is any set of offsetting positions, so it is a broader term than the option strategy with the same name. Stock can count if it is actively traded and offset by a position on it, as a protective put or collar may be. A loss on one position is generally deductible only to the extent it exceeds the unrecognized gain on the offsetting position.
Qualified covered calls generally have an exception, with conditions. Publication 550 generally excludes qualified covered calls and the stock from the loss deferral rules if the straddle is not part of a larger one. Among other things, the call must be exchange-traded, granted more than 30 days before expiry and not deep in the money. A special year-end rule can bring the deferral back when a loss falls in one tax year and the related gain in a later one. Options directly on broad-based indexes fall under Section 1256, as our beginners guide explains. Ask a tax professional about your own positions.
Conclusion: choose the structure after you choose the risk
The best question is not which strategy wins, but which risk you can carry if you are wrong. A view picks a family of strategies, and the worst case picks the one you can actually hold. Bought options risk their premium, spreads risk a fixed amount at expiry, and uncovered options can lose far more than they earn.
Work through one strategy by hand before you trade it. Calculate its maximum loss, its break-even and what happens if a short leg is assigned the day before expiry. Our guide to risk management shows how to size a position around that figure. If you want to see what other traders are doing, our guide to options flow explains what large trades can and cannot tell you.
This article is education, not investment or tax advice. Options trading carries a high risk of loss.
Frequently asked questions about options strategies
What is the best options strategy?
There is no best options strategy for every trader and market. The right choice depends on your market view, your maximum affordable loss and your approval level. We found no primary source that shows one strategy beating the others after costs, so treat claims about a “most successful” strategy with caution.
What is the safest options strategy?
No options strategy is safe, but some have a smaller and better-known worst case. A bought option or debit spread can lose the amount you paid, plus fees, as long as the position is not exercised or assigned into shares. A covered call or cash-secured put can look conservative, yet it can lose nearly the full value of the shares: $9,700 and $9,250 in our examples.
Which options strategy is best for beginners?
Start with a position whose full loss you can state and afford. Our beginners guide suggests one small bought call or put as a first trade. A covered call only suits someone who already wants to own the 100 shares. Avoid uncovered selling until you have much more experience.
What is the difference between a straddle and a strangle?
A straddle uses one strike for both options, while a strangle uses two. In our example, the long straddle costs $970 with break-evens at $90.30 and $109.70. The long strangle costs $550 with break-evens at $89.50 and $110.50. It is cheaper, but it needs a larger move.
What is the difference between a debit spread and a credit spread?
You pay to open a debit spread and receive money to open a credit spread. In a debit spread, your maximum loss is the amount paid. In a credit spread, your maximum gain is the amount received, and the maximum loss is the strike width minus the credit, times 100. Both have their numbers fixed only at expiry.
Can you lose more than the maximum loss on a spread?
Yes, if the legs stop working together. If the stock closes between the strikes, you can be assigned on the short leg while the long leg expires, which leaves an unhedged stock position. In our example, that turns a $370 maximum into $1,870 if the stock then jumps to $125. Fees also come on top of the stated maximum.
Do I need a margin account for options spreads?
Often yes, but the rules depend on your broker and account type. Fidelity, for example, requires a margin agreement for spreads in non-retirement accounts and has a separate agreement for retirement accounts, each with a $10,000 minimum equity balance. Check your own broker’s options agreement.
Sources
- OCC: Characteristics and Risks of Standardized Options, June 2024, especially the definitions in Chapter II, Chapter IX on costs and margin, and Chapter X on holders and writers.
- Options Industry Council (OCC), strategy pages: Covered call, cash-secured put, protective put, collar, long straddle, long strangle, short straddle, short strangle, bull call spread, bear put spread, bull put spread, bear call spread, long iron condor, short iron butterfly, long call butterfly.
- Options Industry Council, FAQ: Options assignment, Options exercise.
- FINRA: Options, Rule 2360, including (b)(23), Rule 4210, (f)(2)(A)(xxxii) and (f)(2)(H).
- SEC, Investor.gov: Opening an Options Account.
- Cboe: SPX options fact sheet, SPX options specifications.
- IRS: Publication 550 (2025), Investment Income and Expenses, sections on straddles, including qualified covered calls and the special year-end rule, and section 1256 contracts.
- Broker pages, checked November 7, 2026: Fidelity options FAQ, Fidelity margin FAQ, Fidelity commissions, Fidelity fee schedule.
This US edition is based on our German edition on kagels-trading.de and has been adapted for US readers.
More Options Trading guides
- Learn how options work
Options Trading for Beginners: How Calls and Puts Work
Calls, puts, strike, expiry and premium with a worked example, exercise and assignment, the main risks, US broker approval and a first path.
- Read gamma exposure
Gamma Exposure (GEX): How Dealer Hedging Can Move Prices
What GEX measures, the formula with a worked example, gamma flip, call wall and put wall, data sources with prices, and the limits of the model.
- Read options flow
Options Flow Explained: Sweeps, Blocks and Dark Pool Prints
The OPRA tape, premium, sweeps and blocks, volume against open interest, dark pool prints, a worked example, scanner prices, and what a print cannot tell you.