
Gamma Exposure (GEX): How Dealer Hedging Can Move Prices


Contents
- Gamma exposure in 30 seconds
- What is gamma exposure (GEX)?
- How gamma exposure is calculated
- Positive and negative gamma: why markets are sometimes calm and sometimes wild
- Gamma squeeze: when hedging purchases push the price up
- Gamma flip, call wall and put wall: the three levels on the chart
- Where to get GEX data, and what it costs
- How traders use gamma exposure day to day
- Advantages and limits of gamma exposure
- Conclusion: gamma exposure is a map, not a compass
- Frequently asked questions about gamma exposure
- About the author
If a $200 stock rises by 1%, market makers may need to trade about $800,000 of it to stay hedged. That figure comes from the worked example that the data provider SpotGamma publishes for its own GEX model. Scaled up to a whole index, the same mechanism can help explain why prices sometimes stick to a level and sometimes slide through it without any news.
This article explains what gamma exposure measures, how it is calculated and where the numbers come from. You will learn what the gamma flip, the call wall and the put wall mean, which data sources exist, what they cost, and where the model reaches its limits. This article follows our editorial policy.
Gamma exposure in 30 seconds
- What GEX measures: An estimate of market makers’ total gamma position, which shows how much hedging a price move may call for.
- The dollar formula: Gamma × estimated dealer position × contract size × price² × 0.01. For a $200 stock with a gamma of 0.02 and 1,000 contracts, that is $800,000 per 1% move.
- Positive gamma damps, negative gamma amplifies: In the model, hedging above the gamma flip works like a shock absorber; below it, like an amplifier.
- What it costs: Paid services start at $50 a month (Unusual Whales). SpotGamma charges $99, MenthorQ $129 and Volland $150 for the tiers with GEX levels or charts. Barchart and a public SpotGamma SPX chart are free.
- The biggest weakness: Nobody knows who holds which side of an option. The dealer side is a convention, not a measurement, and official open interest is updated only once a day.
- Gamma squeezes are rarer than headlines suggest: For GameStop in January 2021, SEC staff found no evidence of a gamma squeeze.
What is gamma exposure (GEX)?
Gamma exposure, or GEX, is an estimate of market makers’ total gamma position, which shows how much hedging in the underlying a price move may call for.
Behind it is a chain of three links. First, market makers, the firms that constantly quote buy and sell prices, take the other side of a large share of option trades. Second, they usually limit their price risk, so they hedge in the underlying. Third, the size of that hedge keeps changing, because an option’s delta shifts as the price moves. Our guide to market makers explains how they earn the spread and manage their inventory.
That shift in delta is called gamma. Delta tells you how strongly an option reacts to a price move. Gamma tells you how fast delta itself changes. For a single contract, gamma is a small decimal. Added up over all open contracts of an index, the modeled hedging can reach billions of dollars.
The effect matters most where most options sit: in options on the S&P 500. Cboe’s SPX options are the reference market, and Barchart also lists GEX as gamma levels. Both names mean a map of the price levels where modeled hedging flows are strongest. GEX is not a forecast and not a trading signal; it describes market mechanics.
How gamma exposure is calculated
The common dollar formula comes from option math and is shorter than it looks. SpotGamma, one of the best-known providers of this data, writes it like this, with the result in dollars per 1% move:
Dollar GEX per 1% move = gamma × estimated dealer position × contract size × price² × 0.01
A worked example shows the order of magnitude. Assume a stock trades at $200, the options in question have a gamma of 0.02, dealers are modeled as long gamma in 1,000 contracts, and one contract covers 100 shares, as is standard for US equity options.
| Step | Calculation | Result |
|---|---|---|
| Delta change per $1 | 0.02 × 1,000 × 100 | 2,000 shares |
| A 1% move | 1% of $200 | $2 |
| Delta change per 1% | 2,000 × 2 | 4,000 shares |
| Dollar GEX | 4,000 × $200 | $800,000 |
Source: worked example on SpotGamma’s GEX page, checked on 6 November 2026.
If the price rises by 1%, a fully delta-neutral dealer in this example would sell about $800,000 of stock. If it falls by 1%, the dealer would buy about the same amount. The example is an approximation that holds all other inputs constant, and real dealers do not have to hedge every move. For an index such as the S&P 500, the same effect adds up over tens of thousands of contracts, and the hedging flows can become large enough to affect the price.
One input deserves special attention: the estimated dealer position. Exchanges publish how many contracts are open, but not who is on which side. Public-data models therefore often assume that dealers are long calls and short puts. Long options have positive gamma and short options negative gamma, as the Options Industry Council explains, so that assumption sets the sign. SpotGamma itself calls it a “simplifying inventory convention”, not a rule of option mathematics.
From one strike to the GEX curve: how the zero gamma level is found
A dashboard never shows a single contract, only the sum over all strikes and expiries. For each strike, the calculation runs once for the calls and once for the puts. Under this common convention, calls count as positive and puts as negative. The sum per strike is the GEX profile, the bars you see in almost every tool.
The zero gamma level comes from a what-if calculation. The model sets the price to many hypothetical values above and below the current level. At each of them it recalculates the gamma of all options and adds it up. Where the sum changes sign, that is the gamma flip. SpotGamma describes exactly this method on its GEX page.
This is why two providers rarely publish exactly the same levels. Each decides which expiries to include and how to estimate the dealer side. When you compare two sources, check the unit first: some charts show GEX per $1 move, others per 1% move. The two numbers cannot be compared directly.
Positive and negative gamma: why markets are sometimes calm and sometimes wild
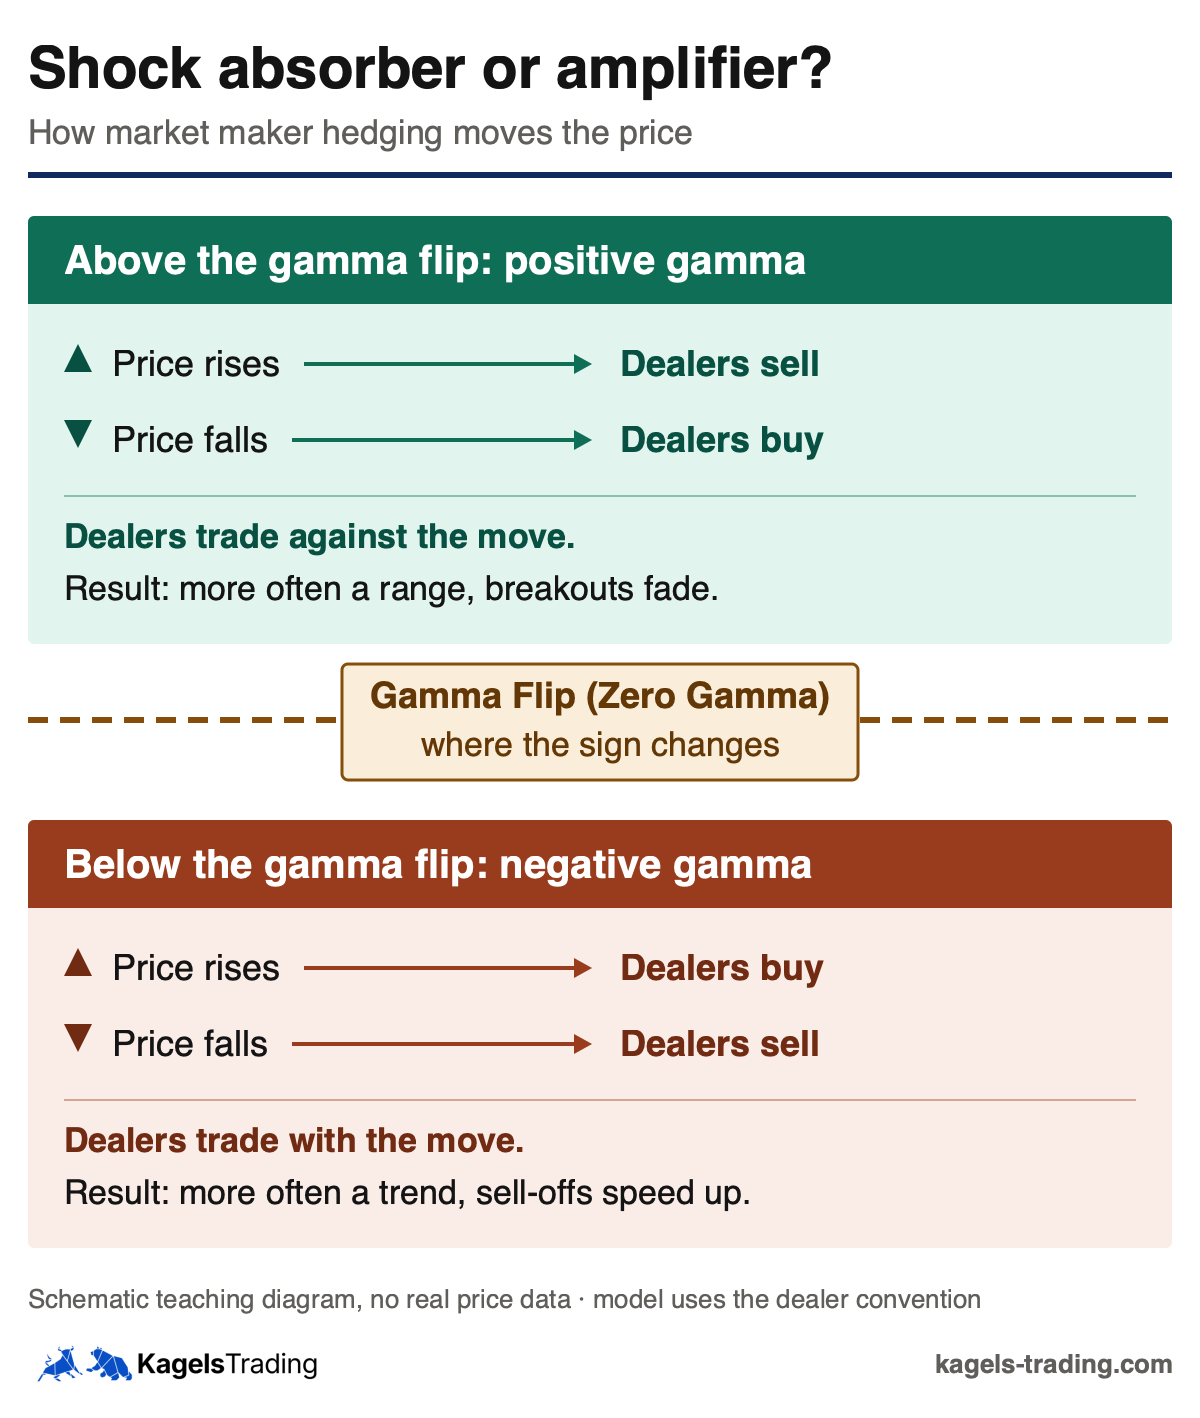
The sign of gamma exposure decides whether hedging damps a move or fuels it. This is the most useful part of the whole concept in practice. The diagram below shows both states, with the gamma flip between them.
 Click to enlarge
Source: Kagels Trading, own diagram based on the dealer convention described by SpotGamma.
Positive gamma: the shock absorber
With positive gamma, delta-neutral dealers trade against the move. When the price rises, they sell stock. When it falls, they buy. Hedging then adds headwind to the move. Possible results are narrow ranges, falling volatility, and days on which the market swings back and forth between two levels.
Negative gamma: the amplifier
With negative gamma, the sign flips and delta-neutral dealers trade with the move. When the price falls, they sell and can deepen the drop. When it rises, they buy. On such days, moves can look out of proportion and sell-offs can speed up instead of fading. The extreme case on the upside is called a gamma squeeze.
The change between the two states is not a switch that clicks. Treat the flip as a zone, because it is a model result. SpotGamma itself notes that different providers can publish different crossovers.
Gamma squeeze: when hedging purchases push the price up
A gamma squeeze is a rally that market makers amplify because they need to buy more and more stock to hedge the calls they have sold.
The chain has four steps. Many traders buy calls, market makers sell them and hedge with stock. If the price rises, the calls’ delta grows, and market makers need to buy more. Those purchases push the price further, and the loop starts again. The effect is strongest for short-dated options near the current price, because their gamma is highest there.
The best-known example does not hold up. The GameStop rally in January 2021 is still cited as the textbook case. SEC staff analyzed the trading data and concluded in their report of 14 October 2021 that they did not find evidence of a gamma squeeze. Options volume from individual customers rose from $58.5 million on 21 January to $2.4 billion on 27 January. But the increase came mostly from buying puts, and market makers were buying calls, not writing them.
For your trading, this means a steep rally with heavy call volume is not yet a gamma squeeze. The explanation only holds if dealers are actually short gamma in those options. A public model can misclassify that, so negative GEX on a dashboard is a clue, not proof. The stock-side counterpart, where short sellers are forced to buy back, is a short squeeze; headlines often mix the two up.
Gamma flip, call wall and put wall: the three levels on the chart
The first time you open a GEX dashboard, you will mainly see three terms. They come from the same positioning data: the gamma flip, the call wall and the put wall.
The gamma flip is the price at which the market’s total gamma exposure changes sign, and the shock absorber becomes an amplifier.
Above this level, the market tends to be calmer; below it, more nervous. Some providers call it zero gamma. It is the only one of the three levels that says something about the character of the market rather than about a specific price target.
The call wall is the strike with the largest concentration of call gamma, and it is a candidate for resistance.
The mechanism depends on who holds those calls. If dealers are long them, as the convention assumes, they sell against a rise near this strike. If they are actually short them, the same hedging would add to the rally. So it is not resistance in the chart-reading sense, but a level that depends on the modeled positions.
The put wall is the strike with the largest concentration of put gamma, and traders often watch it as possible support.
Put-wall support does not come from ordinary hedging on the way down. Under the convention, dealers are short those puts, so as the price falls they would sell more of the underlying, which adds to the move. Buying can appear when put holders close their positions near that strike: dealers then buy back their short hedges. SpotGamma adds that falling implied volatility can lift this buying further. That makes the put wall a possible stopping point, not a floor.
Both walls are only as stable as the positions behind them. After a large expiry, such as triple witching, the expiring contracts drop out, and levels that held for weeks can shift overnight. With 0DTE options, which expire on the day they trade, this can happen every day. According to Cboe, 0DTE contracts made up 59% of SPX options volume in 2025, an average of 2.3 million contracts a day. These are volume figures, not dealers’ net exposure.
Where to get GEX data, and what it costs
You can calculate gamma exposure yourself, because open interest is public. In practice, most traders use ready-made services, because preparing the data per expiry and strike takes work. Prices differ a lot.
| Provider | Price | What you get |
|---|---|---|
| Barchart | free | GEX by strike for indices and US stocks |
| SpotGamma SPX chart | free | public GEX chart for the S&P 500 |
| TradingView scripts | partly free | quality varies widely, check the data source |
| Unusual Whales Retail Basic | from $50 a month | real-time GEX heatmap for all US tickers; the free tier is delayed two trading days |
| SpotGamma Essential | $99 a month | key levels for the major indices, options flow tool, community |
| MenthorQ Premium | $129 a month | gamma levels for stocks and US futures |
| Volland Swing | $150 a month | exposure charts per strike, including vanna |
| SpotGamma Alpha | $299 a month | adds a synthetic open interest view |
Monthly list prices from the providers’ pages on 6 November 2026. Some showed a discount for the first month or for annual billing. SpotGamma’s checkout showed $99 for Essential and $299 for Alpha, with automatic renewal at that amount. Prices in US dollars; check the amount at checkout before you subscribe.
List prices from the providers' pages on 6 November 2026. Barchart and SpotGamma's public SPX chart are free and have no bar.
One technical point limits what these sources can tell you: official open interest is updated only once a day. The Cboe DataShop FAQ describes the industry standard: the previous night’s OCC end-of-day open interest is used at the start of the trading day and stays unchanged until the next morning. Models based only on that figure miss position changes during the day. Their levels can still move intraday, because gamma itself changes with price, time and volatility.
Expensive services try to close that gap with their own real-time estimates of order flow. That is often a bigger difference between the tiers than the number of charts. If you only use GEX as a rough guide, the free sources can be enough. If you want to trade it intraday, you pay for timeliness.
SpotGamma, Unusual Whales, MenthorQ and Volland: how the services differ
SpotGamma is built around the S&P 500. The Essential plan provides key levels for the major US indices that, according to the provider, integrate into common trading platforms. It also includes an options flow tool, analysis for more than 3,500 US stocks and a Discord community.
At Unusual Whales, options flow comes first and GEX is an extra. Retail Basic, the entry dashboard plan at $50 a month, includes a real-time GEX heatmap for all US tickers and SPX market maker exposure with 10-minute updates. Retail Max at $120 a month updates every minute. The free tier shows options flow with a delay of two trading days, so it is only good for a first look.
MenthorQ is the service for futures traders. Besides stocks and indices, it calculates gamma levels for US futures. The levels can be shown in TradingView, NinjaTrader, MetaTrader and other platforms. Premium costs $129 a month, with $59 for the first month; Pro with live trading sessions costs $349.
Volland shows more than gamma. It also calculates vanna, which describes how hedging needs shift when volatility rises or falls, and offers a separate 0DTE dashboard from its $250 tier. Exposure charts start with the Swing plan at $150 a month; according to the pricing page, data covers about 4,500 tickers and updates every two minutes. Plans go up to $5,000 a month for institutions.
All four services share one catch for traders outside the US. They are US companies, bill in US dollars and focus on US underlyings. If you mainly trade European indices, check whether a service covers those options at all before you subscribe. If you trade US indices or US futures, test one month before you commit to a yearly plan.
How traders use gamma exposure day to day
I bought my first shares in 1980, have traded actively since 1986, and today I trade without indicators, using price action and market structure. That is exactly why I find GEX interesting: it is not an indicator calculated from past prices, but an estimate of where in the market hedging orders may come from. It is the same idea that lies behind order flow trading, seen from the options side.
In practice, a simple routine works. Before the trading day, note three numbers: the gamma flip, the call wall and the put wall. Draw these three levels on your chart, just as you would draw the VWAP or the previous day’s high. That is all.
- Above the flip: allow for a range more than a trend. Breakouts may fail more often, and pullbacks may be bought sooner.
- Below the flip: moves can carry further and stops can get hit faster, so consider a smaller position size.
- At the walls: treat them like any other level. Wait for the price to react; do not trade the number.
- After a large expiry: the levels can move once contracts expire, so refresh your levels before you rely on them.
The most common mistake is to read the levels as entry signals. A call wall does not say that the price will turn there. It says that hedging pressure may build if the price gets there and the modeled positions are right. Whether that becomes a reversal only the price action itself will show. If you confuse the two, you trade a number from a model instead of the market in front of you.
Advantages and limits of gamma exposure
Like every model, GEX has two sides. Here are the advantages and the limits, so you know what you are getting into.
Advantages of gamma exposure
- Explains moves without news: when a market speeds up for no visible reason, the sign of gamma can offer a mechanical explanation.
- Fixed levels instead of interpretation: call wall and put wall sit on strikes. Two traders using the same provider read the same number, unlike with hand-drawn lines.
- Says something about the market regime: the position relative to the gamma flip suggests whether a range or a trend is more likely today.
- Basic values cost nothing: for a first impression, the free sources can be enough.
Limits of gamma exposure
- The dealer side is a guess: no exchange publishes who holds which side. The assignment is a convention, and each provider calculates it a little differently.
- Prior-day positions: official open interest comes once a day. Models based only on it miss intraday position changes.
- No statement about direction: GEX says how the market might react, not where it is heading.
- Only for liquid underlyings: for thinly traded stocks there is too little open interest for the calculation to mean anything.
- Ongoing costs for timeliness: the paid plans listed above cost $50 to $299 a month, and institutional plans much more.
Conclusion: gamma exposure is a map, not a compass
I consider GEX one of the few tools that really show something new. It does not average past prices; it estimates where hedging may create pressure to trade. That can help explain days when the price sticks to a level, and days when a small trigger sets off a large move.
The other side is just as clear. The dealer assumption remains an assumption, models based only on official open interest miss intraday changes, and none of the three levels says where the price will go. If you use GEX as context and keep taking your entries from price action, you gain something. If you trade the levels as signals, you only swap one indicator for another.
My advice for getting started: mark the three levels for two weeks without trading them. You will see for yourself how often the market stalls at the call wall and how days below the flip feel. That experience is worth more than any subscription you take out beforehand.
This article is market analysis and education, not investment advice. Options and futures trading carries a high risk of loss.
Frequently asked questions about gamma exposure
What does GEX mean in trading?
GEX stands for gamma exposure and estimates market makers’ total gamma position. The number describes possible hedging pressure, not the direction of the price. In the model, positive GEX damps moves and negative GEX amplifies them.
Where can I find free gamma exposure data?
Barchart shows GEX by strike for the major US indices and many stocks without a subscription. SpotGamma publishes a free GEX chart for the S&P 500, and there are scripts on TradingView. Tools that rely on official open interest use the previous evening’s positions. Our Barchart review explains what its free plan includes.
What is the difference between the gamma flip and the call wall?
The gamma flip is the level where total gamma changes sign, and it describes the character of the market. The call wall is a single strike with especially high call gamma and acts as a candidate for resistance.
Does gamma exposure work outside the US, for example for the DAX?
In principle yes, in practice less well than in the US. Options markets on US indices are many times more liquid, and most providers build their models for the S&P 500 and the Nasdaq. For European underlyings, the data is thinner.
Is gamma exposure a trading signal?
No, GEX describes market mechanics and gives you levels where hedging pressure may build. Whether the price turns there only its reaction will show. On its own, the number is not a sound basis for an entry.
Why do GEX levels change so much after expiration?
At expiration, the contracts that run out disappear, and their gamma with them. Other contracts remain. After a large date such as triple witching, a big part of the positioning can change, so levels that held for weeks can shift. That is why you should refresh your levels after a major expiry.
What is a gamma squeeze?
A gamma squeeze is a rally that market makers amplify because they need to buy more and more stock to hedge the calls they have sold. It requires dealers to be short gamma. For GameStop in January 2021, SEC staff found no evidence of one.
This English edition is based on our German edition on kagels-trading.de and has been adapted for international readers.