
Options Flow Explained: Sweeps, Blocks and Dark Pool Prints


Contents
- Options flow in 30 seconds
- What is options flow?
- Premium: what the dollar figure means
- Bid, ask and the side label: an estimate, not a record
- Sweeps against blocks: two labels, no single definition
- Volume against open interest
- Opening or closing: why the tape often cannot tell
- Unusual options activity: what the filter measures
- Dark pool prints: stock trades, not options
- Worked example: one print, step by step
- What flow can and cannot tell a trader
- Limits and false signals
- How options flow connects with gamma exposure
- Options flow scanners: what to check, and what they cost
- Conclusion: read flow as a question, not an answer
- Frequently asked questions about options flow
- Sources
- About the author
Options flow shows what traded, but not why it traded. A scanner can tell you that 5,000 calls changed hands for $1,000,000 in premium. It cannot tell you whether that was a new bet, a closing trade, a hedge or one leg of a spread. Those four trades can look the same on the tape.
This guide explains where the data comes from and which labels are facts and which are estimates. You will learn how to read premium, sweeps and blocks, volume against open interest and dark pool prints, and you can follow all of it through one worked example. This is about US listed options. Futures order books and footprint charts are a different subject, covered in our guide to order flow trading. If calls and puts are new to you, start with our options trading guide for beginners.
Risk warning: options carry a high level of risk and are not suitable for all investors. This guide is education, not investment advice. The worked example is hypothetical, and no scanner label is a trading signal.
Options flow in 30 seconds
- What it is: A live view of option trades, built by vendors from OPRA, the consolidated US options feed.
- What is recorded: Contract, contracts traded, price, exchange, time and a trade condition. There is no field for buyer, seller, opening or closing in OPRA’s last-sale message.
- What is estimated: “Bullish”, “at the ask”, “smart money” and often “sweep” and “block” come from the vendor’s rules.
- Premium: Price × 100 × contracts for a standard contract. $2.00 × 100 × 5,000 is $1,000,000.
- Open interest: Official figures arrive once a day, so a print cannot be confirmed as opening or closing in real time.
- Dark pool prints: These are off-exchange stock trades reported to FINRA. They are not options trades.
- Cost: The scanner plans we checked start at $29.95 to $85 a month. We have not tested them hands-on.
What is options flow?
Options flow is the stream of executed option trades, usually filtered and labeled by a data vendor so that large or unusual trades stand out.
The raw material comes from OPRA, the Options Price Reporting Authority. OPRA distributes consolidated last-sale and quote information from the US options exchanges, along with volume and open interest messages. On November 6, 2026, its site listed 19 participant exchanges in seven groups, while its committee list also named MIAX Sapphire. The scale is large: OCC reports about 15.26 billion contracts cleared in 2025, including a small number of futures. That is roughly 61 million a day if you assume 250 trading days (our arithmetic).
- ExchangeTrade executesAn exchange matches the buyer and the seller and reports the trade.
- OPRAPrint goes outThe consolidated feed carries the contract, size, price and trade condition.
- ScannerLabels are addedThe vendor calculates premium and adds side, sweep and block labels and its filters.
- OCCNext-day positionsOpen interest is published once a day, after clearing.
Recorded facts end with the second step. Premium is a calculation; the other labels depend on each vendor's rules.
The OPRA message itself is short. According to the OPRA data specification, a last-sale message carries the symbol, expiry, strike, volume, premium price and a trade type code in its header. We found no field for the buyer’s or seller’s identity, for buy or sell, or for opening or closing. So your screen mixes three things: recorded fields such as size and price, calculated values such as premium, and inferred labels such as side, sweep grouping and any claim about intent.
Premium: what the dollar figure means
Premium in a scanner is the total money that changed hands for the trade, not the size of the position. The quote is per share and a standard US stock option covers 100 shares, so the formula is price × 100 × contracts. Options adjusted after a corporate action can have a different deliverable, so check the contract.
A large premium is not a large bet in one direction. The same $1,000,000 is money paid by the buyer and received by the seller. A buyer’s maximum loss on a bought option is the premium, while a seller can lose much more. If the print is part of a spread, the net amount at risk can be far smaller than the figure on the screen. Scanners that sort by premium show you the biggest cash transfers, and these are not always the strongest opinions.
Bid, ask and the side label: an estimate, not a record
Scanners call a trade “at the ask” or “at the bid” by comparing its price with the quotes at that moment. A trade at the ask is read as buyer-initiated, and a trade at the bid as seller-initiated. Trades between the two are often shown as neutral or “mid”. Each scanner decides this with its own rules.
This method works often but not always. In a 2003 study of Cboe data with known trade direction, Savickas and Wilson found that the quote rule signed about 83% of classifiable trades correctly, the Lee and Ready rule 80%, the EMO rule 77% and the tick rule 59%. Complex index trades outside the retail system were wrong almost half the time. The data is old and markets have changed, so read this as evidence of the error, not as today’s rate.
Even a correct side does not give you a direction. A buyer-initiated call trade means someone was willing to pay the offer. That buyer can be opening a bullish bet or closing a short call. “At the ask” describes how the trade met the quote, not what the trader expects.
Sweeps against blocks: two labels, no single definition
A sweep is an order that takes liquidity across several exchanges at once, while a block is a large trade, often arranged and crossed in one piece. Both words are common in scanners, but each vendor sets its own rules. Check those rules before you trust the label.
What a sweep is, and where the urgency claim comes from
The formal version of a sweep is the Intermarket Sweep Order, or ISO. Under exchange rules such as MIAX Rule 1400, an ISO is a limit order sent along with other ISOs as needed to trade against the full displayed size of better-priced protected quotes on other exchanges. OPRA has a matching trade code, ISOI, for “the execution of an order identified as an Intermarket Sweep Order”.
“Urgent” is an inference from that mechanic, not a recorded fact. Someone who hits several exchanges may want to fill quickly. The same pattern can also come from a broker’s routing logic, or from a hedge that must be filled quickly. In addition, ISOs are not limited to a visible rush across venues: Nasdaq ISE proposed allowing them in its facilitation and solicitation auctions too. A vendor’s “sweep” may also be its own grouping of prints close together in time, with or without that code.
What a block is
No single size makes a trade a block across the options market. On Nasdaq ISE, a 2017 SEC order describes block-size orders as 50 contracts or more and the Solicited Order Mechanism as limited to orders of 500 contracts or more. Scanners pick their own thresholds, often in premium.
Large crossed trades still go through an exchange and reach the tape. The OPRA specification has codes such as SLAN for a single-leg order that traded in an auction and SLCN for one that traded in a crossing mechanism with no exposure period. A crossed block can have a broker, or a firm committing capital, on the other side, so it may carry little information about market direction.
Multi-leg codes: the most useful filter
OPRA flags many spread and stock-tied trades, and you should use that. Its specification has codes such as MLET for an electronic multi-leg order and TLET for a multi-leg stock and options order. If your scanner shows a large call print with such a code, it is one leg of a larger structure, so reading it alone as a bullish bet is a mistake. Our guide to options strategies shows how such spreads are built. Ask whether your vendor shows these codes or links the legs.
Volume against open interest
Volume counts the contracts traded today, while open interest counts the contracts still open. Volume starts at zero each day. Open interest carries over and changes when positions are opened, closed, exercised, assigned or expire. OPRA distributes both, and the Cboe DataShop FAQ explains that the previous night’s OCC end-of-day figure is used at the start of the day and stays unchanged until the next morning.
How a trade changes open interest depends on both sides. The Options Industry Council gives three rules for opening and closing trades, shown here for one contract:
| Buyer | Seller | Open interest |
|---|---|---|
| Opening | Opening | Rises by 1 |
| Opening | Closing | Unchanged |
| Closing | Opening | Unchanged |
| Closing | Closing | Falls by 1 |
Volume above the previous night’s open interest does not prove a net increase in open interest, show which print opened a position, or reveal bullish or bearish intent. The common shortcut says too much. Volume can include positions that were opened and closed again the same day, and trades that move a position from a closing trader to an opening trader. Both add volume but leave open interest unchanged. What the numbers do rule out is that all of that volume was closing on both sides, because not enough positions existed at the start. The next morning’s figure gives the net result of the whole day for that contract, not the result of one print.
Opening or closing: why the tape often cannot tell
The public tape does not say whether a trade opened or closed a position, so a live print cannot settle it. Opening and closing are recorded on the orders and processed through clearing, but the OPRA last-sale message has no field for them. Vendors can only infer the answer from price, size and the next day’s open interest.
Better data exists, but it is not the same tape. Cboe’s Open-Close data splits volume by buy or sell, by opening or closing, and by participant type such as customer, broker-dealer or market maker. It comes as an end-of-day file or as intraday snapshots, and it is a paid product. It also covers only Cboe’s own exchanges, not the whole market, and it shows totals rather than one person’s intent.
Unusual options activity: what the filter measures
Unusual options activity is a filter that lists contracts trading far more than usual, most often measured against open interest or average volume. Barchart describes its report as contracts trading at a higher volume relative to open interest, and its page says this can give insight into what “smart money” is doing. That last part is an interpretation, since the report cannot identify who traded. Other sites use other baselines, so the same contract can be unusual in one tool and normal in another.
Many unusual readings have ordinary explanations. A contract with tiny open interest needs only a small trade to show a high ratio. Traders also roll expiring positions to a later date, build spreads and buy hedges before earnings. Our Barchart review explains which of its reports need the paid plan.
Dark pool prints: stock trades, not options
A dark pool print is a stock trade reported after it was executed off-exchange, and it has nothing to do with the OPRA options tape. Scanners often show the two side by side, which is why the stock and options data get mixed up.
“Dark pool” is a common name, not a defined legal category. SEC Commissioner Stein noted in 2018 that the term is not used or defined in the Exchange Act or SEC rules. Investor.gov describes alternative trading systems as SEC-regulated systems that match buyers and sellers, and dark pools as systems where users place orders without showing size and price to other participants.
The quote is dark, but the completed trade is reported. FINRA explains that listed stock trades on these systems must go to a Trade Reporting Facility (TRF). During normal market hours, FINRA Rule 6380A requires a report as soon as practicable and no later than 10 seconds after execution. Weekly volume for each named system follows after a two- to four-week delay, depending on the stock.
An off-exchange print is not automatically a dark pool print. The TRF also takes trades that firms such as retail wholesalers execute outside any alternative trading system, and FINRA’s OTC data splits ATS and non-ATS volume. According to Cboe, TRF share reached 50.6% of US equity volume in 2025. That figure covers all off-exchange trading. Rosenblatt Securities puts dark pools alone at about 17.7% of the same 2025 volume. An SEC staff paper from 2014 notes that press reports do not always distinguish these categories, and that ATS trading was a minority of off-exchange trading in its sample.
A print shows price and size, but not who bought or why. It may be a real institutional transaction, but the print does not reveal its direction. The “dark pool levels” on some dashboards are vendor calculations. In our view they are worth testing like any other level, not treating as proof of hidden buying.
Worked example: one print, step by step
Take a hypothetical stock, XYZ, trading at $100. A scanner shows 5,000 XYZ 105 calls, 30 days to expiry, at $2.00, at the ask, flagged as a sweep. These numbers are made up to show the method.
First, do the arithmetic. The premium is $2.00 × 100 × 5,000, or $1,000,000. For a buyer holding to expiry, the break-even is $105 plus $2.00, or $107, before fees. That is a 7% rise from $100 within 30 days.
Next, list what could be behind it. The diagram shows four possibilities, and the tape line alone often cannot separate them.
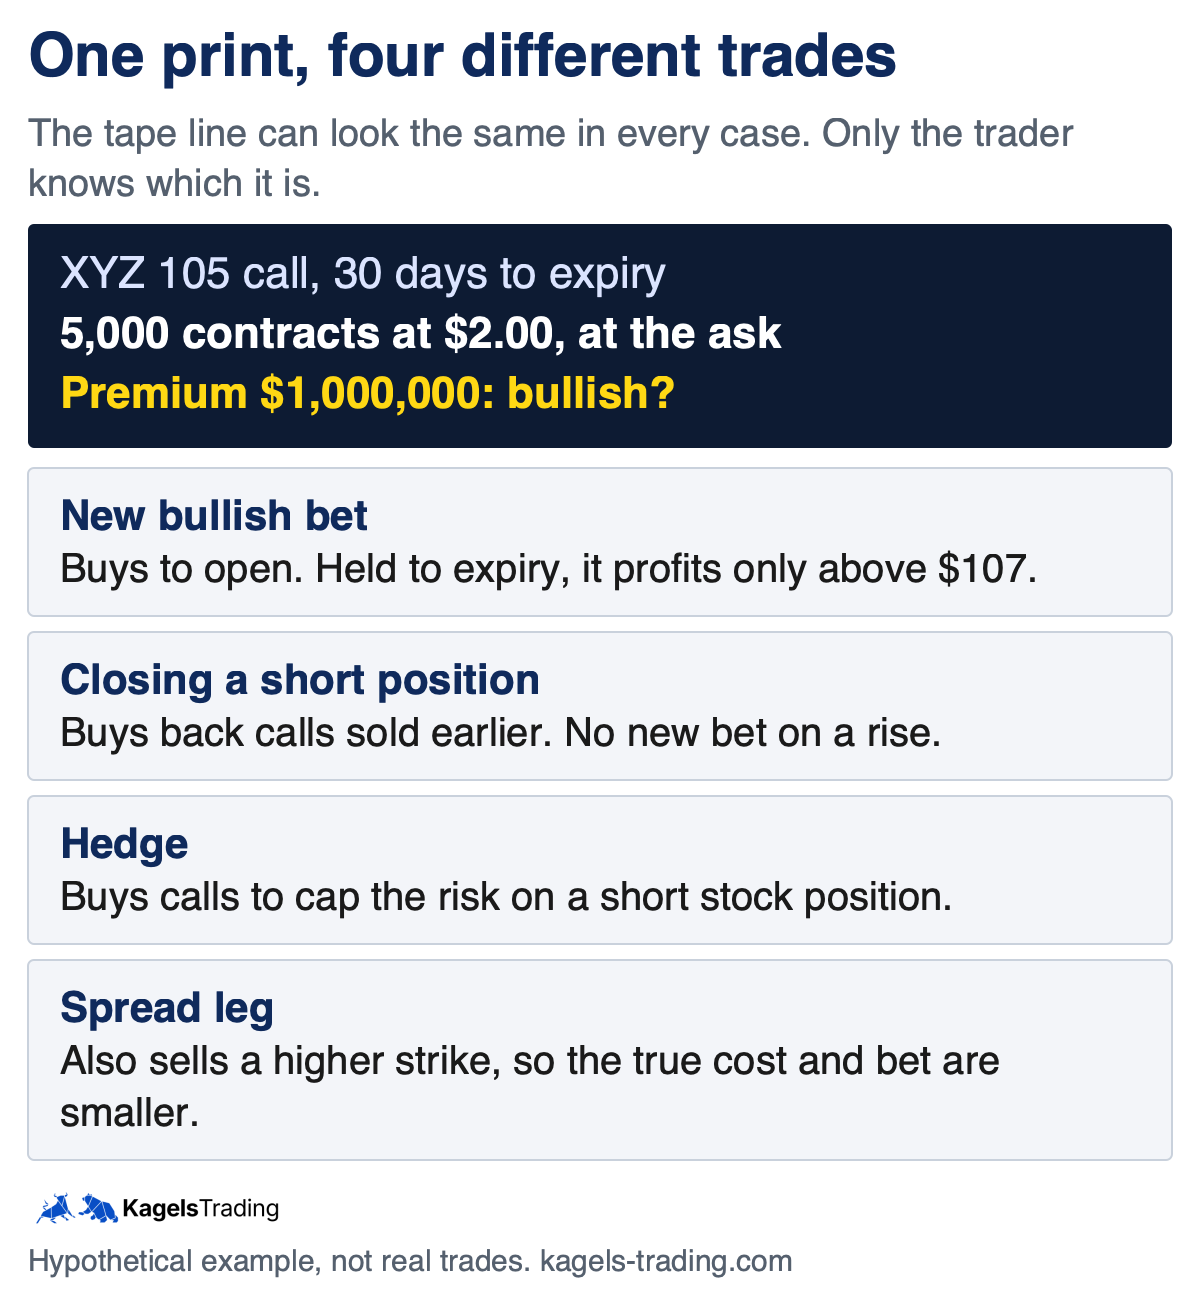 Click to enlarge
Source: Kagels Trading, own diagram.
Then check open interest the next morning. Assume open interest in this contract was 20,000 and that nothing else traded in it that day. Also leave out exercise, assignment and other clearing adjustments. Here are three simplified cases, each treating all 5,000 contracts the same way:
| Who was on each side | Change | Next morning’s open interest |
|---|---|---|
| Both opening | +5,000 | 25,000 |
| One opening, one closing | 0 | 20,000 |
| Both closing | -5,000 | 15,000 |
Real days are messier, because all of that contract’s trades are netted. One print can also mix several participants, so results between these figures are possible. A rise of 5,000 would fit the first case, but other trades could produce the same number. Even a clean rise only says that more positions stayed open. It still does not say whether the buyer is bullish, hedging or trading a spread.
Low open interest does narrow things down. Suppose open interest had been only 1,000 at the start of the day, with the same assumptions. Then no more than 1,000 of the 5,000 contracts could be closing on either side, so at least 4,000 must be opening on each side. That follows from the arithmetic. It still tells you nothing about intent.
A short checklist for any print
- Contract: Which strike and expiry, and how far is the strike from the stock price?
- Size against normal: How does it compare with the open interest and typical volume of that contract?
- Trade code: Is it a multi-leg, a stock-tied leg, a cross or an auction?
- Quote and time: Did it trade near the bid, the ask or the middle, and is earnings or expiry close?
- Next morning: What did open interest do, and did similar trades repeat?
- The chart: Does the stock’s own volume and price action support your reading?
What flow can and cannot tell a trader
Flow is good at showing where attention and money are concentrated. It can point you to a contract, an expiry or a stock you had not looked at. It gives you facts such as size, price, time and trade type. It can also help you notice when trading in a stock changes sharply.
It cannot tell you intent, and we treat any claim to the contrary as unproven. A print does not name the trader, the rest of their portfolio or the reason. Later trades appear on the tape, but you cannot reliably identify which ones close or adjust the original trader’s position, so copying a print means copying half a story without knowing the exit.
Research gives some support, but with a catch that matters. Pan and Poteshman studied Cboe data from 1990 to 2001 and built put-call ratios only from volume that buyers initiated to open positions. Stocks with low ratios beat stocks with high ratios by more than 40 basis points the next day and more than 1% over the next week, on a risk-adjusted basis. They attribute this to nonpublic information held by option traders, not to a market inefficiency that anyone can use.
The tape does not give you their data. In the conference version of the paper, the authors note that the public sees only total volume, and with total volume the effect was less than half as large. They found no evidence of informed trading in index options, and firm proprietary traders’ signals were not informative. These results come from an older period and a much slower market, so they do not show that a modern scanner earns a return after costs.
Limits and false signals
- No trader identity: “Institutional” and “smart money” are guesses based on size. Size alone does not identify the trader.
- Hedges look like bets: a big put purchase may protect a stock portfolio. It need not be a bearish forecast.
- Spreads split up: one leg shown alone can reverse the apparent message of the whole trade.
- Side errors: side labels are estimates, and they are weakest for complex and off-quote trades.
- Short-dated noise: Cboe reports that same-day expiries were 59% of SPX options volume in 2025. Large totals there may have little to do with a view on next month.
- Hindsight: a scanner’s list of “winning” prints looks better than the full list. Ask for every alert, with entry and exit rules and costs. Otherwise you cannot judge it.
- Late or cancelled prints: OPRA has codes for late and cancelled reports, so check that your tool handles them.
How options flow connects with gamma exposure
Flow and gamma exposure look at the same market from two ends. Flow shows individual trades during the day. Gamma exposure estimates dealers’ total position across all contracts, and it needs an assumption about who holds which side.
In the example, the dealer’s hedge is a model too. Assume a market maker sold all 5,000 calls and hedges fully. With our own Black-Scholes estimate, the delta is about 0.33 (33% implied volatility, a 4% rate, no dividends), so the hedge is about 0.33 × 5,000 × 100, or 165,000 shares, worth about $16.5 million at $100. The market maker buys those shares, because a short call loses as the stock rises. If the seller was another customer, or a dealer who offset the risk elsewhere, that hedge may not exist.
Flow can contradict a common GEX assumption. Public GEX models often assume that dealers are long calls. If customers really bought these calls from dealers, dealers are short them, and that part of their gamma is negative instead of positive. This is why some providers build intraday estimates from trades, while official open interest stays fixed until the next morning. Those estimates inherit every side-label problem described above.
Options flow scanners: what to check, and what they cost
Before you pay, ask how the tool makes its labels, because those rules differ more than the recorded trades can. Our checklist covers coverage, labels and open interest:
- Coverage and delay: Is it the full OPRA feed in real time, or is a free tier delayed?
- Side method: How is “at the ask” decided, and what happens to trades between the quotes?
- Sweep and block rules: Which code, size or time window triggers each label?
- Multi-leg handling: Are legs flagged or linked, or shown as separate bets?
- Open interest: Does the tool show the next day’s change next to the print?
- Dark pool data: Is it labeled as stock data, and does it separate ATS trades from other off-exchange trades?
| Plan | Per month | Stated flow and dark pool access |
|---|---|---|
| Barchart Premier | $29.95 | all flow and unusual activity results, custom filters |
| Unusual Whales Retail Basic | $50 | real-time flow; daily options and dark pool download |
| BlackBoxStocks Options Basic | $59 | real-time flow; dark pool from the $79 plan |
| Cheddar Flow Standard | $85 | real-time flow, unusual volume; dark pool from the $99 plan |
Monthly list prices in US dollars, read on the providers’ pages on November 6, 2026. Yearly plans and trials are extra options. Barchart’s first 30 days are free, then billing starts. Cheddar Flow’s Standard plan has a 7-day trial, and Unusual Whales’ free tier delays flow by two trading days. Feature lists are the providers’ own statements. We have not tested these tools hands-on, so this is not a ranking. Check the amount at checkout.
List prices from the providers' pages on November 6, 2026, billed monthly. Plans differ in features, so a lower price does not mean the same product.
Part of the data costs little or nothing. FINRA’s OTC transparency data is public, though delayed, and OCC publishes volume and open interest reports. OPRA’s fee schedule lists $1.25 per month for a nonprofessional subscriber at the lowest vendor volume tier, which the vendor pays. That feed fee is a small part of the plan prices above; we do not know the vendors’ other data costs.
Conclusion: read flow as a question, not an answer
Options flow is useful as a way to find something worth checking. It can show you where money is moving in the options market today, and the recorded facts are hard to get any other way. The labels on top of them are estimates, and intent stays private.
A print should send you to the chart, the calendar and the next morning’s open interest. If those fit together, you have context for your own plan. If you buy a contract only because a scanner flagged it, you take a position without knowing whether the other trader was betting, hedging or leaving.
This article is market analysis and education, not investment advice. Options trading carries a high risk of loss.
Frequently asked questions about options flow
What is options flow in simple terms?
Options flow is the live stream of executed option trades, usually filtered to show the large or unusual ones. The raw data comes from OPRA, the consolidated US feed. A vendor then adds labels such as premium, side and sweep.
Is options flow the same as order flow?
No, the two terms usually refer to different data. Options flow is about executed option contracts. Order flow trading usually means reading the order book and the tape of futures or stocks. The guide linked at the top of this article covers that subject.
What is the difference between a sweep and a block?
A sweep takes liquidity across several exchanges, while a block is one large trade, often arranged in advance. The formal version of a sweep is an Intermarket Sweep Order, which OPRA can flag. There is no market-wide size for a block, so each vendor sets its own rule.
Does volume above open interest mean new positions?
It means some opening trades took place, but not a net increase and not a direction. Volume above the previous night’s open interest cannot all be closing on both sides. But positions can be opened and closed again the same day, or pass from a closing trader to an opening trader, which adds volume without raising open interest. The net change appears only in the next day’s figure, and it says nothing about intent.
Are dark pool prints options trades?
No, they are off-exchange stock trades. They are reported to a FINRA Trade Reporting Facility, and they are separate from the OPRA options feed. Not every off-exchange print comes from a dark pool, because wholesalers report there too.
Can I follow unusual options activity to make money?
No evidence we found shows that copying flagged trades works for retail traders after costs. Research shows some information in signed opening volume, but the public tape does not provide that data. You also do not see the other trader’s hedges or exit. Treat a flag as a reason to research, not as a trade.
Is there a free options flow scanner?
Some sites offer free or limited views, usually delayed or capped. Barchart shows part of its unusual activity report without Premier, and Unusual Whales’ free tier delays flow by two trading days. Check the delay and the limits before you rely on one.
Sources
- OPRA: Overview and participants, data recipient specification, participant specification, version 5.1a, August 25, 2026, fee schedule.
- OCC and Options Industry Council: 2025 annual volume, Open Interest: Why It Matters.
- Cboe: DataShop FAQ, Open-Close data, State of the Options Industry 2025, 2025 US Equities Year in Review.
- FINRA: Can You Swim in a Dark Pool?, Trade Reporting Facility, Rule 6380A, OTC transparency.
- SEC: Investor.gov on ATSs and dark pools, Commissioner Stein’s statement, July 18, 2018, staff paper on non-ATS OTC trading, 2014, SEC order on ISE block mechanisms, 2017, MIAX ISO definition, SR-MIAX-2019-48, Nasdaq ISE notice on ISOs in auctions, Federal Register, February 7, 2023.
- Research: Savickas and Wilson (2003), On Inferring the Direction of Option Trades; Pan and Poteshman, NBER working paper 10925 and conference version.
- Market share: Rosenblatt Securities, Let There Be Light, US edition, as used in our volume guide.
- Providers, checked November 6, 2026: the pricing pages linked in the table above.
More Options Trading guides
- Learn how options work
Options Trading for Beginners: How Calls and Puts Work
Calls, puts, strike, expiry and premium with a worked example, exercise and assignment, the main risks, US broker approval and a first path.
- Read gamma exposure
Gamma Exposure (GEX): How Dealer Hedging Can Move Prices
What GEX measures, the formula with a worked example, gamma flip, call wall and put wall, data sources with prices, and the limits of the model.
- Choose a strategy
Options Strategies: How to Choose, With Payoffs and Risks
19 strategies compared by market view, maximum gain, maximum loss and break-even, with worked examples, assignment risk and options approval.