
Euro Stoxx 50 Forecast: Coming Days and Long Term


The Euro Stoxx 50 closed at 6,393 on Wednesday, its highest close since 8 September. On Tuesday it closed above the October and November highs at 6,311 to 6,319 for the first time. Next come the July and September highs at 6,426 to 6,431.
Euro Stoxx 50 forecast in 30 seconds
Weekly chart
The week opened at 6,168, rose to 6,399 and stood at 6,393 on Wednesday's close.
Coming days
The highs at 6,426 to 6,431 are the next hurdle. Below, the broken highs at 6,311 to 6,319 count.
The levels
Above, 6,416, then 6,426 to 6,431, 6,498 and the all-time high at 6,577. Below, 6,311 to 6,319, the zone at 6,194 to 6,200 and the November low at 6,103.
Long term
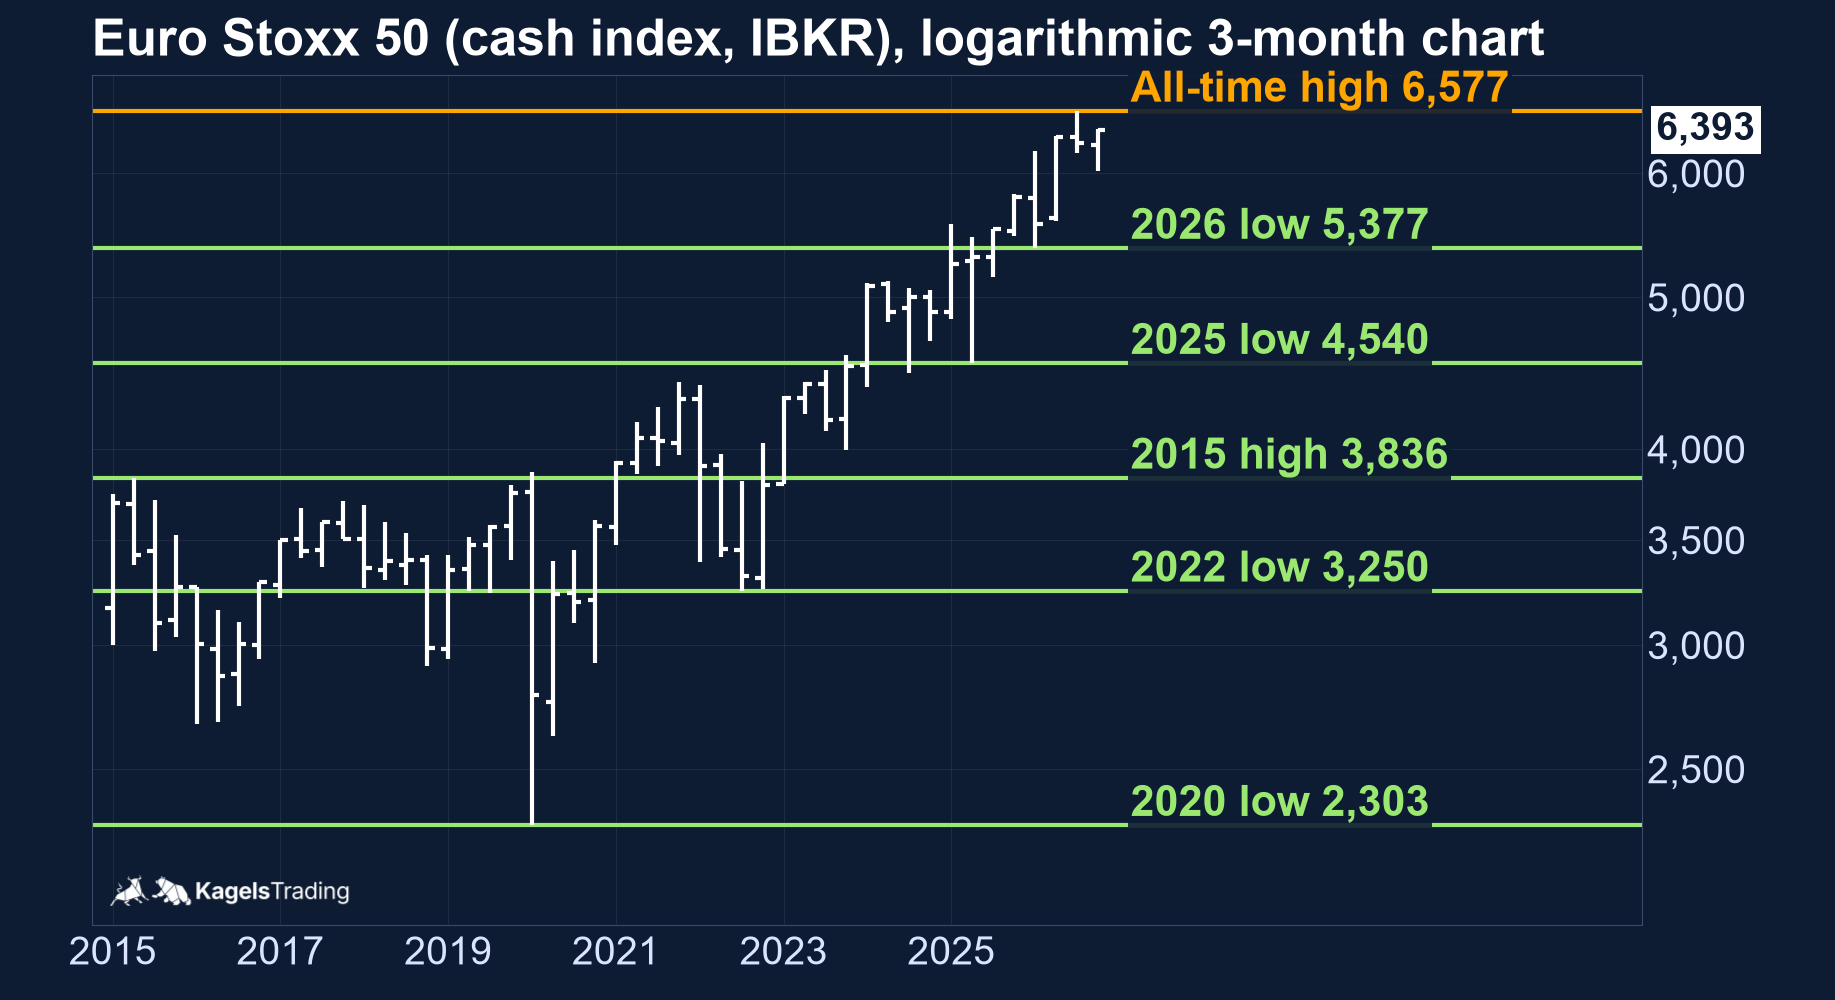
The 3-month chart shows a long-term uptrend. Starting from the 2022 low, each yearly low has been higher. The index stands 2.8 percent below its high.
On this page
- Euro Stoxx 50 forecast in 30 seconds
- Euro Stoxx 50 forecast for today: a breakout above 6,319, next hurdle 6,426 to 6,431
- Euro Stoxx 50 forecast for this week on the daily chart: above all moving averages
- What can move the Euro Stoxx 50 next: the December central bank dates
- Euro Stoxx 50 forecast for the coming weeks on the weekly chart: a week above the October highs
- Three scenarios: which level decides
- Euro Stoxx 50 forecast 2026 and for the year end: up 10.4 percent, November above the October close
- Euro Stoxx 50 forecast long term: rising yearly lows on the 3-month chart
- What is the Euro Stoxx 50?
- Euro Stoxx 50 companies: the ten largest and all 50 members
- Euro Stoxx 50 trading hours
- The Euro Stoxx 50 future (FESX)
- How this forecast is made
- Conclusion: a breakout above the October highs, the July and September highs still stand
- Frequently asked questions
- Please note
Euro Stoxx 50 forecast for today: a breakout above 6,319, next hurdle 6,426 to 6,431
For Thursday, 12 November 2026
 Click to enlarge
All charts on this page show the Euro Stoxx 50 cash index (SX5E), drawn from Interactive Brokers data. The index is calculated from 09:00 to 18:00 CET, so the charts show no overnight moves. Prices of the FESX future and of CFDs can differ. Every chart runs to the close of 11 November 2026.
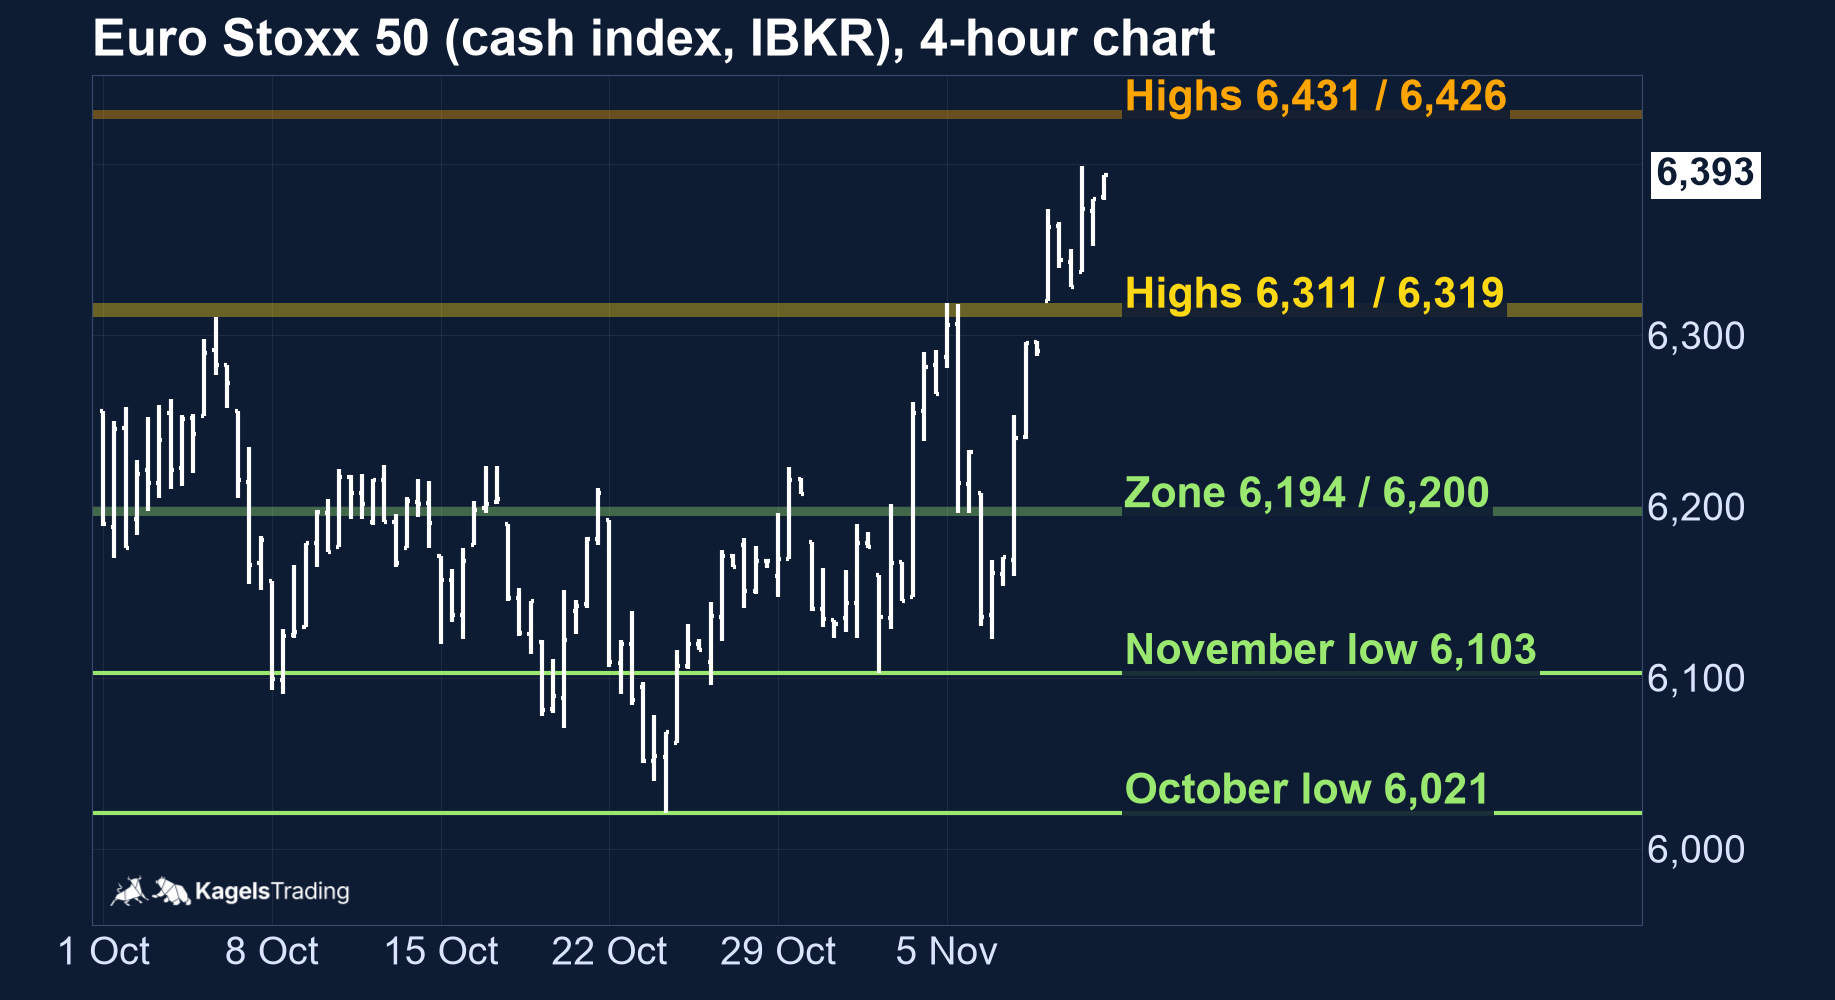
On the 4-hour chart the index rose above the October and November highs in three days. On Monday it opened at 6,168 and closed at 6,290, 1.9 percent above Friday. On Tuesday it opened at 6,320, above the highs at 6,311 to 6,319, and closed at 6,328. On Wednesday it reached 6,399 and closed at 6,393.
The old highs are now support. Since Tuesday the index has stayed above 6,311 to 6,319, and Tuesday's low at 6,320 held just above them. If the area holds, the July and September highs at 6,426 to 6,431 are the next resistance. If the index falls back below it, the zone at 6,194 to 6,200 is the next level.
Resistance
- 6,431
- 6,426
- 6,416
Price at analysis6,393
Support
- 6,319
- 6,311
- 6,200
- 6,194
Euro Stoxx 50 forecast for this week on the daily chart: above all moving averages
Week of 9 November 2026
 Click to enlarge
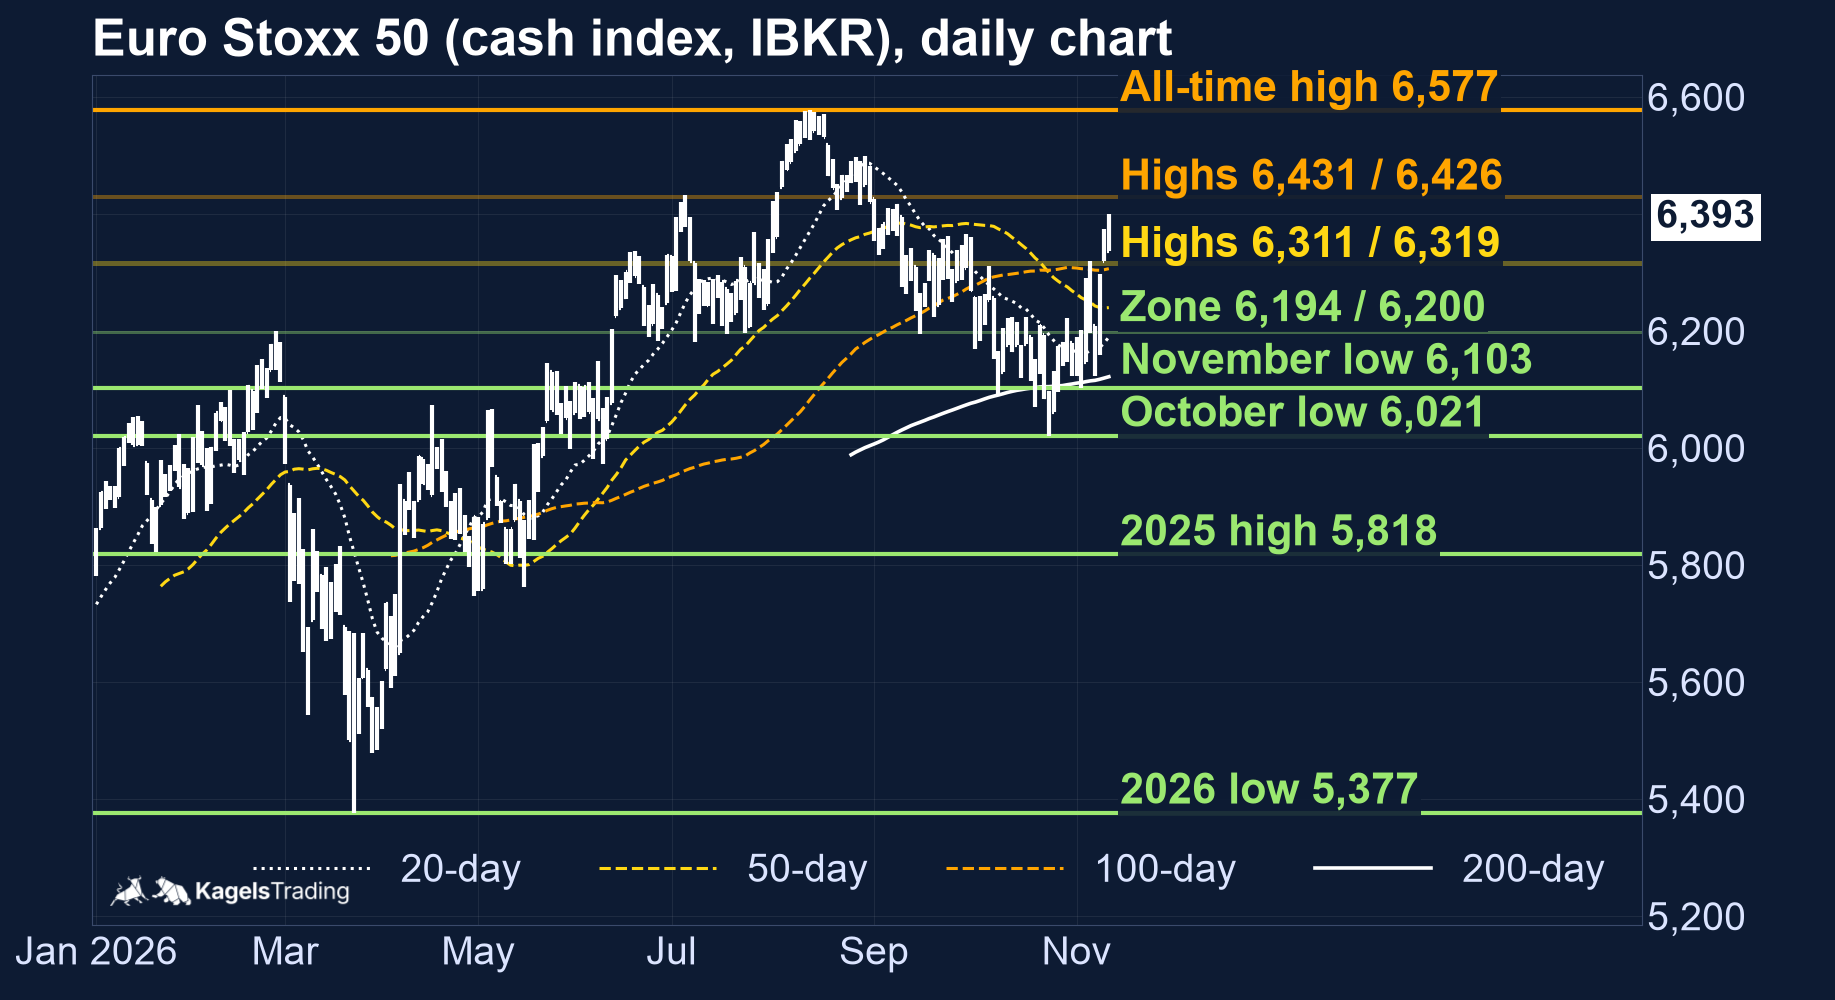
The sequence of falling rally highs is broken. After 6,577 on 12 August came 6,498 on 28 August, 6,416 on 8 September, 6,365 on 29 September and 6,311 on 6 October. On 10 November the index rose to 6,374, above the 29 September high, and on Wednesday it reached 6,399.
On the downside the picture has improved. The November low at 6,103 lies above the October low at 6,021, set on 23 October, and the close at 6,393 is the highest since 8 September. The index has cut its distance to the all-time high to 2.8 percent.
The index closed above all four moving averages. It stands above the 20-day line at 6,189, the 50-day line at 6,240, the 100-day line at 6,306 and the 200-day line at 6,122. The 100-day line runs close to the broken highs at 6,311 to 6,319.
Resistance
- 6,577
- 6,498
- 6,431
- 6,426
- 6,416
Support
- 6,319
- 6,311
- 6,306
- 6,240
- 6,200
- 6,194
- 6,189
- 6,122
What can move the Euro Stoxx 50 next: the December central bank dates
The next rate decisions are reasons to read the chart again, not a forecast of a reaction. The ECB left its deposit rate at 2.50 percent on 29 October. The Fed time is Eastern Time, with central European time in brackets.
9 December, usually 2:00 p.m. ET (20:00 CET): Fed rate decision after the meeting of 8 and 9 December (FOMC calendar).
17 December, 14:15 CET: ECB rate decision after the meeting of 16 and 17 December (ECB calendar).
18 December, 12:00 CET: the December FESX contract ends on the third Friday of the month, which is also the final settlement day. Index values between 11:50 and 12:00 CET set the settlement price.
For the euro area, the ECB sets interest rates. What is at stake at the meeting is explained in our article on the ECB rate decision; the US side is covered by the Fed rate decision.
Euro Stoxx 50 forecast for the coming weeks on the weekly chart: a week above the October highs
 Click to enlarge
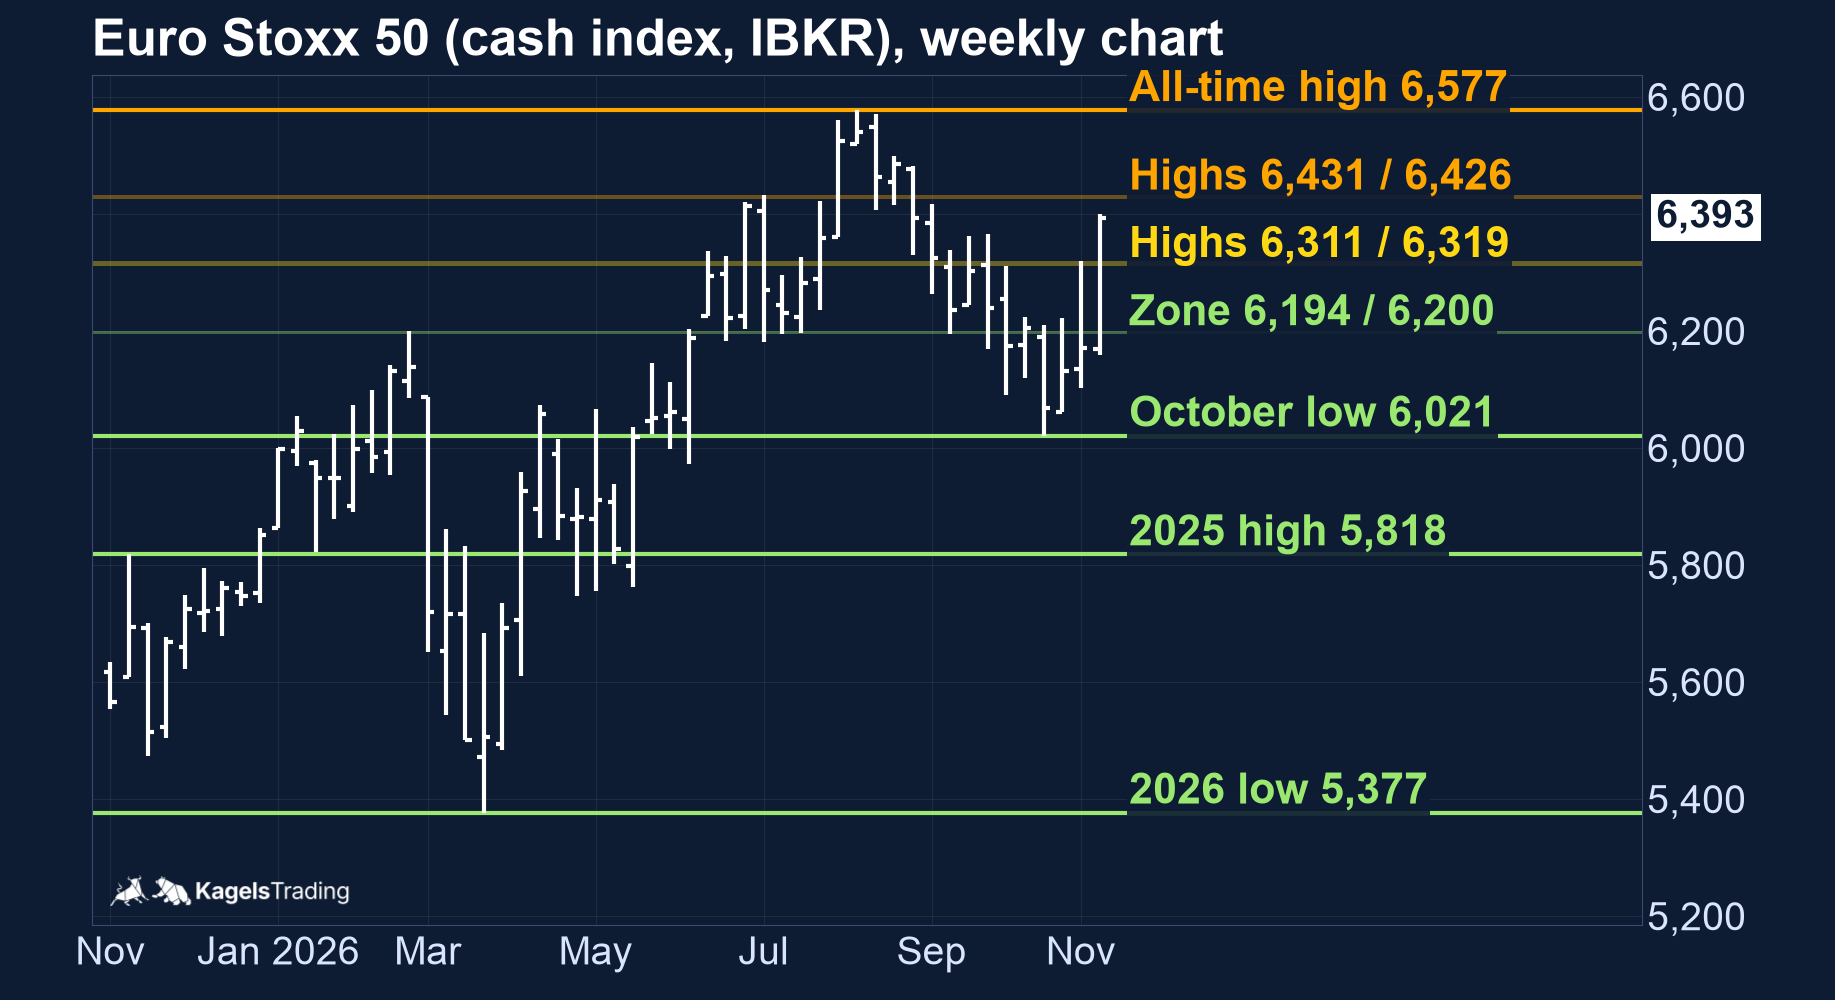
The weekly chart shows a correction since the August high, not yet a change of the larger trend. The index stands 2.8 percent below 6,577 and remains well above the 2025 high at 5,818, which it has held on a weekly closing basis since April.
The current week stands near the top of its range. It opened at 6,168, ranged from 6,159 to 6,399 and stood at 6,393 on Wednesday, 3.6 percent above the prior week's close at 6,170. Friday's weekly close will show whether the breakout holds.
Above 6,399 the next marks are 6,416 and 6,426 to 6,431. Below 6,311 the weekly chart offers the zone at 6,194 to 6,200 and the October low at 6,021.
Resistance
- 6,577
- 6,431
- 6,426
- 6,416
Support
- 6,319
- 6,311
- 6,200
- 6,194
- 6,021
Three scenarios: which level decides
The last completed trading day decides which path applies. Exactly one applies at any time. After Wednesday's close at 6,393 it is the waiting path. On 10 November the close at 6,328 triggered the previous bullish path above 6,319, and the thresholds have been reset since. The price levels are highs and lows from the index data; the closing condition is an editorial guideline.
Bullish: a close above 6,431
Applies as long as the last close is above the July high at 6,431. That would be the first close above the July and September highs since 28 August. Resistance then follows at 6,498 and at the all-time high at 6,577.
Wait: a close between 6,194 and 6,431
Applies as long as the last close is between the two levels, the levels themselves included. That is the case now. At the close of 11 November at 6,393, the October and November highs lie below and the July and September highs above. No setup is also a result.
Bearish: a close below 6,194
Applies as long as the last close is below the September low at 6,194. The breakout above the highs at 6,311 to 6,319 would then have failed, and the index would be back inside the range of the correction. Reference levels below are the November low at 6,103 and the October low at 6,021. They are not targets.
Resistance
- 6,577
- 6,498
- 6,431
Support
- 6,319
- 6,194
- 6,103
- 6,021
Euro Stoxx 50 forecast 2026 and for the year end: up 10.4 percent, November above the October close
 Click to enlarge
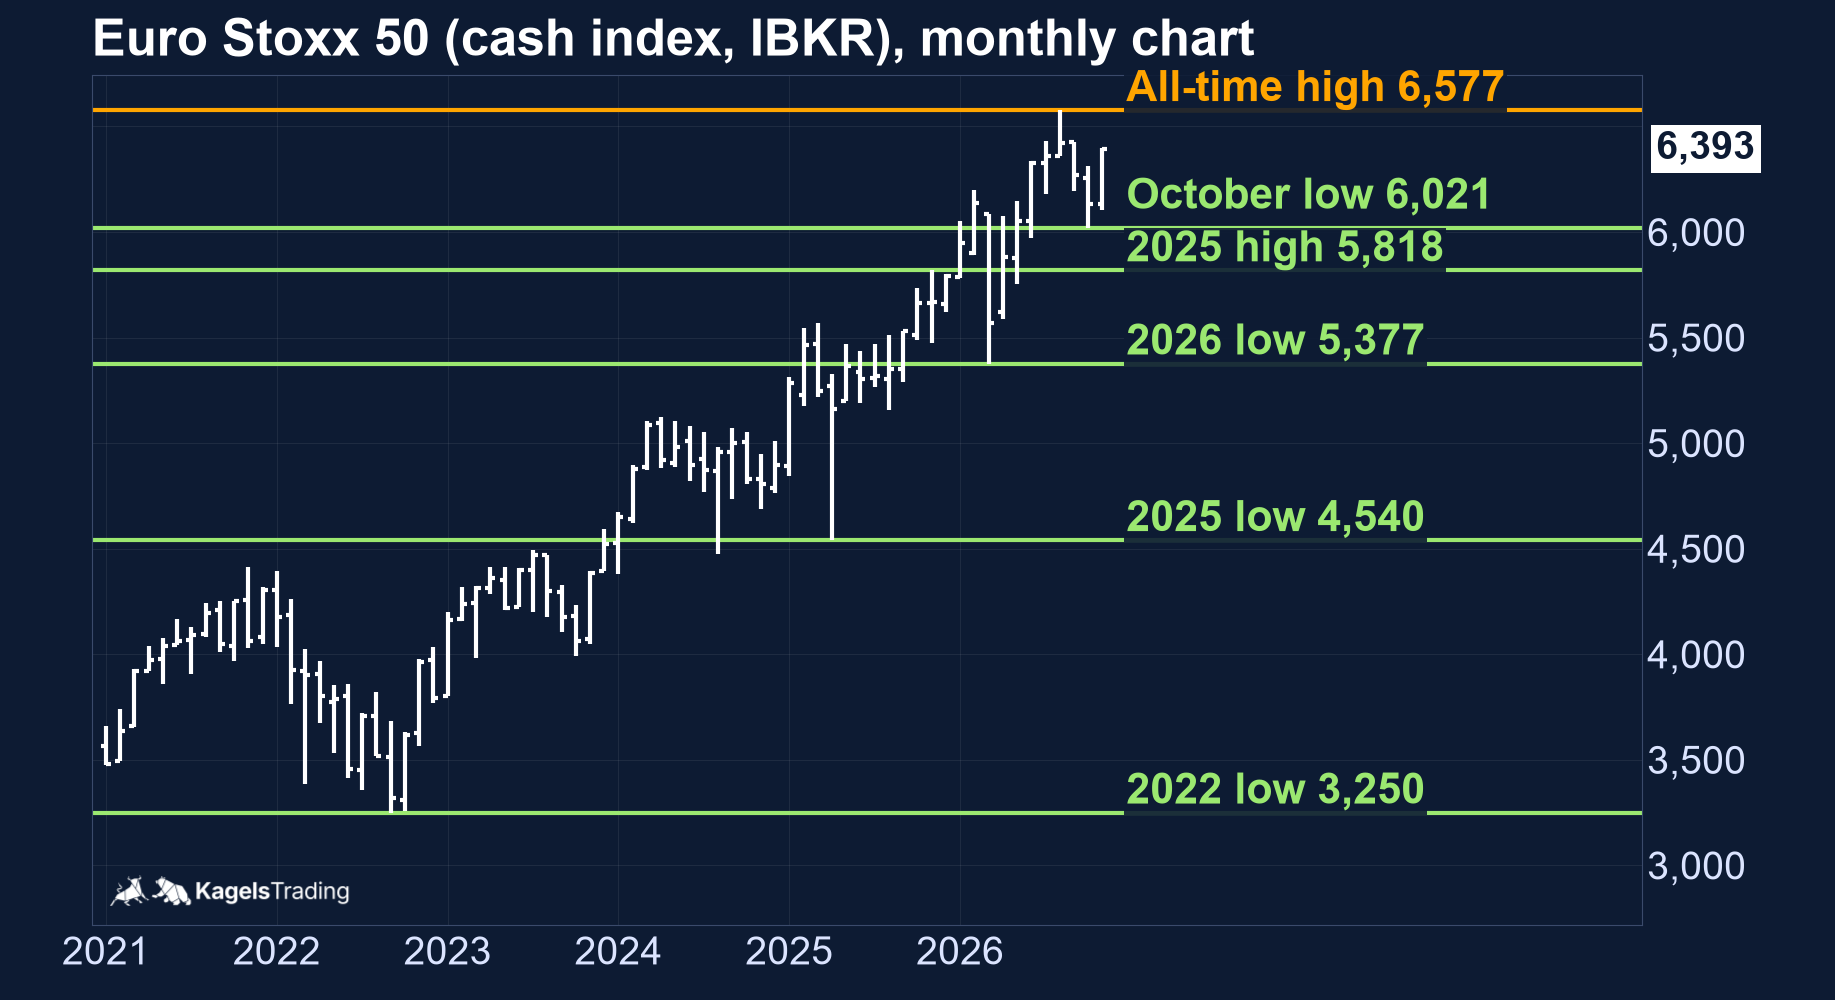
On the monthly chart November is rising above the October close. August closed at 6,420, September at 6,269 and October at 6,131. November so far ranges from 6,103 to 6,399 and stands 4.3 percent above the October close. Whether the series of lower monthly closes ends is decided by the close on 30 November.
The year is clearly positive. At 6,393 the index stands 10.4 percent above the 2025 close at 5,791. It opened 2026 at 5,786, fell to its 2026 low at 5,377 on 23 March and reached its high in August.
For the year end, 5,818 is the level to watch on the downside. A close above the 2025 high would mean the year ends above the previous year's whole range. This is an observation from the chart, not a target for December.
Resistance
- 6,577
Support
- 6,021
- 5,818
- 5,377
- 4,540
Euro Stoxx 50 forecast long term: rising yearly lows on the 3-month chart
 Click to enlarge
The logarithmic 3-month chart shows a long-term uptrend since the 2020 low. Each bar is one quarter. A logarithmic scale shows percentage moves at the same size, whichever level the index stands at.
Starting from the 2022 low, each yearly low has been higher. They run from 3,250 in 2022 through 3,803, 4,381 and 4,540 to 5,377 so far in 2026. The index first closed a month above its 2015 high at 3,836 in March 2021 and fell back below it in 2022. Since 2023 each year has set a new high.
The 3-month chart gives no target level for 2027. The level from which the index starts the new year is decided by the year's close in 2026.
There is no reliable point forecast for 2030. The 3-month chart describes a direction, not a target price. The sharp falls of 2020 and 2022 show that such a trend can be interrupted for long stretches.
Resistance
- 6,577
Support
- 5,377
- 4,540
- 3,250
What is the Euro Stoxx 50?
The Euro Stoxx 50 is a stock index of 50 large eurozone companies, chosen from the 20 Supersectors of the EURO STOXX index and weighted by free-float market capitalization, with each company capped at 10 percent.
The composition is reviewed once a year, in September. The cut-off date is the last trading day of August. The 40 largest companies on the selection list get in directly, and the last 10 places go first to current members ranked 41 to 60, so that the list does not change on small moves. Between reviews, fast exit and fast entry rules can replace a company, and the 10 percent cap is reset each quarter, so a weight can sit above it in between. All of this is set out in the STOXX Index Methodology Guide.
STOXX will change these rules in three steps from 2027. From the September 2027 review, a fast exit only happens after a member has ranked 75th or lower for two months in a row. From March 2029 the index is reviewed twice a year, in March and September. With the September 2029 review the Supersector rule in the selection goes, and free-float market capitalization alone decides, according to the results of the STOXX market consultation of 2 October 2026.
By country, France and Germany carry more than 60 percent of the index. France has 32.0 percent and Germany 29.8, followed by the Netherlands (13.9), Spain (10.7), Italy (8.5), Belgium (2.9) and Finland (2.2), according to the STOXX factsheet, composition as of 30 October 2026. Banks and technology are the largest Supersectors, at 17.2 percent each.
The usual quote is a price index, and that matters when you compare it with the DAX. The headline SX5E leaves dividends out. The headline DAX, with 40 members, reinvests them in its most popular version. A chart of the two therefore shows more than the difference between the companies.
Euro Stoxx 50 companies: the ten largest and all 50 members
The ten largest members carry 42.5 percent of the index. ASML alone accounts for almost a tenth, followed by SAP, Siemens and TotalEnergies. The weights are as of 30 October 2026, according to the STOXX factsheet.
| Company | Country | Weight (%) |
|---|---|---|
| ASML | Netherlands | 9.8 |
| SAP | Germany | 4.9 |
| Siemens | Germany | 4.5 |
| TotalEnergies | France | 4.5 |
| Allianz | Germany | 3.8 |
| Banco Santander | Spain | 3.5 |
| Iberdrola | Spain | 3.1 |
| Schneider Electric | France | 3.1 |
| BBVA | Spain | 2.7 |
| Air Liquide | France | 2.6 |
These are all 50 members after the review of 21 September 2026. The table lists each company with its main exchange and sector, in alphabetical order. The 16 members listed in Paris all belong to the CAC 40 as well. Live prices for every member are on the Euro Stoxx 50 components page on TradingViewAffiliate link: we may earn a commission if you buy.. We may earn a commission if you buy through the TradingView links in this guide. The sector column follows the Wikipedia list, not the STOXX Supersectors.
| Company | Exchange | Sector |
|---|---|---|
| Adidas | Frankfurt | Consumer Discretionary |
| Adyen | Amsterdam | Financials |
| Ahold Delhaize | Amsterdam | Consumer Staples |
| Air Liquide | Paris | Materials |
| Airbus | Paris | Industrials |
| Allianz | Frankfurt | Financials |
| Anheuser-Busch InBev | Brussels | Consumer Staples |
| argenx | Brussels | Health Care |
| ASML Holding | Amsterdam | Information Technology |
| AXA | Paris | Financials |
| Banco Santander | Madrid | Financials |
| BASF | Frankfurt | Materials |
| Bayer | Frankfurt | Health Care |
| BBVA | Madrid | Financials |
| BMW | Frankfurt | Consumer Discretionary |
| BNP Paribas | Paris | Financials |
| Danone | Paris | Consumer Staples |
| Deutsche Bank | Frankfurt | Financials |
| Deutsche Börse | Frankfurt | Financials |
| Deutsche Telekom | Frankfurt | Communication Services |
| DHL Group (Deutsche Post) | Frankfurt | Industrials |
| Enel | Milan | Utilities |
| Engie | Paris | Utilities |
| Eni | Milan | Energy |
| EssilorLuxottica | Paris | Health Care |
| Ferrari | Milan | Consumer Discretionary |
| Hermès | Paris | Consumer Discretionary |
| Iberdrola | Madrid | Utilities |
| Inditex | Madrid | Consumer Discretionary |
| Infineon | Frankfurt | Information Technology |
| ING Group | Amsterdam | Financials |
| Intesa Sanpaolo | Milan | Financials |
| L’Oréal | Paris | Consumer Staples |
| LVMH | Paris | Consumer Discretionary |
| Mercedes-Benz Group | Frankfurt | Consumer Discretionary |
| Munich Re | Frankfurt | Financials |
| Nokia | Helsinki | Information Technology |
| Nordea | Helsinki | Financials |
| Prosus | Amsterdam | Consumer Discretionary |
| Rheinmetall | Frankfurt | Industrials |
| Safran | Paris | Industrials |
| Saint-Gobain | Paris | Industrials |
| Sanofi | Paris | Health Care |
| SAP | Frankfurt | Information Technology |
| Schneider Electric | Paris | Industrials |
| Siemens | Frankfurt | Industrials |
| Siemens Energy | Frankfurt | Industrials |
| TotalEnergies | Paris | Energy |
| UniCredit | Milan | Financials |
| Vinci | Paris | Industrials |
Nokia and Engie joined the index on 21 September 2026. In exchange, the Volkswagen preferred shares and Wolters Kluwer left, according to the STOXX announcement of 1 September 2026.
Euro Stoxx 50 trading hours
STOXX calculates the Euro Stoxx 50 from 09:00 to 18:00 Central European time on exchange days and publishes it every 15 seconds. The FESX future trades much longer, see the next section, so it also shows moves before and after the cash session. On the members’ home exchanges, regular trading starts at 09:00 Central European time (CET in winter, CEST in summer) and ends around 17:30 with the closing auctions. All exchanges are listed in our guide to stock exchange hours. You can follow the index live on the Euro Stoxx 50 chart on TradingViewAffiliate link: we may earn a commission if you buy..
The Euro Stoxx 50 future (FESX)
The FESX is the Eurex future on the index, and one point is worth 10 euros. The minimum price move is one point. It trades in the March, June, September and December cycle and is settled in cash. The last trading day is the third Friday of the contract month, or the exchange day before it if that Friday is not an exchange day. Trading then ends at 12:00 CET. On a normal day, continuous trading runs from 01:10 to 22:00 CET in winter and, according to the Eurex trading calendar, from 02:10 to 22:00 CEST in summer, per the Eurex contract page on 5 November 2026. To work out what a stop means in euros, use our guide to position sizing. The front contract is on the FESX chart on TradingViewAffiliate link: we may earn a commission if you buy..
How this forecast is made
The charts on this page are drawn from cash-index data, from the 4-hour to the 3-month chart. The 4-hour and daily charts give the levels for the next trading days, the weekly and monthly charts put them in context, and the 3-month chart shows the long-term trend. The marked levels are the actual highs and lows of the data, and the averages are calculated from daily closes. The charts and the first analysis were prepared with the AI assistant Claude, and Karsten Kagels reviewed the result. How such levels work is explained in our guide to support and resistance. This page follows our editorial policy.
The Euro Stoxx 50 rarely moves on its own. Its German part is covered by the DAX forecast, the US side by the S&P 500 forecast.
Conclusion: a breakout above the October highs, the July and September highs still stand
As an active trader since 1980, I see the breakout above the October and November highs as the first clear sign that the correction since August is losing strength. Tuesday’s close above 6,319 broke the series of falling rally highs, and the index stands above all four moving averages. Above stand the highs at 6,426 to 6,431; below, the broken highs at 6,311 to 6,319 and the zone at 6,194 to 6,200.
My assessment for the coming days: the range decides. A close above 6,431 would activate the bullish scenario, a close below 6,194 the bearish one. Until then the waiting path applies. In the long term the 3-month chart still shows an uptrend. You can track these levels yourself on the daily chart on TradingViewAffiliate link: we may earn a commission if you buy..
Frequently asked questions
Will the Euro Stoxx 50 keep rising?
In the long term the 3-month chart shows an uptrend; in the short term the index has broken above the October and November highs. It stands 2.8 percent below its August high at 6,577. A close above 6,431 would activate the bullish scenario.
Will the Euro Stoxx 50 fall further?
That depends on the broken highs at 6,311 to 6,319 and then on the zone at 6,194 to 6,200. A fall back below 6,311 would weaken the breakout. A close below 6,194 would activate the bearish scenario, with 6,103 and 6,021 as the next reference levels.
How will the Euro Stoxx 50 move in the next few days?
That is decided by the highs at 6,311 to 6,319. The index closed at 6,393 on 11 November 2026, above that area. If it holds, the highs at 6,426 to 6,431 are the next hurdle. If the index falls back below it, the zone at 6,194 to 6,200 comes into view.
What is the Euro Stoxx 50 forecast for 2027?
There is no reliable target level for 2027 on the chart. The 3-month chart shows rising yearly lows since 2022 and an all-time high at 6,577 in August 2026. It describes a direction, not a price for the end of 2027.
Which companies are in the Euro Stoxx 50?
It holds 50 large eurozone companies, from seven countries as of 30 October 2026. The largest are ASML, SAP, Siemens, TotalEnergies and Allianz. The list changes at the annual review in September and through the fast exit and fast entry rules, so the current members are best checked at STOXX.
What is the difference between the Euro Stoxx 50 and the DAX?
The Euro Stoxx 50 covers the eurozone with 50 companies, the DAX Germany with 40. The headline Euro Stoxx 50 is a price index without dividends, while the most popular DAX version reinvests them. Germany is one of seven countries in the Euro Stoxx 50.
Please note
The price levels are highs, lows and averages from index data; the closing conditions of the paths are an editorial guideline. Both describe possible price developments and are not a certainty. This is market analysis, not investment advice. Keep your position sizes in line with your own risk management.
This forecast is translated from the German edition on kagels-trading.de.
How our forecasts are made and reviewed: How we work.