Technical Analysis
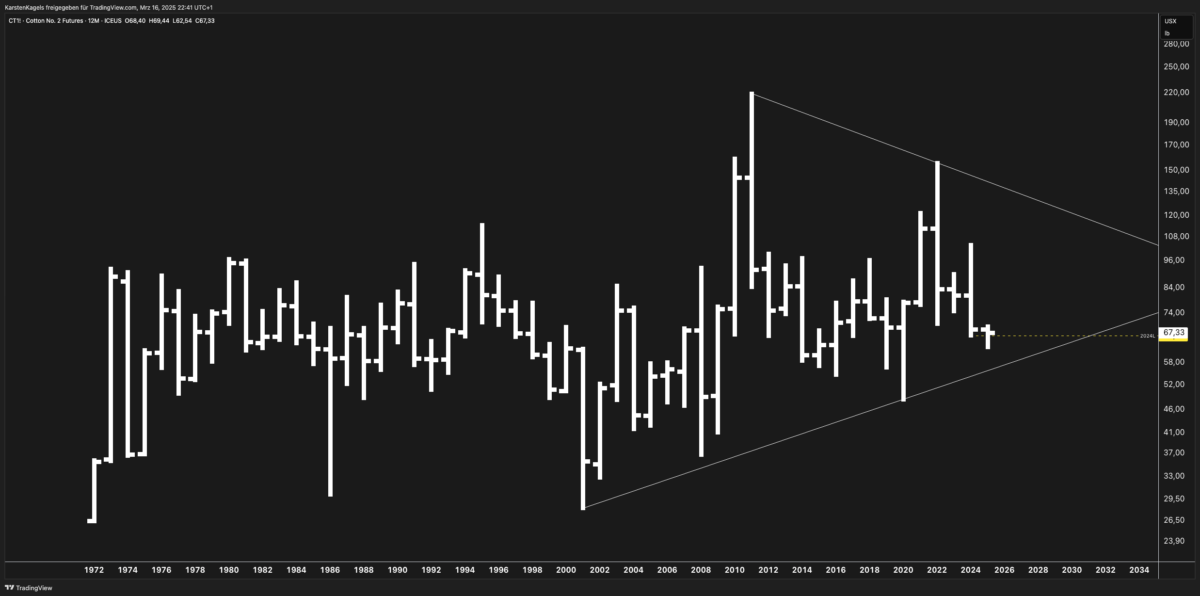
The chart reveals a clear symmetrical triangle pattern forming since 2011, with the upper resistance line connecting the 2011 peak (around 220 cents) with subsequent lower highs, while the lower support line connects the major lows from around 2000-2001 and 2020. Current price is hovering around 67.33 cents per pound.
Major Support & Resistance Levels:
- Strong resistance: 220-230 cents (2011 peak)
- Intermediate resistance: 110-120 cents (2018 and 2022 peaks)
- Current resistance: 80-85 cents (recent trading range ceiling)
- Key support: 55-60 cents (triangle support line)
- Major support: 30-35 cents (historical lows from early 2000s)
Pattern Analysis:
The symmetrical triangle suggests consolidation after a period of high volatility. Price is currently trading in the final third of this pattern, suggesting a significant breakout is likely within the next 2-3 years. Triangle patterns typically resolve in the direction of the prevailing trend before formation, but cotton has been in a complex, multi-decade consolidation.
Multi-Scenario Forecast
Bullish Scenario (40% probability):
If prices break above the upper trendline (currently around 80 cents), we could see a sharp rally targeting:
- First target: 120 cents (prior resistance)
- Second target: 150-170 cents
- Maximum target: Re-test of all-time highs near 220 cents
Catalysts for bullish scenario: Severe weather disruptions in major growing regions, significant reduction in planted acreage, strong post-pandemic textile demand growth, or supply chain disruptions.
Neutral Scenario (35% probability):
Continued consolidation within the triangle until late 2025/early 2026, with prices fluctuating between:
- Upper range: 75-80 cents
- Lower range: 60-65 cents
This would represent a continuation of the rangebound behavior seen in recent years, with traders focusing on short-term technical levels rather than fundamental developments.
Bearish Scenario (25% probability):
Break below the lower trendline (currently around 55 cents) could trigger:
- Initial decline to 45-50 cents
- Further weakness potentially testing the 30-35 cent level (2000-2001 lows)
Catalysts: Global recession, significant technological advances in synthetic fibers, substantial increases in planted acreage, or favorable growing conditions globally.
Macroeconomic Factors
Supply & Demand Dynamics
The cotton market remains heavily influenced by:
- Production forecasts: The USDA’s forecasts indicate moderating production globally, with weather patterns increasingly unpredictable due to climate change.
- Acreage competition: Farmers’ decisions between cotton and alternative crops (corn, soybeans) will continue to affect supply, particularly in the US, Brazil, and India.
- Chinese policies: As the world’s largest consumer, China’s strategic reserve management and import policies remain critical price drivers.
- Textile industry evolution: Post-pandemic recovery in apparel demand remains uneven, with fast fashion still driving significant cotton consumption but facing sustainability pressures.
External Macroeconomic Factors
- USD correlation: Cotton historically shows inverse correlation with USD strength. Current Federal Reserve policy trajectory suggests potential USD weakening which could support prices.
- Climate change impacts: Increasing frequency of extreme weather events threatens consistent yields across major growing regions.
- Trade relations: Ongoing tensions between major producers (US) and consumers (China) create potential for sudden policy shifts affecting trade flows.
- Sustainability trends: Growing emphasis on sustainable and organic cotton production may create premium market segments and affect overall supply dynamics.
Comparative Market Analysis
Cotton has historically shown varied correlations with other agricultural commodities:
- Grains complex: Moderate correlation with corn and soybeans due to acreage competition.
- Other fibers: Increasing competition from synthetic fibers, particularly recycled polyester, puts pressure on price ceilings.
- Broad commodities: Cotton typically follows general commodity cycles but with more pronounced sensitivity to textile industry-specific factors.
Recent performance shows cotton underperforming relative to grains, suggesting potential for mean reversion if fundamental factors improve.
Market Sentiment & Positioning
Recent Commitments of Traders (COT) reports show:
- Managed money maintaining modest net short positions
- Commercial hedgers (producers) with typical hedging patterns
- Small speculators showing limited interest
This positioning suggests limited extreme sentiment and room for position building in either direction prior to a major move.
Cotton Futures Fundamentals for Beginners
Cotton futures (CT) represent one of the oldest traded agricultural commodities, with standardized contracts trading on the ICE Futures US exchange. Each contract represents 50,000 pounds of cotton.
Historical Significance
Often called “white gold,” cotton has been a pivotal commodity in global trade for centuries. The futures market emerged to help farmers and textile producers manage price risks.
Why Monitor Cotton
- Economic indicator: Cotton prices reflect consumer spending patterns, particularly in apparel.
- Agricultural portfolio diversification: Different seasonality and drivers than food commodities.
- Global trade insights: Cotton trade flows highlight broader geopolitical and economic relationships.
Conclusion & Trading Implications
The current technical setup suggests we are approaching a critical juncture for cotton futures. The tightening symmetrical triangle pattern, combined with evolving fundamental factors, points to increased volatility and potential for a significant directional move within the next 12-24 months.
Traders should monitor:
- Triangle breakout signals in either direction
- USDA planting and production reports
- Weather patterns in key growing regions (US, India, China, Brazil)
- USD movement and Federal Reserve policy decisions
The most probable outcome appears to be continued consolidation followed by an eventual bullish resolution, but risk management remains essential given the significant structural changes occurring in global textile markets.
FAQ Section
Q: What are the key seasonal factors affecting cotton prices? A: Cotton prices typically show seasonality related to the Northern Hemisphere growing cycle, with planting decisions in March-April and harvest pressure often seen in October-November.
Q: How does weather affect cotton futures? A: Cotton is particularly sensitive to rainfall timing, with drought during growing season and excessive rain during harvest both potentially damaging to yield and quality.
Q: What technical indicators work best for cotton futures analysis? A: Many traders find success with momentum indicators like RSI and MACD on intermediate timeframes, while longer-term analysis benefits from moving average crossovers and major support/resistance identification.
Q: How do textile industry trends affect cotton prices? A: Fast fashion expansion has supported volume demand, but increasing recycled fiber usage and sustainability initiatives create counterbalancing pressure.