Introduction: Understanding the VIX and Its Importance The CBOE Volatility Index (VIX) is a crucial tool for traders and investors looking to gauge market sentiment and volatility. Often referred to as the “fear gauge,” the VIX reflects expectations of S&P 500 volatility over the next 30 days. As markets navigate economic uncertainty, Federal Reserve policies, inflation, and geopolitical risks, understanding the VIX is essential for both short-term traders and long-term investors.
This forecast will provide short-term and long-term VIX price projections, analyze macroeconomic influences, compare the VIX to key assets like gold, silver, S&P 500, Nasdaq, and treasury bonds, and outline volatility hedging strategies.
Historical Trends and Technical Overview
Long-Term Volatility Trends
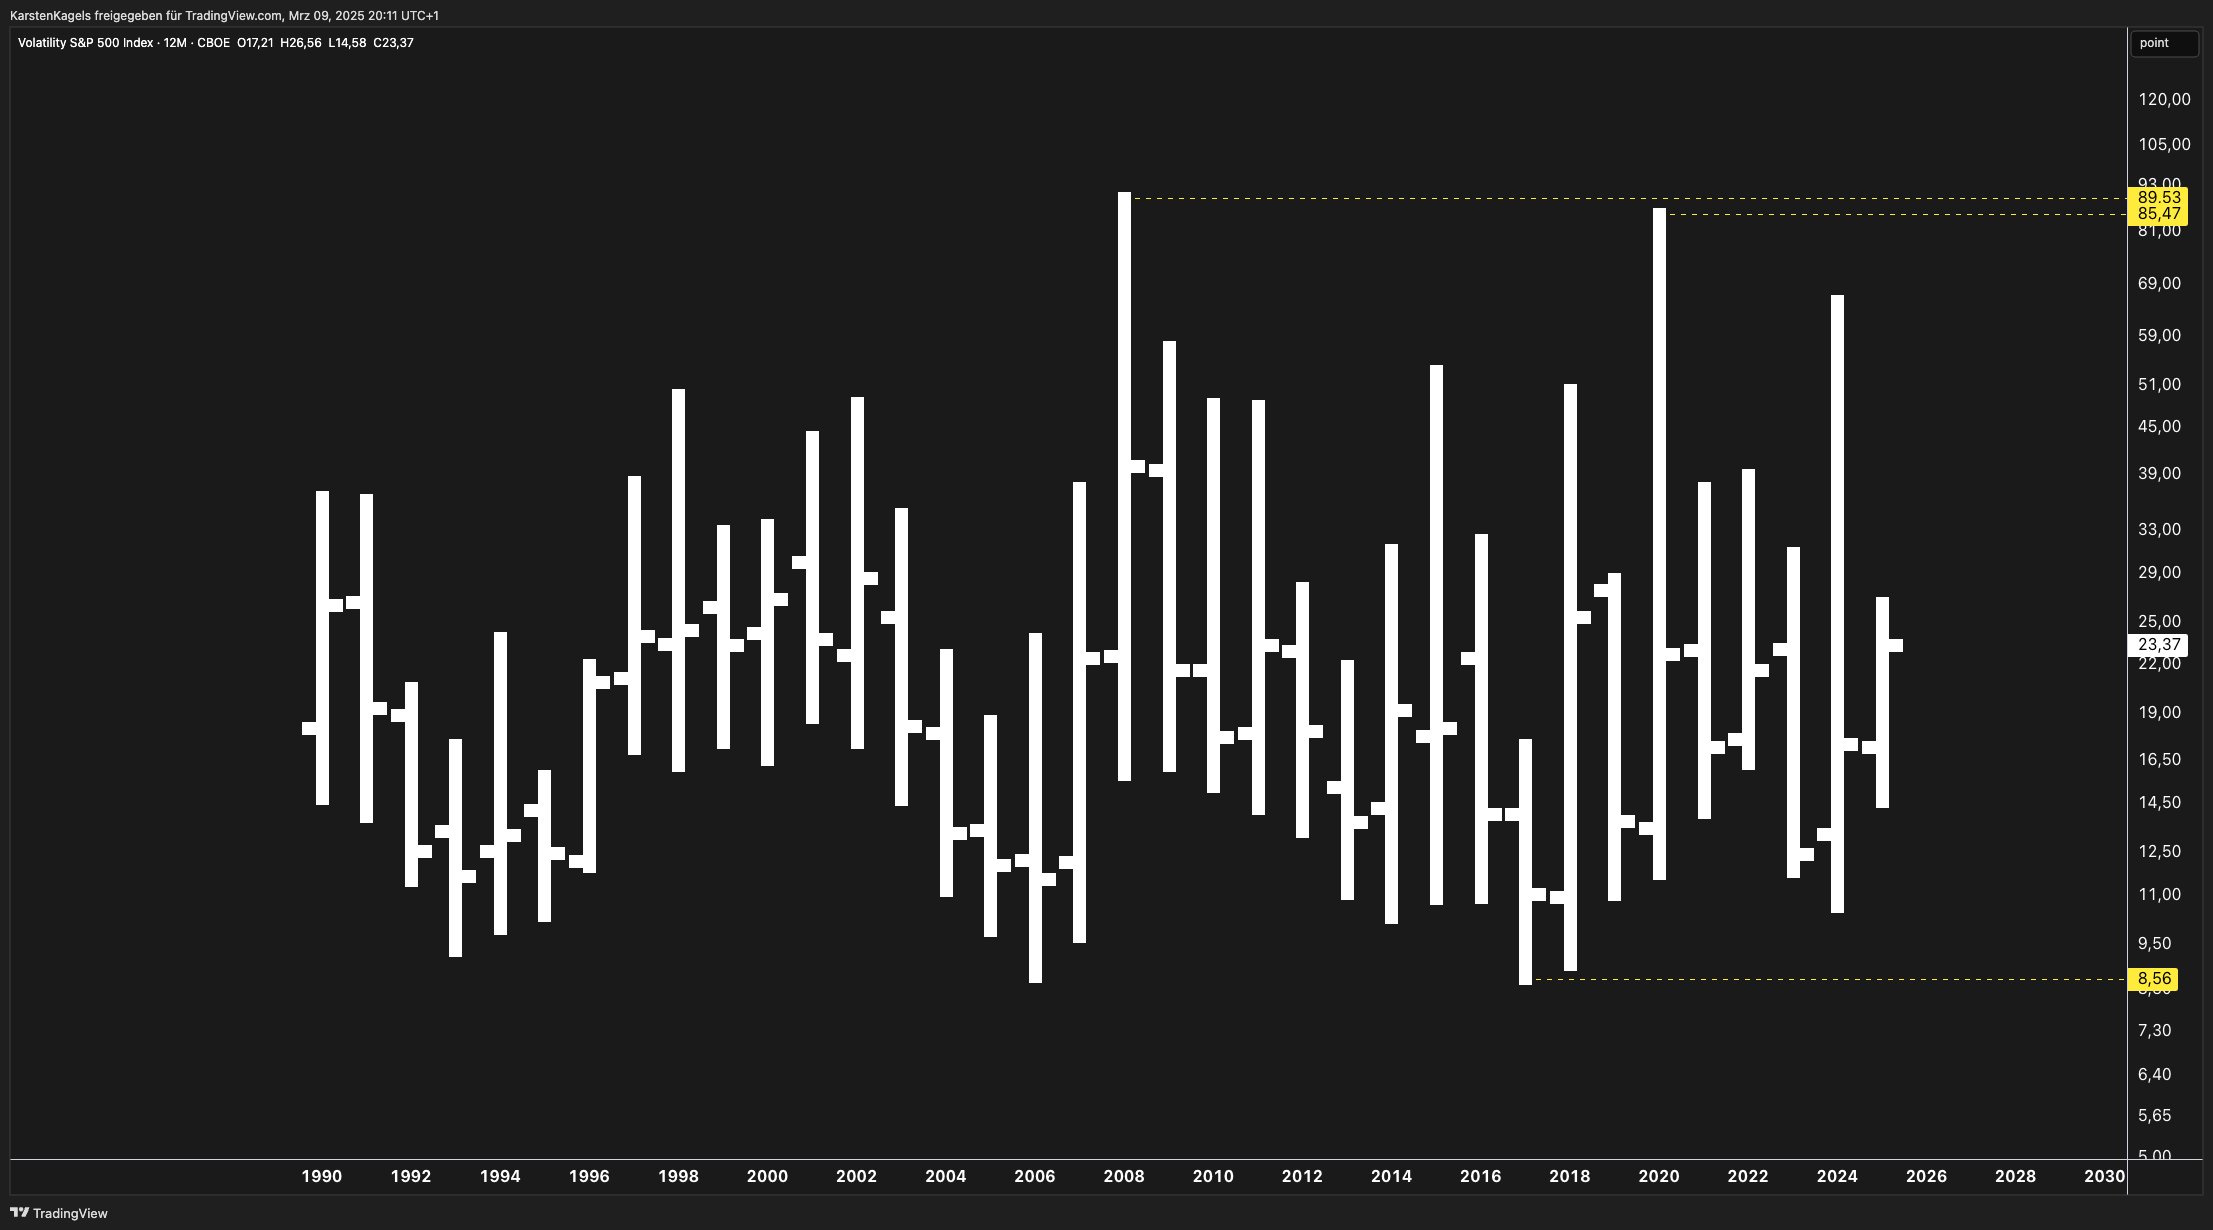
The historical VIX chart (see image) shows distinct cycles of volatility spikes, typically coinciding with economic crises and market downturns:
- 2008 Global Financial Crisis: VIX surged to 89.53
- 2020 COVID-19 Crash: VIX reached 85.47
- Current (2025) Levels: Trading around 23.37 (as of March 2025)
Key support and resistance levels:
- Long-term support: 8.56 (historical low)
- Major resistance: 85.47 – 89.53 (crisis peaks)
These historical patterns indicate that while low-volatility periods persist, market shocks can rapidly push the VIX above 40+ levels.
Short-Term Volatility Outlook (Next 3-6 Months)
- Bullish Scenario: A Fed-induced recession or geopolitical tensions could drive the VIX above 35-40.
- Neutral Scenario: A stable economy with mild fluctuations keeps VIX in the 18-26 range.
- Bearish Scenario: A risk-on environment, strong economic growth, and Fed rate cuts push VIX below 15.
Macroeconomic Factors Impacting VIX
Federal Reserve Policy & Interest Rates
- If the Fed continues its tightening cycle, we could see increased volatility, sending the VIX higher.
- A pivot to rate cuts could lower volatility and stabilize markets, suppressing the VIX.
Inflation & Economic Growth
- Higher-than-expected inflation often leads to hawkish Fed policies, spooking markets and lifting the VIX.
- Economic contraction typically drives volatility as investors rush for safe-haven assets.
Geopolitical Risks
- Global conflicts, trade wars, or supply chain disruptions increase market uncertainty, leading to VIX spikes.
Comparative Analysis: VIX vs. Major Asset Classes
VIX vs. S&P 500 & Nasdaq
- The VIX has an inverse correlation with the S&P 500 and Nasdaq.
- A strong bull market suppresses VIX, while sell-offs push it higher.
VIX vs. Gold & Silver
- Gold and silver act as safe havens during high-volatility periods.
- When VIX rises, gold and silver prices tend to rally due to increased risk aversion.
VIX vs. Treasury Bonds
- Bond yields drop during crises, pushing bond prices higher as investors flee to safety.
- A higher VIX often signals a move into Treasuries, reinforcing the flight-to-safety trend.
Short-Term, Medium-Term, and Long-Term VIX Forecast
Short-Term (3-6 months)
- Expected range: 18-35, with potential spikes due to economic or geopolitical events.
- Key catalyst: Fed policy decisions, earnings season volatility, inflation reports.
Medium-Term (6-18 months)
- Expected range: 15-40, depending on macroeconomic developments.
- Potential market correction could push the VIX towards 40+ levels.
Long-Term (2-5 years)
- Expected range: 10-50, but major crises could send it towards 80+ levels.
- Stock market cycles will dictate whether the VIX remains subdued or experiences major spikes.
Volatility Hedging Strategies
1. Trading VIX ETFs and ETNs
- Short-term traders: Utilize VXX (VIX Short-Term Futures) or UVXY (Ultra VIX Short-Term Futures) to profit from volatility spikes.
- Long-term investors: Consider hedging portfolios with long positions in VIX instruments.
2. Options Strategies on VIX Futures
- Buying VIX calls as a hedge against market downturns.
- Selling VIX puts during periods of high volatility to capture premium decay.
3. Diversification with Precious Metals and Bonds
- Holding gold and Treasuries can mitigate risks associated with VIX fluctuations.
Beginner’s Guide: What is the VIX and How to Use It?
- What is the VIX? The CBOE Volatility Index measures expected S&P 500 volatility.
- How is it calculated? Based on S&P 500 options pricing.
- Why does it matter? A rising VIX signals market fear, while a falling VIX suggests stability.
- How to trade the VIX? Using VIX ETFs, futures, and options.
Conclusion: Key Takeaways for Traders and Investors
- Short-term VIX range: 18-35 with potential spikes.
- Long-term volatility cycles suggest VIX levels between 10-50, with extreme cases reaching 80+.
- Macroeconomic risks (Fed policy, inflation, geopolitical issues) will dictate volatility trends.
- VIX has strong inverse correlations with stocks and positive correlations with gold, silver, and bonds.
- Hedging with VIX ETFs, options, and safe-haven assets is crucial for risk management.
- Gold (XAU/USD) Forecast April 2025: Price Targets & Expert Assessment - April 5, 2025
- ETH/USD Forecast April 2025: Price Targets & Expert Assessment - March 29, 2025
- BTC/USD Forecast April 2025: Price Targets & Technical Analysis After New ATH - March 29, 2025