What is the USD/CHF currency pair?
USD/CHF is the currency pair made of the US dollar and the Swiss franc. The
rate says how many francs one US dollar costs. When the rate falls, the dollar
loses value and the franc gains.
Traders call the pair the Swissy. It is one of the major currency pairs in
foreign exchange, but it moves more calmly than Cable or the Aussie. Against
EUR/USD there is a pronounced negative
correlation: when the euro rises against the dollar, USD/CHF usually falls with
it.
The Swiss franc counts as a safe haven. In times of crisis capital flows into
Switzerland, because the country is seen as politically and economically stable.
That demand lifts the franc and pushes the USD/CHF rate down.
With this pair you always trade against the central bank as well. The Swiss
National Bank can slow an excessive appreciation of the franc through purchases
of foreign currency. A different kind of intervention was the surprise end of
the euro minimum exchange rate on 15 January 2015, known as the franc shock.
After it the franc appreciated sharply and USD/CHF broke down.
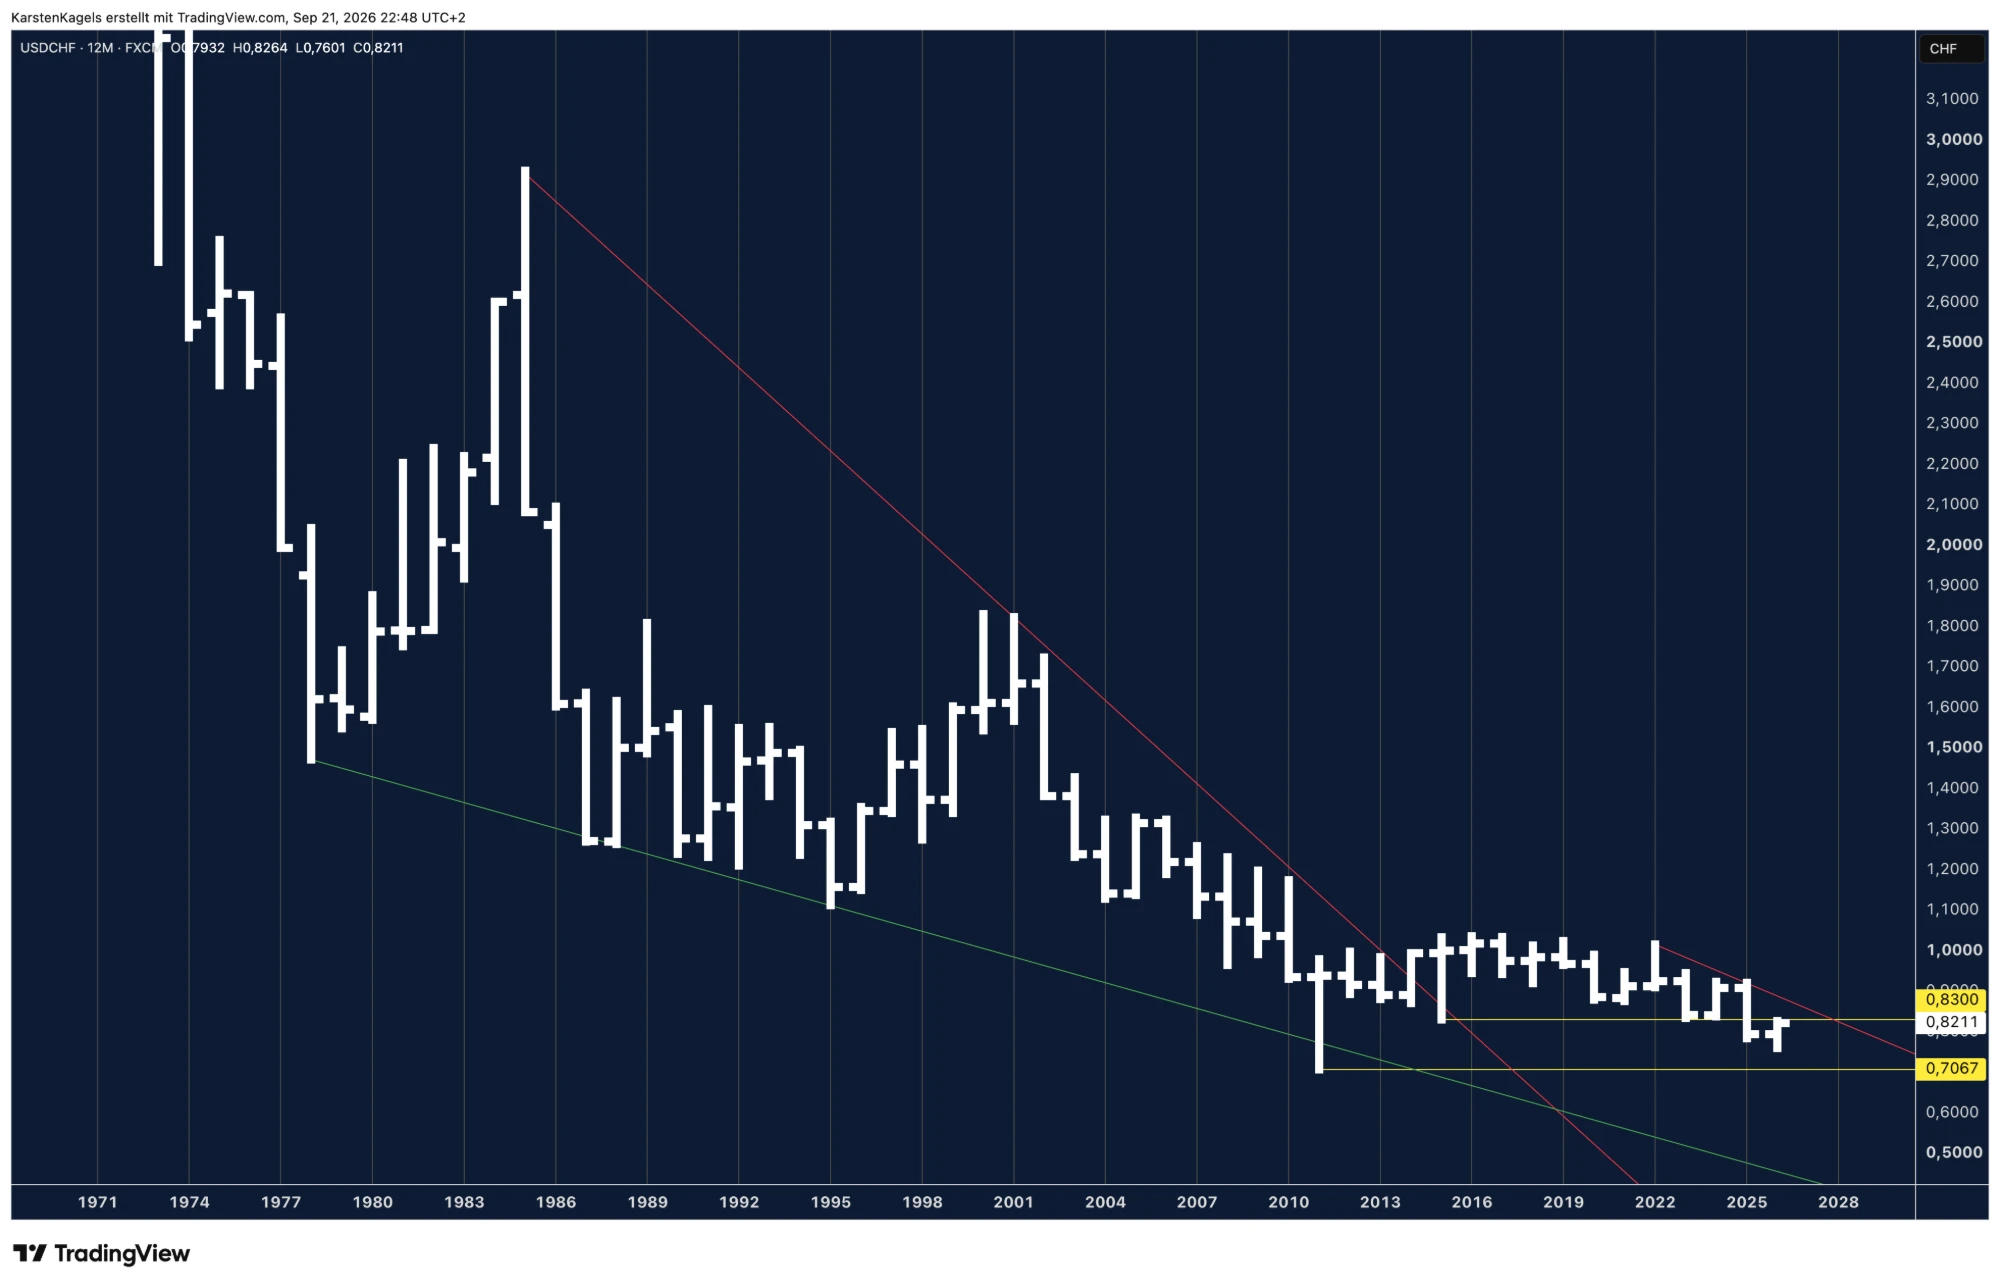
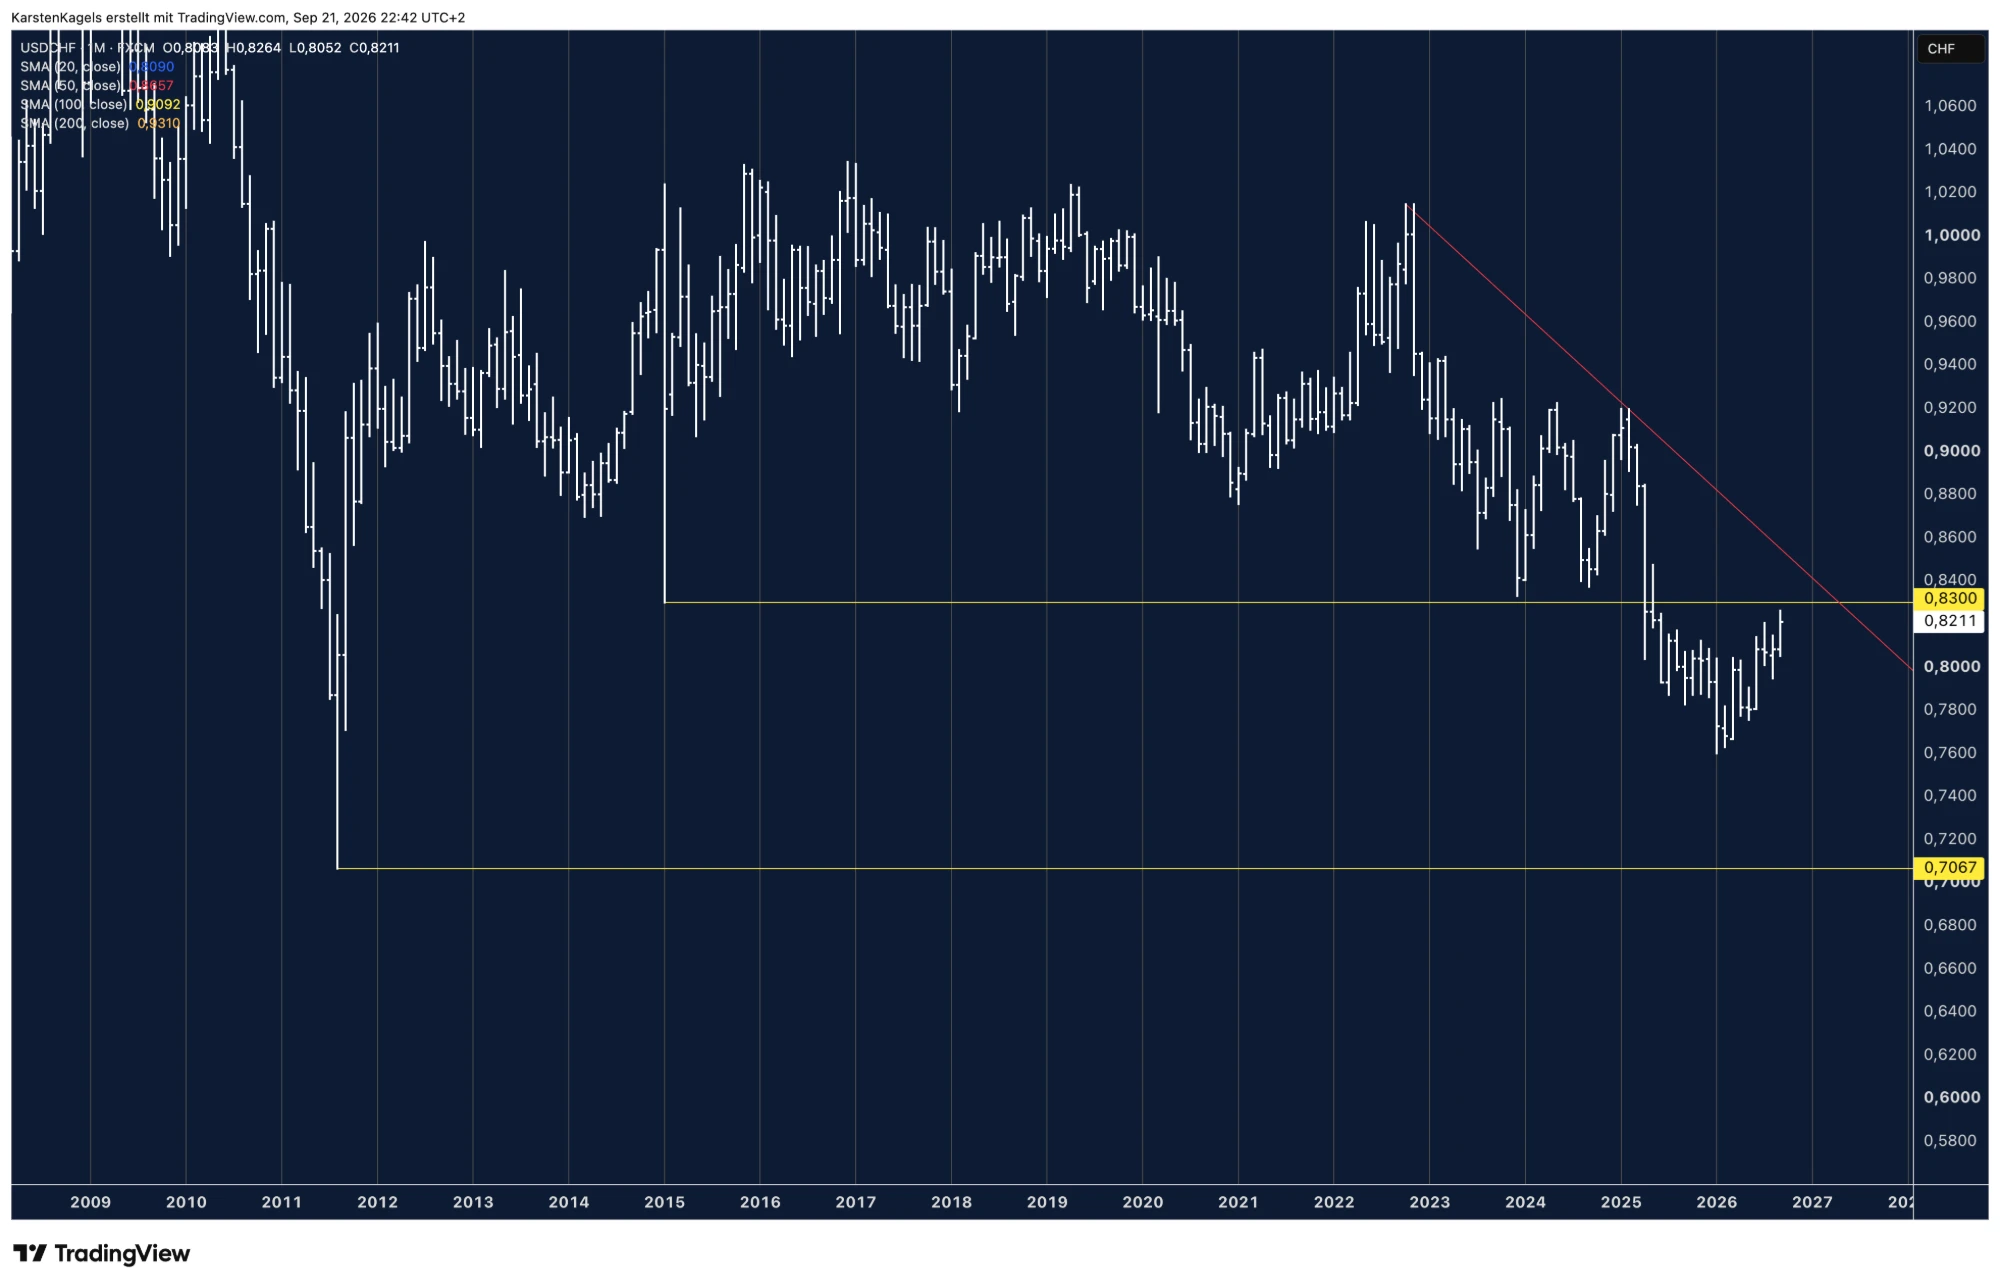
One note on the numbers of that day. How far USD/CHF really fell on
15 January 2015 looks different on every trading venue. In the data from FXCM,
on which our charts are based, the low of that year sits at 0.8300. Other feeds
show values down to the area around 0.73. During the franc shock the available
liquidity was extremely thin for a while. Depending on the price feed and the
pricing basis, historical extreme values can therefore differ from each other.
The exact cause of the different lows cannot be determined from the charts
alone. We work with the FXCM data throughout this article, so that text and
charts match.
What moves the USD/CHF rate
The dollar has a clear policy rate advantage over the franc. These are the
drivers to watch:
- The rate gap between the Fed and the SNB: the US Federal Reserve raised
its target range by a quarter point to 3.75 to 4.00% on 16 September 2026,
effective from 17 September. It was the first increase since July 2023, and
the vote was unanimous. The Swiss National Bank has not touched its policy
rate since the start of the year. It stands at 0.00%, so the gap is now
about four percentage points.
- The franc as a safe haven: a rate gap works on the currency market like a
pull. Capital flows into the currency with the higher rate. With USD/CHF that
pull lifts the rate. Working against it is the demand for francs as a safe
haven, which is independent of the rate. For years that second force was the
stronger one.
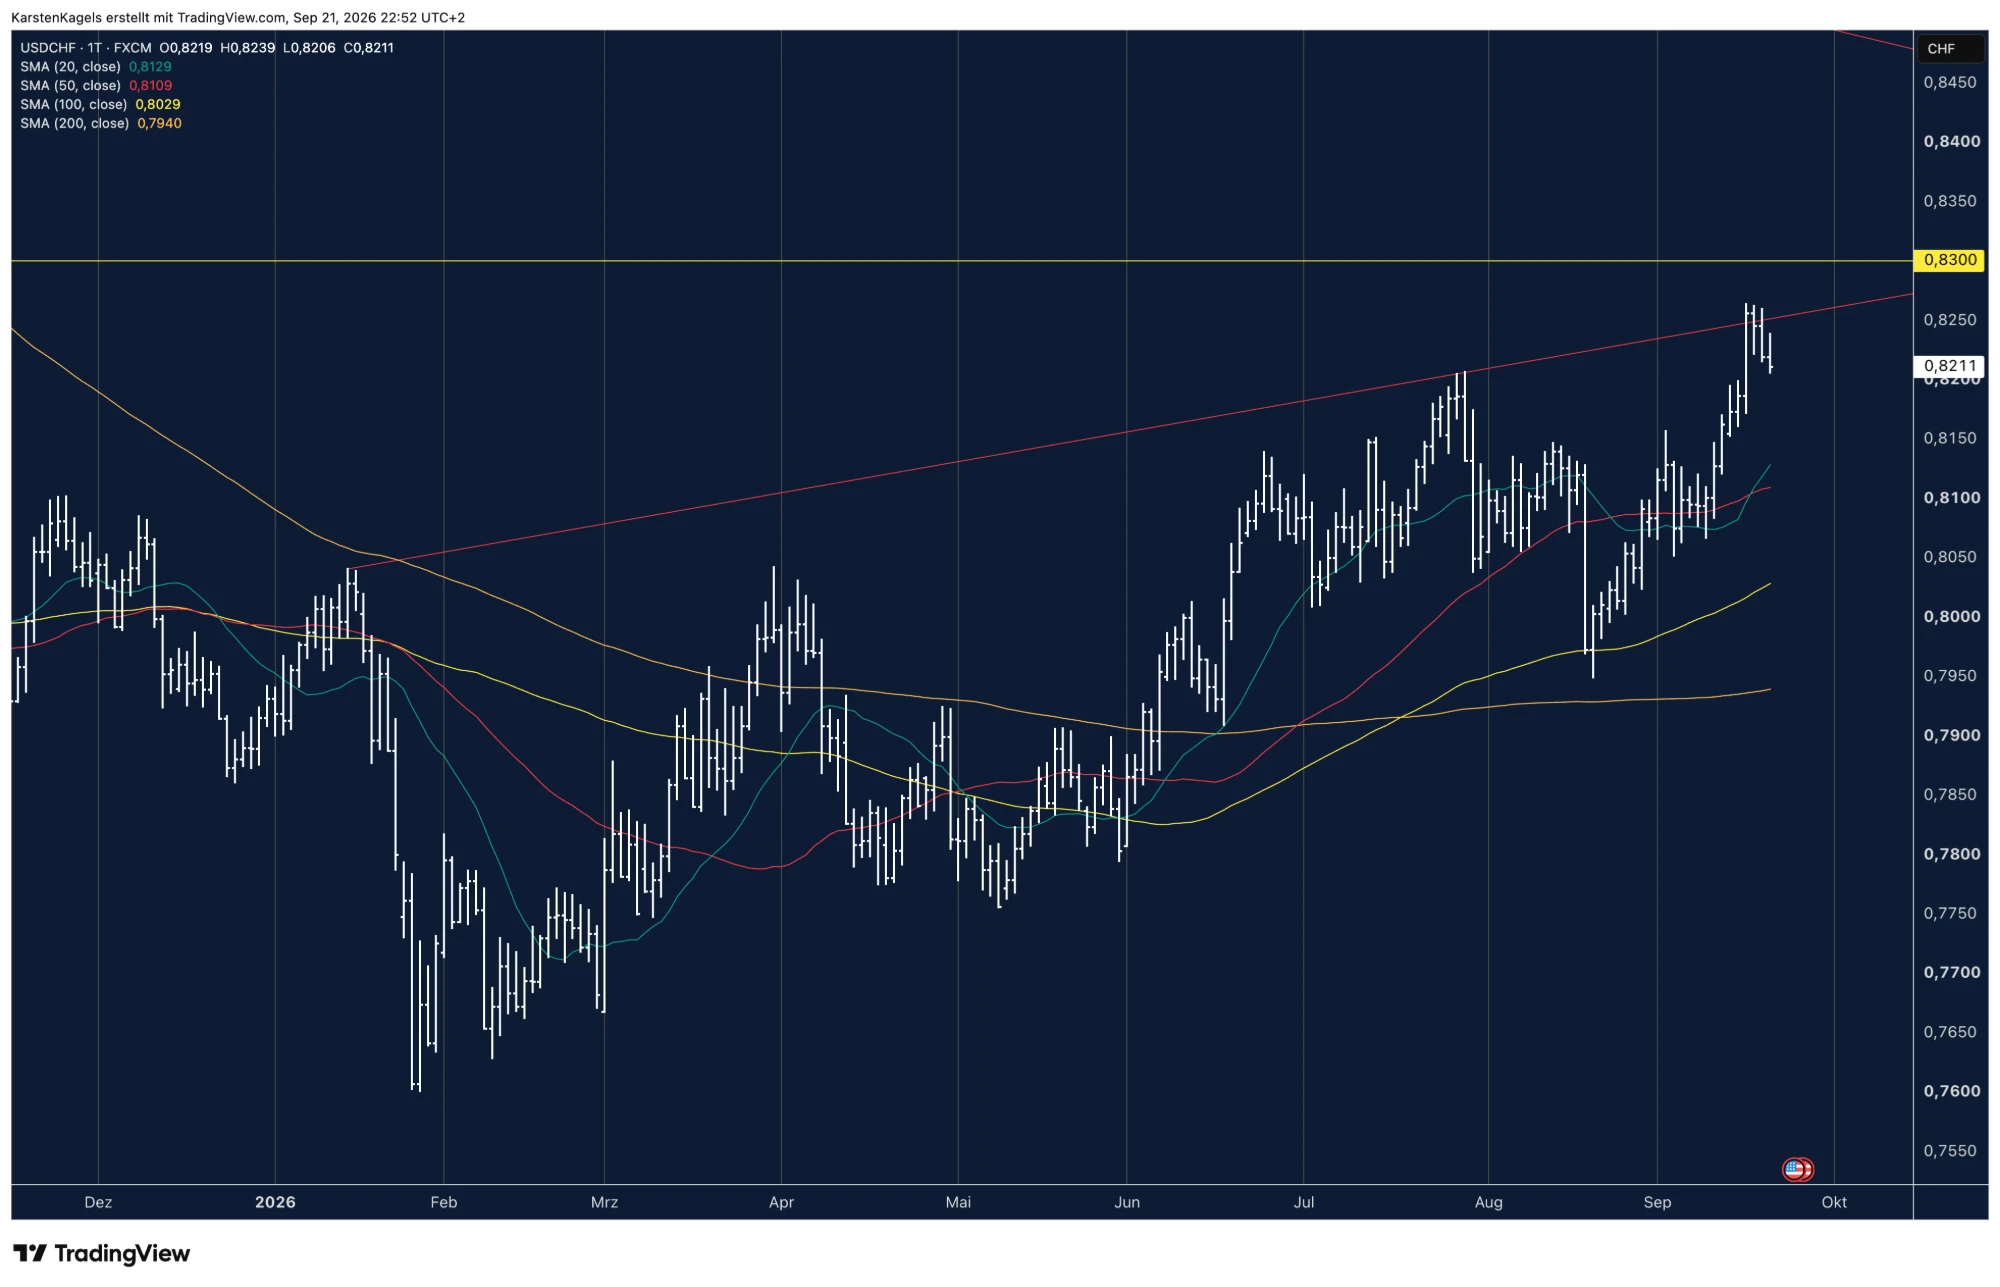
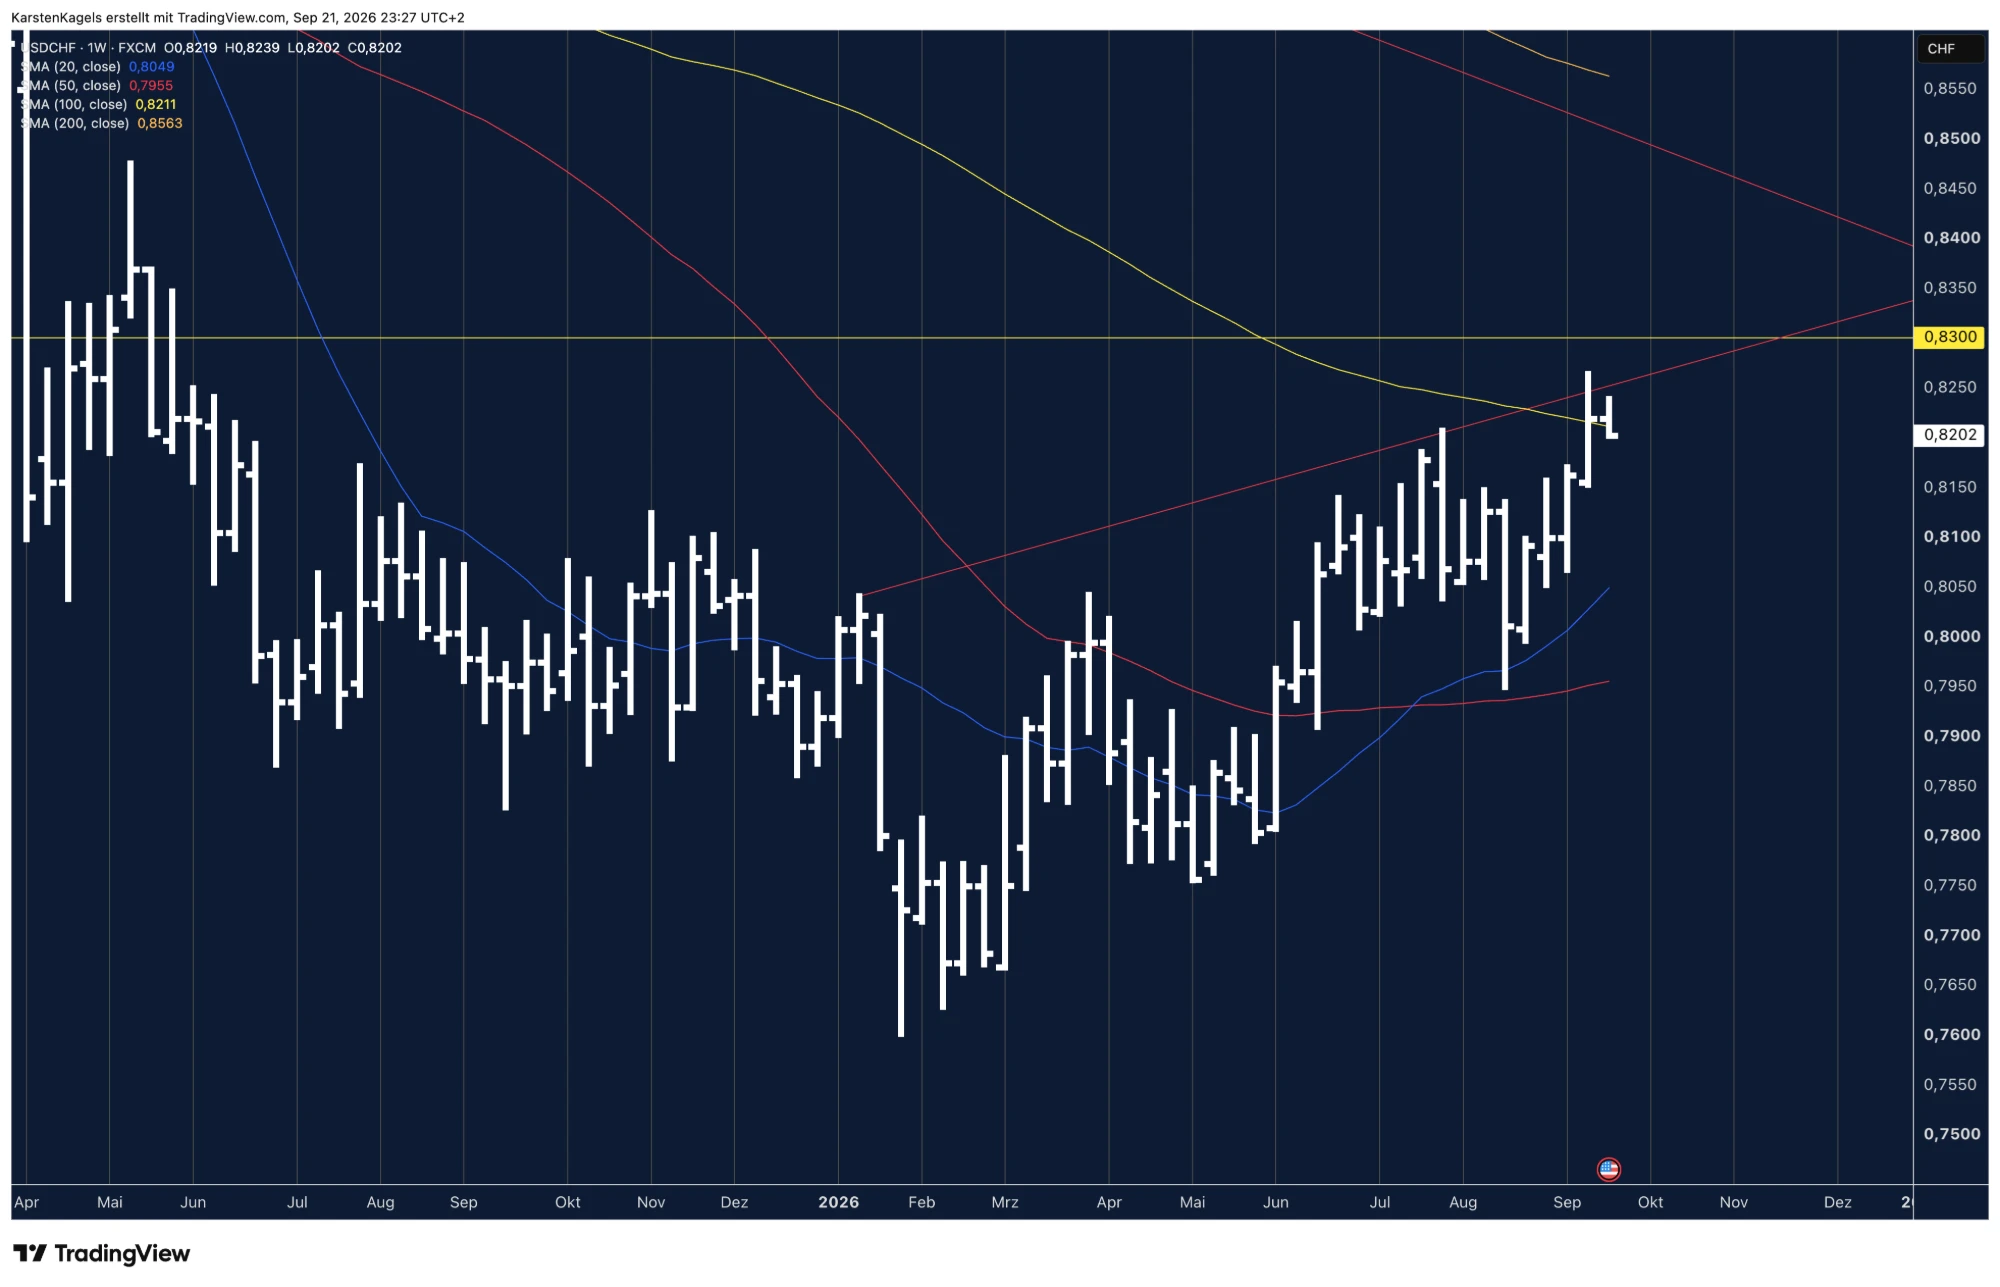
- In September the rate won for the first time in a long while. The jump to
the high of the year fell exactly on the day of the Fed decision. Whether more
follows is decided at 0.8300.
- Interventions by the SNB: in its policy assessment of 18 June 2026 the
bank left its policy rate at 0.00% and repeated its raised willingness to
intervene on the currency market, in order to slow a rapid and excessive
appreciation of the franc. For inflation it expects 0.6% in 2026 and 2027
and 0.7% in 2028. That projection rests on the assumption that the policy
rate stays at zero over the whole period. Such interventions cannot be
predicted and are the single biggest risk in this pair.
The next dates. The SNB publishes its next policy assessment on
24 September 2026 at 09:30 Central European Summer Time, the one after that
on 10 December. The Fed meets again on 27 and 28 October.
What banks expect for USD/CHF
Swiss institutions publish exchange rate forecasts regularly. The overview below
collects what was published most recently.
| Source |
Expectation |
As of |
| UBS (survey of Swiss companies) |
0.78 for the end of 2026 |
10 February 2026 |
| Schaffhauser Kantonalbank |
0.80 over three months, 0.78 over twelve months |
3 September 2026 |
| Traders Union |
0.8444 as the projected average in December 2026 |
retrieved 21 September 2026 |
| Finanzradar |
0.84 for the end of 2026 |
31 August 2026 |
The expectations differ widely. The table combines a company survey, a bank
forecast, a statistical model and a technical assessment. The dates and the
forecast horizons differ as well. From these figures it cannot be derived how
much the Fed decision changed expectations.
How reliable such forecasts are shows in one example from the same table. On
3 September the Schaffhauser Kantonalbank wrote that it considered rate
increases by the Fed unlikely, as long as inflation did not pick up clearly
again. Thirteen days later the Fed raised. That is not a reproach against the
bank, it is the normal case: forecasts depend on assumptions and can be overtaken
by new data or by monetary policy decisions. Use the numbers as a mood picture,
not as a price target.
Frequently asked questions about the USD/CHF forecast
What is the USD/CHF forecast for 2026?
The picture has turned from neutral to friendly. On 21 September 2026 USD/CHF
stood at 0.8211 and trades above all four moving averages on the daily chart.
The decisive resistance is 0.8300. The published expectations lie far apart: the
UBS company survey names 0.78 for the end of 2026, Finanzradar 0.84. The
Schaffhauser Kantonalbank expects 0.80 over three and 0.78 over twelve months.
Traders Union calculates an average of 0.8444 for December 2026.
Why did USD/CHF rise in September?
Because the Fed raised and the SNB did not. On 16 September 2026 the US central
bank lifted its target range to 3.75 to 4.00%, the first increase since
July 2023. The rate advantage of the dollar grew to about four percentage
points, and the price jumped to the high of the year on the same day.
How high are the policy rates in the United States and Switzerland?
The gap is about four percentage points. The Fed has held its target range at
3.75 to 4.00% since 17 September 2026. The Swiss National Bank stands at 0.00%
and therefore still avoids negative rates. Its next policy assessment is due on
24 September 2026.
Can the SNB influence the rate?
Yes, and it has said so. In its policy assessments the SNB regularly repeats a
raised willingness to intervene on the currency market when the franc
appreciates too fast. A change of monetary policy can also trigger strong moves:
after the surprise end of the euro minimum exchange rate on 15 January 2015,
USD/CHF broke down within minutes.
Is the Swiss franc a safe haven?
Yes. In times of crisis capital flows into Switzerland, because the country is
seen as politically and economically stable and its central bank as reliable.
That demand lifts the franc and pushes the USD/CHF rate down. This is exactly
why the pair often does not rise in periods of stress, even though the US dollar
counts as a refuge currency too.
How can USD/CHF be traded?
Through foreign exchange brokers or derivatives. The pair is one of the major
currency pairs and the spreads are tight. Because of the intervention risk,
every position needs a stop.
This forecast is translated from the German edition on kagels-trading.de.
How our forecasts are made and reviewed: How we work.