Table of Contents
Anzeigen
Long-Term EUR/CHF Analysis and Forecast
Chart Overview
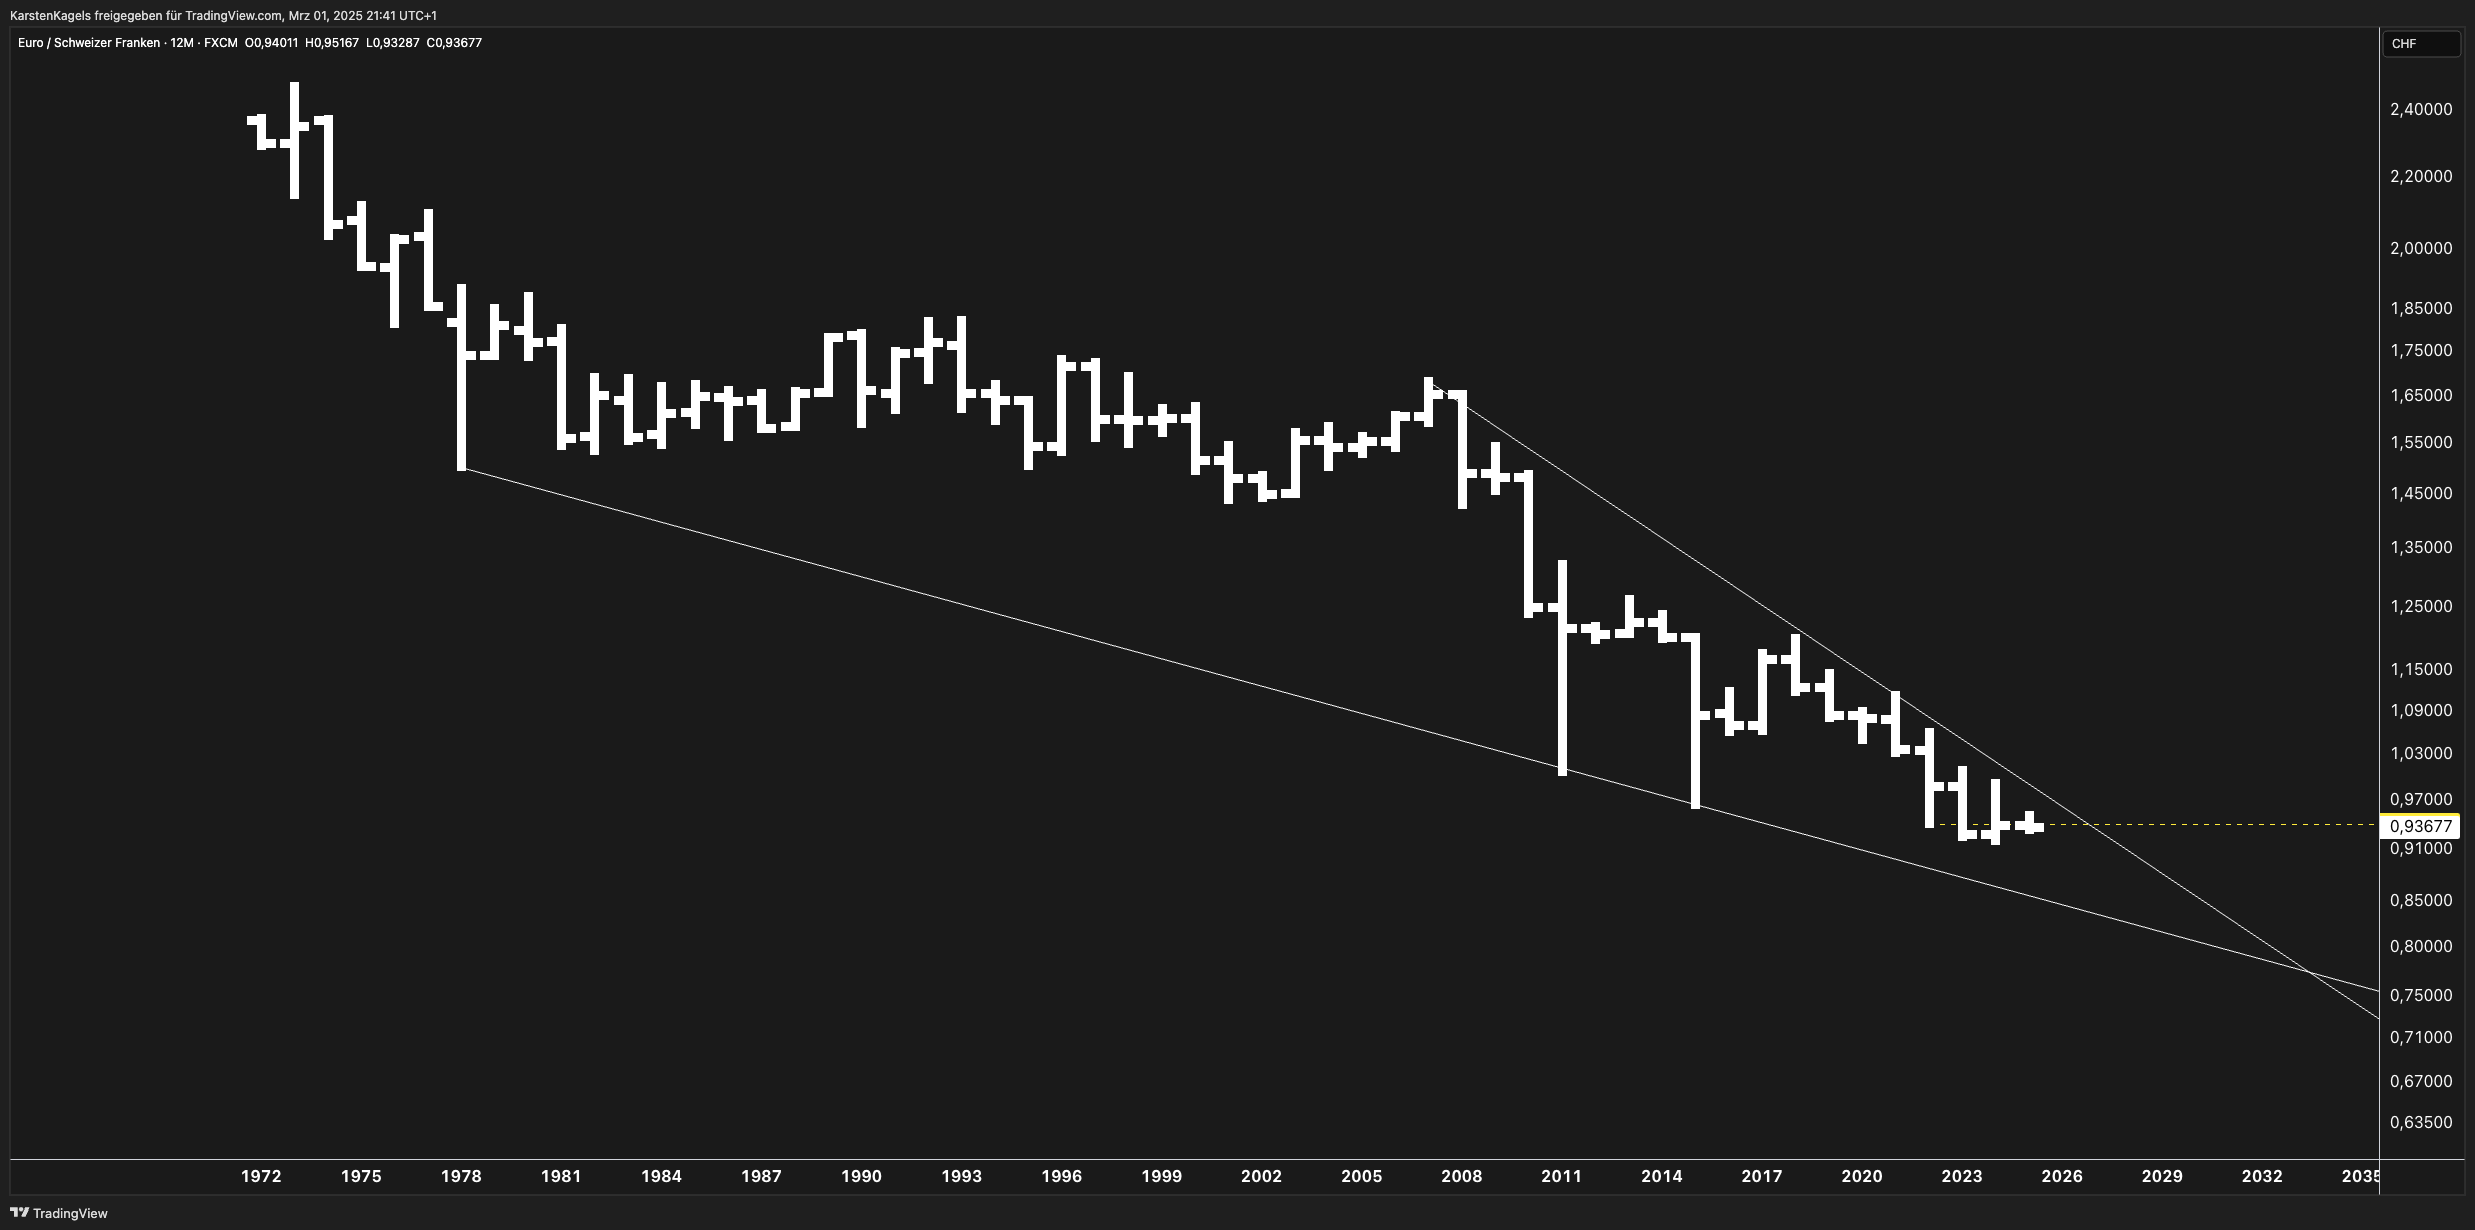
The EUR/CHF yearly chart shows a long-term downtrend that has been persisting since the early 1970s. The pair has been making lower highs and lower lows, respecting a descending wedge pattern with well-defined trend lines.
Key observations:
- Strong Downtrend: The EUR/CHF has been steadily declining, with occasional corrections, but the general direction remains bearish.
- Descending Wedge Formation: The price is converging within a narrowing wedge, which is often a sign of potential breakout scenarios.
- Long-Term Support & Resistance:
- The lower boundary of the wedge, acting as long-term support, is nearing a critical zone around 0.80 – 0.85.
- The upper boundary of the wedge, acting as resistance, has capped any significant bullish reversals.
Potential Scenarios
- Bearish Continuation (Most Likely)
- If the price remains within the wedge and continues to respect the trendline, a breakdown could see EUR/CHF testing 0.85 – 0.80 in the coming years.
- This would align with the long-term bearish trend and the weakening euro against the Swiss franc due to economic and monetary policy divergences.
- Breakout Reversal (Less Likely but Possible)
- A bullish breakout above the upper wedge trendline (above 1.00) could trigger a trend reversal.
- This would require significant macroeconomic shifts, such as changes in SNB or ECB policy, to support a prolonged euro appreciation.
Conclusion
The EUR/CHF remains structurally weak, with a high probability of further depreciation. The descending wedge suggests a decisive move in the next few years, with a bearish breakdown more likely unless macroeconomic conditions drastically shift. Traders and investors should monitor key levels around 0.90 (current support), 0.85 (long-term support), and 1.00 (breakout resistance).
Latest posts by Karsten Kagels (see all)
- Gold (XAU/USD) Forecast April 2025: Price Targets & Expert Assessment - April 5, 2025
- ETH/USD Forecast April 2025: Price Targets & Expert Assessment - March 29, 2025
- BTC/USD Forecast April 2025: Price Targets & Technical Analysis After New ATH - March 29, 2025