Table of Contents
Anzeigen
Introduction
The GBP/USD price forecast is a critical topic for forex traders and long-term investors. As one of the most actively traded currency pairs, GBP/USD—also known as “Cable”—is influenced by a complex mix of macroeconomic factors, central bank policies, and technical trends. This article provides an in-depth analysis of GBP/USD’s potential price movements, covering short-term, medium-term, and long-term outlooks.
Historical Performance and Key Support/Resistance Levels
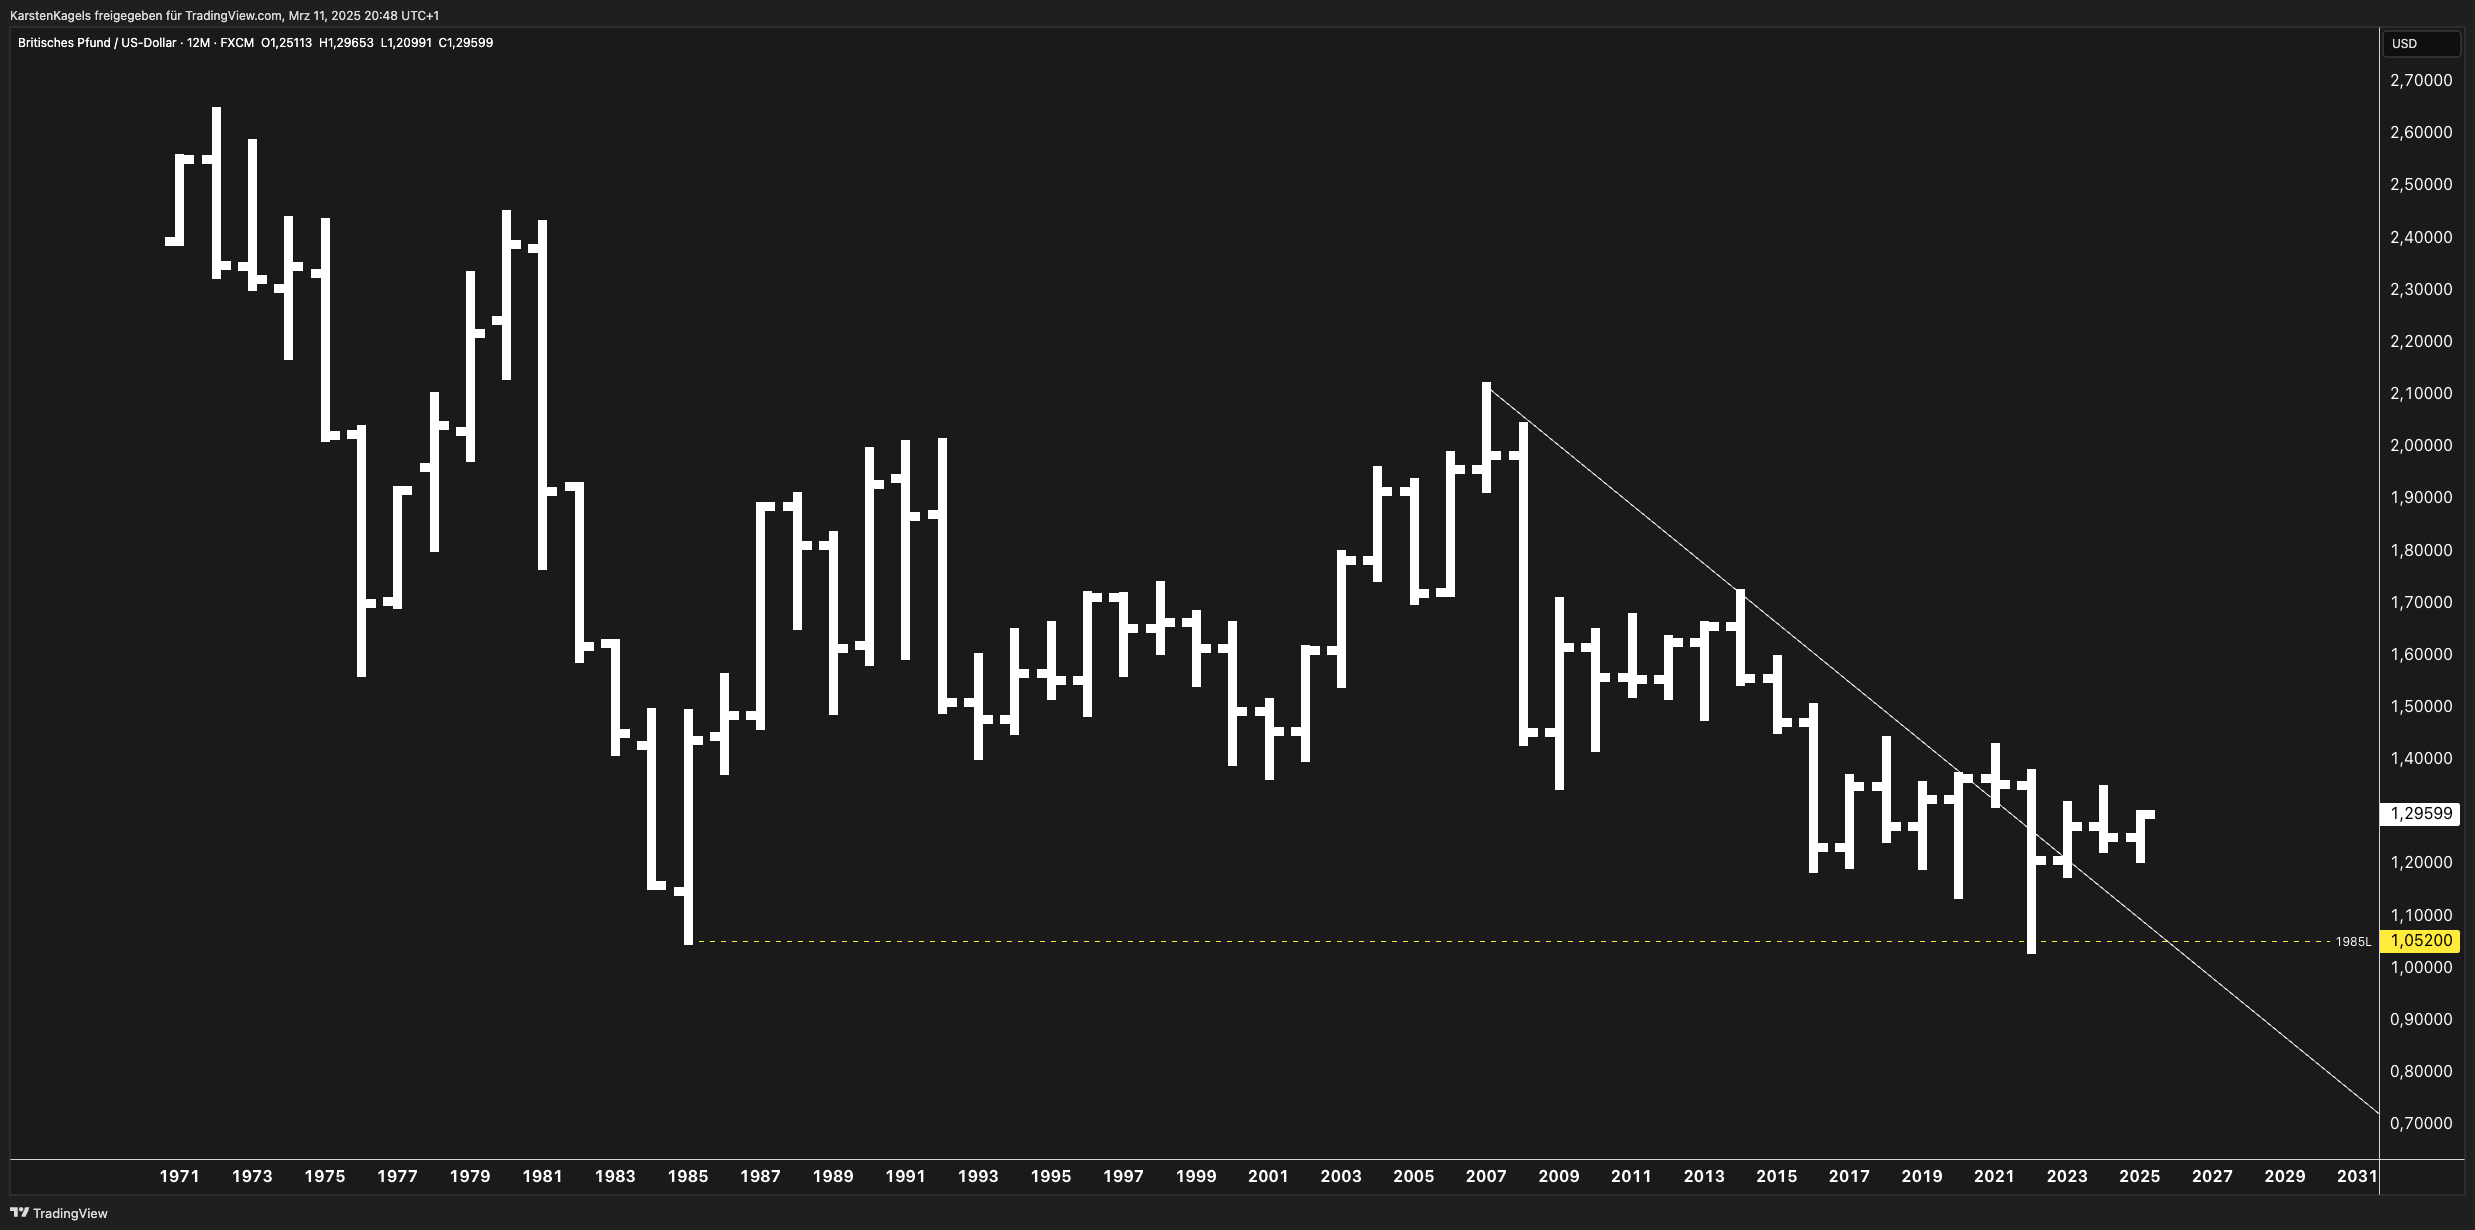
Long-Term GBP/USD Trends
- All-time high: ~2.70 (1970s)
- 1985 Low: 1.052 (historical support)
- 2007 High: 2.11 (pre-financial crisis peak)
- 2022 Low: 1.03 (post-Brexit and Fed tightening)
- Current Price: ~1.29 (as per latest chart)
Key Technical Support & Resistance
- Resistance Levels: 1.30, 1.35, 1.42
- Support Levels: 1.20, 1.10, 1.052 (1985 low)
- Trendline Analysis: The long-term downtrend from 2007 remains intact, but GBP/USD is testing a key breakout zone.
Technical Analysis: Indicators & Patterns
1. Fibonacci Retracements & Moving Averages
- The 61.8% Fibonacci retracement from the 2007 peak suggests a major resistance zone near 1.42.
- The 200-month moving average (MA) sits around 1.30, making it a pivotal level.
2. RSI & MACD Analysis
- Relative Strength Index (RSI): GBP/USD is neither overbought nor oversold but shows signs of bullish divergence.
- MACD (Moving Average Convergence Divergence): Recently turned positive, indicating a potential trend shift.
3. Elliott Wave & Wyckoff Patterns
- GBP/USD appears to be in Wave 3 of a potential long-term bullish reversal, but confirmation is needed above 1.35.
Macroeconomic Factors Affecting GBP/USD
1. Interest Rate Differentials: Fed vs. Bank of England
- The Federal Reserve’s rate hikes have strengthened the US Dollar, but easing expectations in 2025 could weaken the USD.
- The Bank of England (BoE) has been slower in policy shifts, but inflation data will determine the next steps.
2. Inflation & Economic Growth
- UK Inflation: Persistently high, but showing signs of easing.
- US Inflation: The Fed’s aggressive stance has tamed inflation but slowed economic growth.
3. Brexit Aftermath & UK Economic Stability
- Post-Brexit trade imbalances still weigh on GBP.
- GDP growth in the UK lags behind the US, limiting GBP’s strength.
4. US Dollar Index (DXY) Correlation
- If the DXY weakens, GBP/USD could rally towards 1.35-1.40.
- If risk aversion increases, the USD remains a safe-haven currency, pushing GBP/USD lower.
Comparative Analysis: GBP/USD vs. Other Assets
1. GBP/USD vs. EUR/USD & USD/JPY
- GBP/USD and EUR/USD generally move together, but GBP has higher volatility.
- USD/JPY often moves inversely to GBP/USD due to its sensitivity to US interest rates.
2. GBP/USD vs. Gold & S&P 500
- Gold (XAU/USD) tends to rise when GBP/USD falls due to risk-off sentiment.
- S&P 500 correlation: A strong equity market can support GBP/USD, while a downturn could weaken it.
Probability-Weighted Forecasts
Short-Term (Next 3-6 Months)
- Bullish Scenario (40%): GBP/USD breaks 1.30, targets 1.35 if BoE turns hawkish.
- Neutral Scenario (30%): GBP/USD consolidates between 1.20 and 1.30.
- Bearish Scenario (30%): If global risk-off sentiment rises, GBP/USD could retest 1.15.
Medium-Term (1-3 Years)
- Bullish (45%): GBP/USD heads towards 1.42 if UK economy stabilizes.
- Neutral (35%): GBP/USD ranges 1.25-1.35.
- Bearish (20%): A global slowdown drags GBP/USD below 1.10.
Long-Term (5-10 Years)
- Bullish (50%): GBP/USD reclaims 1.50 in a strong economic cycle.
- Neutral (30%): GBP/USD stabilizes between 1.30-1.40.
- Bearish (20%): Prolonged stagnation keeps GBP/USD under 1.20.
Conclusion: Is GBP/USD a Buy or Sell?
- Short-term traders: Watch the 1.30 breakout level and RSI signals.
- Long-term investors: Accumulating near 1.20 could provide strong returns if UK fundamentals improve.
- Risk Factors: US recession, UK economic slowdown, or unexpected geopolitical risks.
FAQs
1. Will GBP/USD go up or down in 2025?
- GBP/USD could rise toward 1.35-1.40 if rate differentials favor GBP, but a risk-off environment could send it back to 1.20.
2. What is the long-term forecast for GBP/USD?
- Long-term projections suggest a range of 1.20-1.50, with economic stability in the UK playing a key role.
3. How does the US Dollar Index (DXY) affect GBP/USD?
- A weaker DXY supports GBP/USD, while a strong DXY puts downward pressure on the pair.
Latest posts by Karsten Kagels (see all)
- Gold (XAU/USD) Forecast April 2025: Price Targets & Expert Assessment - April 5, 2025
- ETH/USD Forecast April 2025: Price Targets & Expert Assessment - March 29, 2025
- BTC/USD Forecast April 2025: Price Targets & Technical Analysis After New ATH - March 29, 2025