Software comparison – Which is the best? In this article we introduce Sierra Chart.
Sierra Chart is professional software that can be used for realtime charting, chart analysis of historical price data and direct trading. In this article I would like to introduce you to the most important features and uses of this affordable and powerful trading software.
Inhaltsverzeichnis
The features of Sierra Chart software

- Complete charting as well as technical analysis functions
- Advanced trading interface
- Unrivaled affordable price structure
- Over 70 indicators and numerous graphic display options
- Change individual chart pages and stock exchanges with the push of a button and thus be constantly informed on current price developments
- Realtime backfill of selected indices, futures and tracking stocks through the SCMagic module
- Data feed with historical EOD charts of all markets worldwide through the SCDownloader module
- Full data connection to Interactive Brokers accounts and with it intraday realtime push charts including backfill through the SCDownloader module
- Spreadsheet function with a direct connection to Microsoft Excel
- Realtime scanning
- High-speed data
Charting & technical analysis
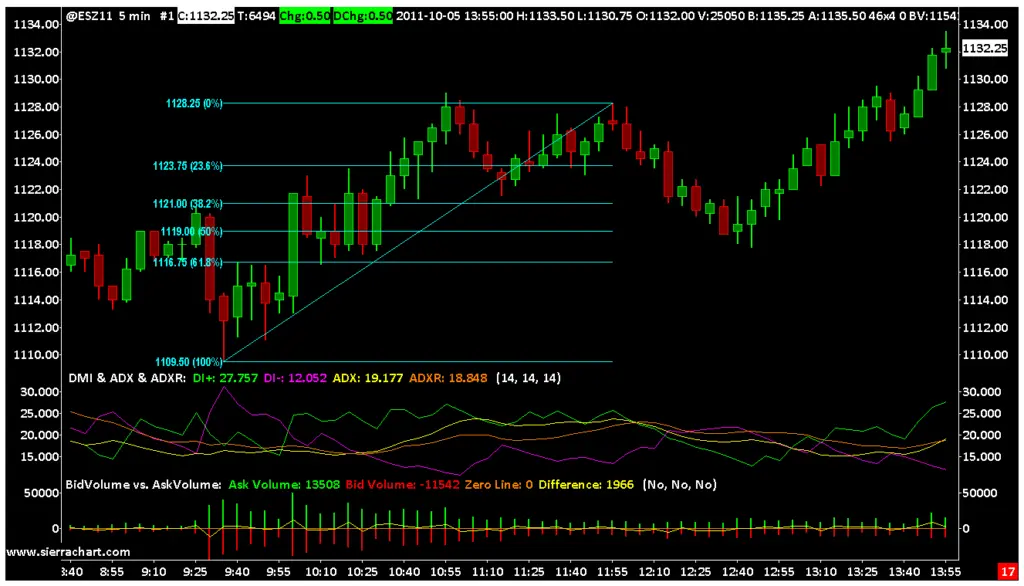
When it comes to charting and technical analysis, Sierra Chart leaves nothing to be desired. Charts for stocks, indices, futures, currencies, etc. can all be displayed.
The time windows are freely selectable starting at one minute. In addition to displaying candlestick charts, line charts, point & figure and OHLC charts are all available. You also have the option to bring up any number of charts simultaneously and put together any number of charts in personal chart books. The chart books can be switched with the push of a button.
In addition to the most common charts, you can also display footprint charts and the market profile.
Charts and templates can be individually designed and saved. Upper and lower limit values can be defined and chart grids can be switched on or off.
You can have both the trading volume and the open interest displayed graphically. The trades per tick can also be displayed in the chart.
All drawing tools, such as Fibonacci, trend lines, etc., are included for analysis.
There are more than 70 different indicators included, such as:
- ADX
- ARMS Ease Of Movement
- Bollinger Bands
- Candlestick Formation Finder
- Fast Stochastic
- Island Reversal
- MACD
- Momentum
- Money Flow
- Moving Average
- Number Of Trades
- OBV On Balance Volume
- Open Interest
- Pivot Points
- Slow Stochastic
- Volatility – Chaikin’s
- u.v.m.
Per chart, any number of technical indicators can be displayed. These can also be individually edited and saved.

Spreadsheets & scanning
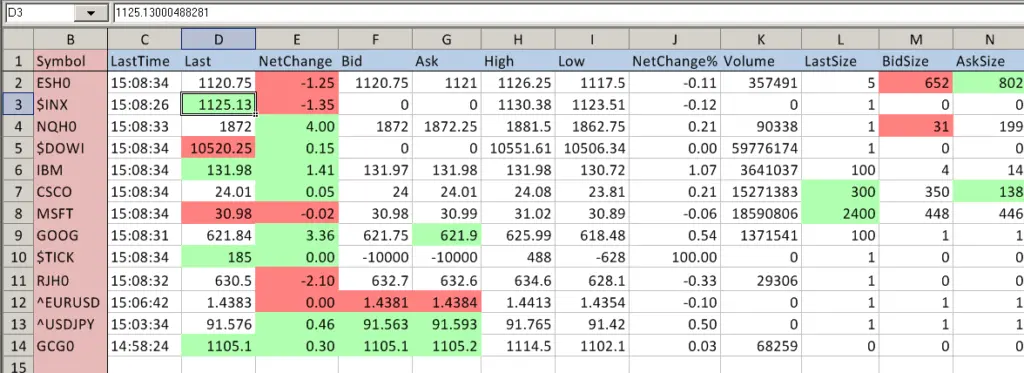
With the spreadsheet, data can be displayed in an Excel sheet. The spreadsheets support the same formulas as Excel. Data can also be exported or displayed in Excel, which is very useful. There is also an alarm function for when defined signals are reached and the option of realtime scanning.

Trading
With Sierra Chart you can also trade directly from the software.
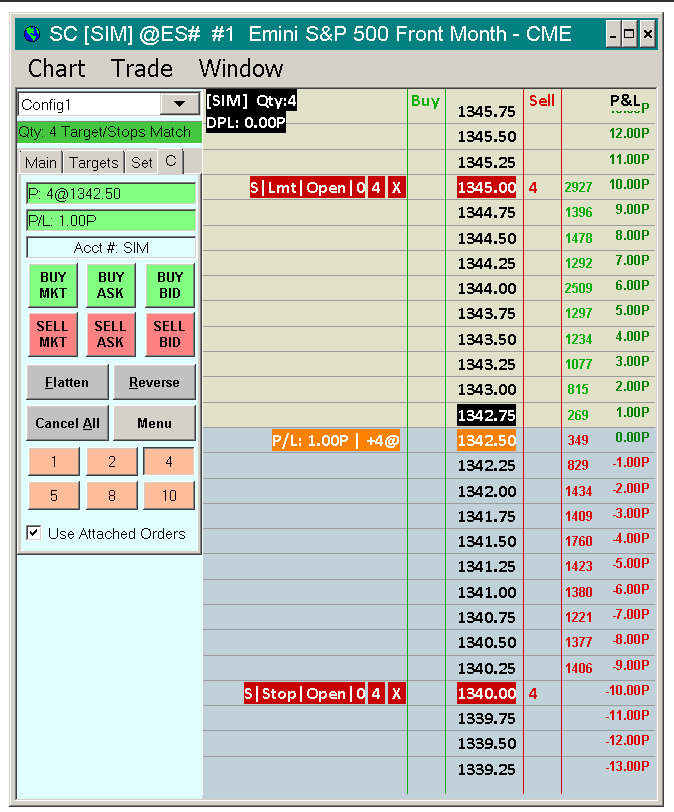
Order placement can either be placed directly via the chart or the order book. In addition, alarms can be linked to orders, which I find very useful. In principle, though, this is nothing more than a limit-stop order. Orders can also be placed via lists and order tickets. The order placement buttons are included in most of the Sierra Chart windows.
Changing the order, closing the position and deleting the order can be done quickly and easily at any time with just a click. Targets and stop orders can also be placed.
Another highlight is that the order can also be linked to lines in the chart and current positions as well as the history can be displayed in the chart.
You can also configure order templates yourself, which I find very useful. This allows you to create different order templates for different markets and/or trading strategies.
All orders are shown in the order list. There are several tabs to choose from in the list. You can put together the columns in the order list yourself. The development of trading activities and open positions can be seen very clearly in the portfolio.
Broker & data
SierraChart offers the broker Interactive Brokers. Anyone who knows Interactive Brokers knows that TWS (software from Interactive Brokers) is not exactly advantageous, so this problem can be solved by connecting Sierra Chart with Interactive Brokers.
Data for Forex, CFD, stocks and futures are made available directly without the need for an external data provider. This also applies to historical data, which are very extensive. In addition, all leading data providers are also offered. The following data providers are currently available:
- CTS T4
- TransAct
- FXCM
- LMAX
- Rithmic Trading
- CQG
- BitMEX
- GAIN Capital (OEC Trader)
- TD Ameritrade
- Interactive Brokers
- TeleTrader
- DTN IQ Feed
- Trading Technologies
- Open Specification Data
Price of Sierrachart software
Sierra Chart is very cost effective. There are two different software packages. Data can be purchased additionally.
The standard service package costs $24 a month. This contains all functions except those included in the advanced features.
The advanced features package costs $33 a month and contains the following features in addition to the functions of the standard service package:
- TPO chart study
- Numbers bars
- Numbers bars calculated values
- Market depth historical graph
- Volume profile interactive drawing tool
- More historical data with the Sierra Chart Historical Data Service
With a longer term, the monthly costs are discounted:
There is no option to purchase a lifetime license.
Support
There is a very extensive manual, as well as various options for contacting support. In addition to the online support, there is also telephone and remote support. However, these cost $0.75 a minute.
Conclusion of this article on Sierra Chart trading software
Sierra Chart has all the tools you need to trade and analyze. The range of functions is extremely extensive.
Due to the extremely low monthly price, Sierra Chart is the most cost effective of all charting software worldwide.
Operating and using the software takes a lot of getting used to. But, if you are willing to spend some time understanding how to use the software and, if necessary, do some research in the various forums, you will get a very good trading platform at an unbeatable price.
Read more:

