In this article, I’d like to introduce you to one of the most important concepts in trading – momentum. Many of the best traders in the world use a momentum strategy and achieve excellent returns every year.
Inhaltsverzeichnis
What is momentum trading?
Momentum can be signaled by several price candlesticks. Looking at a chart, you’ll typically see a series of large candlesticks, a series of candlesticks that are getting larger, or several bullish/bearish candlesticks. Large candlesticks with a small wick or no wick at all are often called “high momentum candles.”
Momentum refers to the acceleration of a price movement. When the speed or strength of a price movement intensifies, we refer to it as “increasing momentum.”
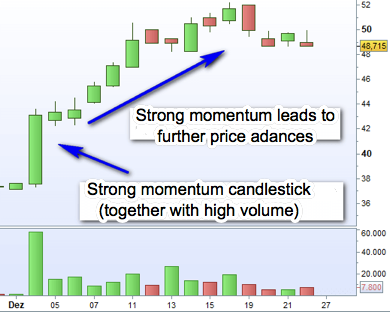
The chart of Dr. Hoehnle stock (above) shows a nice bullish momentum candlestick.
This long candlestick has a significantly wider price range than the candlesticks preceding it. In addition, the volume was significantly higher than average.
High momentum combined with heavy volume, which drives price, is a good indication that momentum will continue. As you can see in the example, this turns out to be true. As long as the price action continues printing bullish candlesticks, there’s no reason to close a position, particularly in momentum trading. Momentum candlesticks often mark the start of a major trend.
Especially after the release of important news and the formation of a high-volume momentum candlestick, momentum will often continue and a trend will establish itself. These inflection points in the chart are called pivotal news points.
Pivotal news points reflect changes in the growth prospects of a company. The interest of a growing number of investors is awakened and stock analysts begin adjusting their ratings and price targets. Relevant fundamental news such as this often marks the beginning (or the end) of a trend.
Jesse Livermore was a momentum trader
Jesse Livemore, one of the most famous stock market speculators of all time, was a momentum trader.
He favored the following strategy:
He first identified stocks that gapped up on news and formed a large momentum candlestick with high volume. The gap opening represents the pivotal news point. Livermore purchased the stock if the price held above this point and then broke out to a new high. This strategy still works today.
Here is an example with Apple stock:

After news was released, Apple shares opened with an up gap and formed a momentum candlestick.
The stock consolidated for a while and then broke out to the upside.
It’s even better when the stock first dips below the low of the pivotal point day (taking out the stops and shaking other traders out of the market) before breaking out to a new high. This is a simple but effective setup for momentum traders.
Following in Jesse Livermore’s footsteps, a number of well-known traders use momentum strategies today.
The best momentum traders today
The four best-known momentum traders today are:
- Mark Minervini returned 36,000 percent in six years.
- David Ryan generated a total return of 1,379 percent.
- Dan Zanger turned $11,000 into $18 million in less than a year.
- Mark Ritchie II has generated a total return of 1,000 percent since 2010.
Mark Minervini’s SEPA strategy
Mark Minervini calls his strategy “SEPA” (specific entry point analysis). This approach, which he developed himself, uses quantitative screening, fundamental research, and qualitative analysis to identify stocks with the potential for high gains.
If you want to screen stocks that meet these criteria, you should proceed as follows: first screen for fundamentals to filter stocks according to criteria such as earnings, sales, and margin growth. Then add moving averages (MAs) to identify stocks that are trending upward in all important timeframes. You should work with the three best-known and most important moving averages, the 50, 100, and 200.
Share price > 100 MA and 200 MA; 100 MA > 200 MA; 50 MA > 100 MA and 200 MA.
The longer the 200 MA has been in an uptrend, the better (with a one month minimum). In addition, the stock should be a specific distance from its 52-week low (at least 30 percent) and not too far from its 52-week high (not more than 25 percent).
The CANSLIM Strategy by David Ryan
David Ryan refers to his strategy as CANSLIM.
The approach was originally developed by William O’Neil.
C stands for current earnings per share (EPS). EPS growth should be 25 percent or more and increasing.
A stands for annual earnings. Earnings should have increased by 25 percent or more in each of the last three years.
N stands for new products or services.
There are two factors to consider here:
- The company should be offering a new product or service that will have a significant impact on profits.
- The stock should have broken out to a new high from a sideways phase or consolidation.
S stands for supply and demand. Trading volume should be high or should increase when the stock breaks out to new highs.
L stands for leader or laggard. You should focus on the leading stocks in the top sectors and avoid laggards.
I stands for institutional sponsorship. Ownership by institutional investors should be increasing.
M stands for market indexes. The Dow, Nasdaq, and S&P 500 should all be in an uptrend when you buy stocks.
Dan Zanger is a pure momentum trader
The well-known US trader Dan Zanger trades breakouts from various chart patterns, including the flat channel, the bullish flag, and the cup and handle.
He also keeps his eye on volume, which should be higher than average after a breakout.
If volume doesn’t increase after a breakout, Zanger usually closes his position. After all, no increase in volume is an indication that the breakout will have trouble continuing because no one is interested in owning the stock.
In addition, he concentrates on leading stocks with a high beta factor. His trading style can also be described as swing trading, as he may hold his stocks for longer periods (two to ten weeks). He trades not only stocks but deep-in-the-money call options on the strongest stocks in the world.
He remains inactive in bear markets but trades all the more aggressively in bull markets, sometimes betting 30 percent of his risk capital on a single highly liquid stock.
The momentum strategy of Mark Ritchie II
Mark Ritchie II uses the same approach as Mark Minervini. He is the son of Mark Andrew Ritchie, famous from Trade like a Market Wizard and God in the Pits.
Using Minervini’s strategy, Ritchie II returned 100 percent in six months, winning Minervini’s 2010 Triple-Digit Challenge. He has continued to be successful with the approach, generating a return of 1,000 percent since 2010.
The highly recommendable book Momentum Masters: A Roundtable Interview with Super Traders introduces these four successful momentum traders, who answer more than 130 questions about their trading.
Momentum vs. trend
Although many market participants see “momentum” and “trend” as the same thing, this isn’t necessarily the case – the two should be distinguished. Often, emerging momentum marks the start of a trend or signals its end, but momentum alone has nothing to do with a trend.
For example, strong bearish momentum can occur in an uptrend, but the uptrend may still continue. Here bearish momentum doesn’t represent a trend, but merely accompanies the correction. Trend-followers won’t trade this downward correction, but momentum traders might, as they follow momentum. Of course, your odds increase significantly if you trade with the trend, but if you trade pure momentum, you can also participate in corrections.
You should also keep in mind that the largest gains occur in uptrends. After all, while stocks can fall by a maximum of 100 percent, theoretically they can rise forever.
Tesla stock with momentum trading
Tesla stock offered a nice example of a correction with strong momentum.
Examples of momentum candlesticks in the daily chart of Tesla stock
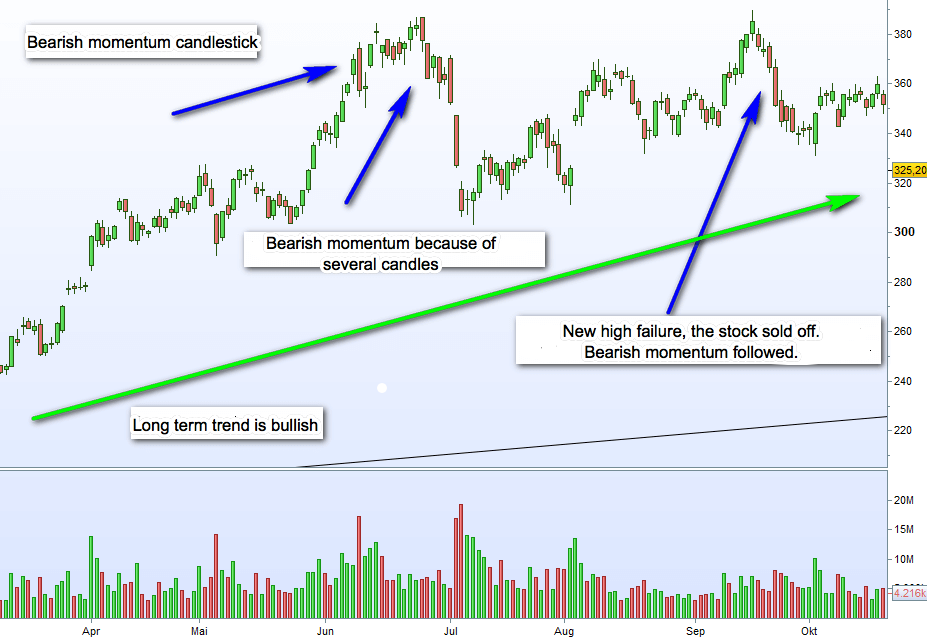
First, a bearish momentum candlestick formed with high volume. However, the upward trend was still intact and even continued. Shortly afterward, the stock made new highs.
But the large red candlestick caused fear among the majority of market participants.
Although the stock made new highs in the uptrend, these were followed by strong bearish momentum. This momentum was signaled not by a single price candlestick but by several bearish candles on high volume days. The investors’ previous fear was confirmed, which led to this strong bearish momentum.
The momentum was bearish, but the trend remained bullish.
Afterward the stock approached its old high but was unable to move above it, thus forming a double top. It sold off again, and new bearish momentum developed (still in the uptrend).
Momentum traders and trend-following traders
Our example shows that you shouldn’t confuse momentum with a trend.
Momentum can coincide with the trend in smaller timeframes, but remain distinct from it in larger one. In addition, momentum and trends can move in the same direction. This often creates better conditions for trading and is favored by many momentum traders. But you should be aware of the difference.
Not every momentum trader is a trend-following trader, but momentum traders earn the largest profits when a strong trend is established by the emergence of momentum. The advantage of a momentum strategy is that you can participate in a price movement early on and have the opportunity to achieve a good return.
Finally, exits are usually clearly defined in momentum trading, as traders expect momentum to continue. If it doesn’t, they exit their trade. This allows them to effectively limit losses, so that even with a low hit rate, their performance is good. Mark Minervini says that he has significantly more losing trades than winners.
Learn: Market Momentum of US stocks in the S&P 500
Momentum trading: conclusion
Momentum trading continues to be one the most successful trading strategies in the world.
There are many successful traders who have achieved or continue to achieve outstanding results with momentum strategies.
The advantage of these strategies is their simple use and easy duplicability and the fact that they work in all markets, including forex. Although momentum trading in the forex market doesn’t use volume as an indicator, the principle is the same.
Read more