Software comparison – which is the best? In this article we introduce MultiCharts.
MultiCharts is a leading trading platform with a wide variety of features.
If you want, you can watch this informative video:
Inhaltsverzeichnis
How did MultiCharts get started?
The company’s beginnings go back to 1999, when Dennis Globa and his friends became interested in Forex trading. At the time, algorithmic trading was still in its infancy and there were only a few platforms that offered algorithmic capabilities.
Globa’s goal was to combine historical third-party data with real-time data. Other platforms didn’t offer this option or depended on a specific data provider. This led to the founding of MultiCharts in 2005.
In 2011, the company developed a web-based version of its software. Now known as TradingView, it’s used by a large number of traders.
What is MultiCharts.net?
MultiCharts.net combines the best features of MultiCharts with the opportunity to program in the languages C# and VB.NET. This makes MultiCharts.net ideal for everyone who wants to use MultiCharts and all its features, but doesn’t want to work with the programming language EasyLanguage.
As a result, there are currently two versions of MultiCharts:
- MultiCharts – uses the programming language PowerLanguage (an enhancement of EasyLanguage)
- MultiCharts.NET – allows you to program in the languages C# and VB.NET
Which brokers are compatible with MultiCharts?
MultiCharts is currently compatible with 29 brokers. It is also possible to integrate several brokers at the same time.
The following brokers are supported:
- CQG
- Interactive Brokers
- Oanda
- Trading Technologies
- GAIN Capital
- Rithmic
- Dukascopy
- LMAX
- Discount Trading
- IW Bank
- Advanced Futures
- AMP
- AVA Trade
- Apex Futures
- Cannon Trading
- Eminis Trader
- Fxmtf
- MB Trading
- Futures Online
- Optimus
- Patsystems
- Stage Five
- TradeNode
- TradePro
- GFF Brokers
- Trade Futures 4 Less
- High Ridge
- Webankit
- Zaner
Multicharts as a trading platform
MultiCharts offers a wide range of features, including chart analysis, the development of trading systems, and the Portfolio Trader.
Chart Analysis
MultiCharts is one of the leading trading platforms for chart analysis.
It offers all the common technical analysis tools.
The following chart types are available:
- Candlesticks
- Time Price Opportunity (TPO)
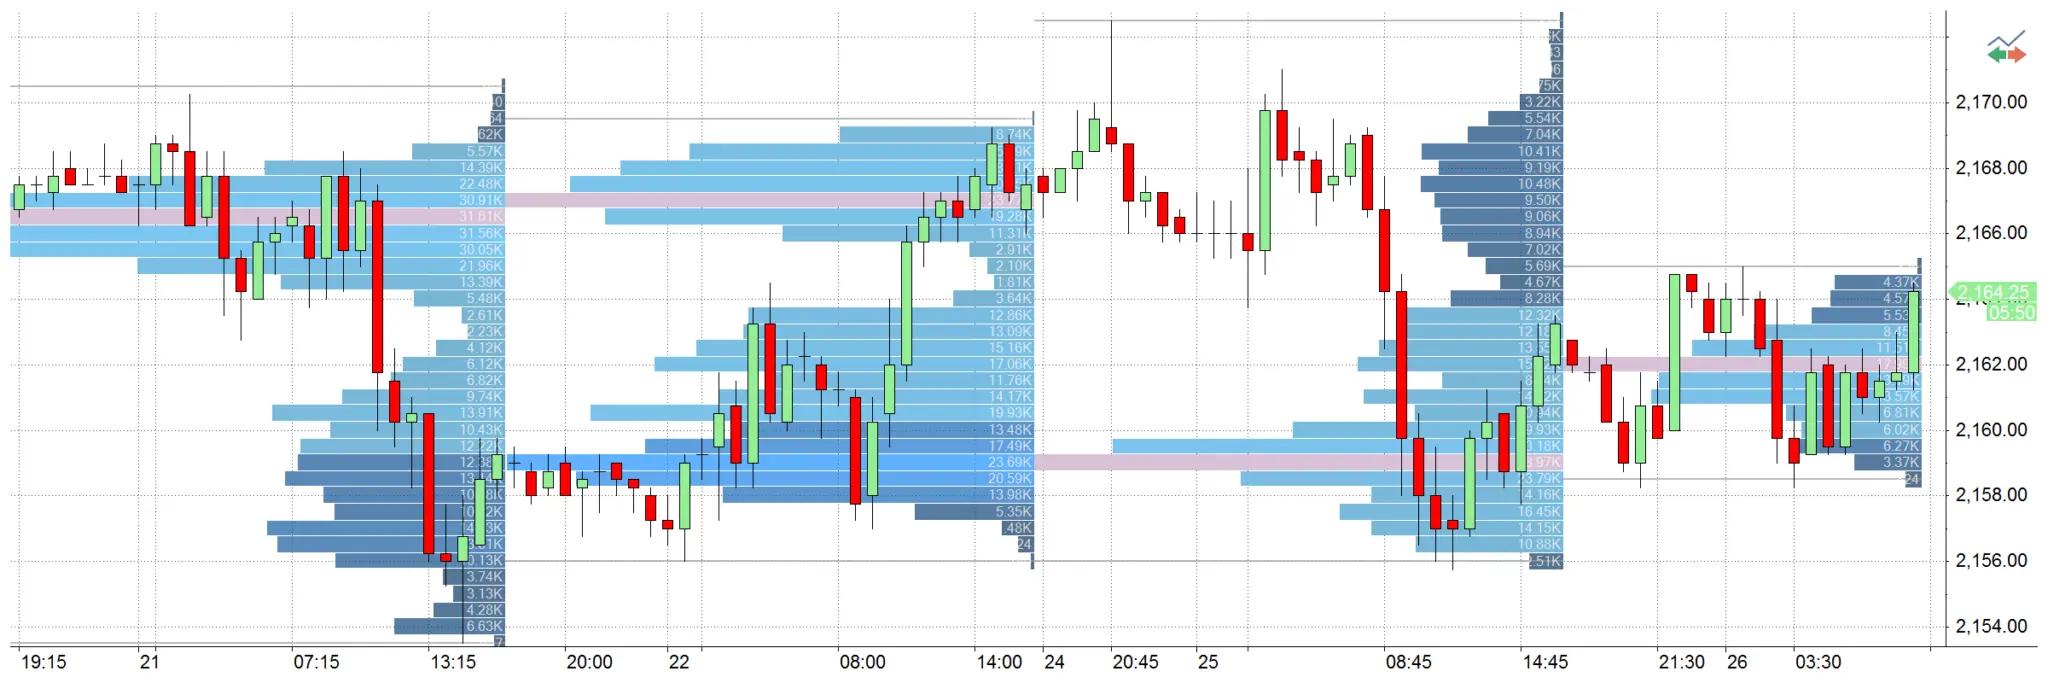
- Volume Delta
- Volume Profile
- OHLC
- Point and Figure
- Renko
- Kagi
- BetterRenko
- 3 Line break
- Heiken-Ashi
- Cumulative Delta
- Hollow Candlesticks
- Candlesticks with border
- HLC
- Invisible Bars
- Dots
- Line on Close
- Symbol Chart
- Histogram chart
- FlexRenko
- Reversal Bar
- Imbalance Delta
Volume analysis is also possible.
You can trade directly from charts. All the usual features and order types are available.
The platform offers a wide range of drawing tools, from trend and support lines to pivots and channels.
The following drawing tools are currently included:
- Andrews‘ Pitchfork
- Fibonacci Speed/Resistance Arc
- Fibonacci Speed/Resistance Fan
- Fibonacci Retracement
- Fibonacci Trend-Based Time Lines
- Fibonacci Time Zones
- Gann Fan
- Gann Square
- Trend line
- Extended Line
- Ray Line
- Text
- Retracement Calculator
- Ellipse
- Rectangle
- Extended Parallel Lines
- Ray Parallel Lines
- Parallel Lines
- Horizontal Parallel Lines
- Horizontal Line
- Regression Channel – Segment High-Low
- Regression Channel – Standard Deviation
- Regression Channel – Raff Regression
- Regression Channel – Standard Error
- Arc
In addition, over 200 indicators are available:
- Accum Distribution
- AccumSwingIndex
- ADX
- ADXR
- Average Price
- Average True Range
- Bollinger Bands
- CCI Average
- Chaikin Oscillator
- Comm Channel Index
- Comm Sel Index
- Custom 1 Line
- Custom 2 Line
- Custom 3 Line
- Custom 4 Line
- Day Close
- Detrended Price Osc
- DMI
- Ease of Movement
- Extreme Profit Accum
- Gapless Bar Chart
- High
- HPI
- Keltner Channel
- Low
- MACD
- Mass Index
- Momentum
- Money Flow
- Mov Avg 1 line
- Mov Avg 2 Line
- Mov Avg 3 Line
- Mov Avg Weighted
- On Balance Volume
- Open, Open Interest
- Parabolic
- Pcnt Chng 1 Data-Cum
- Price Channel
- Price Oscillator
- Rate of change, Stochastic – Fast
- Stochastic Classic
- Swing Index
- TRIX
- TypicalPrice
- Ulcer Index
- Ultimate Oscillator
- Volatility
- Volume
- Volume Oscillator
- Volume ROC
- Weighted Close
- Williams Acc-Dis
In addition to indicators, the platform contains a variety of predefined technical analysis signals:
- 1-2-3 Reversal
- 1st Hour Breakout
- Atlant IfThenElse
- Atlanta Points
- Atlanta System
- Atlanta System ADX, Bail1 for Daily
- Bottom Fishing, Buy Mon Sell Mon
- Confluence, Counter Atlanta
- Derivative Moving Average
- Elliott Wave System,
- Exiting Partially
- First 2 Hour Channel
- Force Index System, Mark
- Mon. or Tues. Buy
- Mov Avg – Supp/Res
- Mov Avg X 2-20
- MovAvg Adaptive Fltr, NMP System
- OBVDI, Oddballvar 1.2
- Price Vol System
- RangeBreakout
- Season Trading
- Sharpe Demo
- Simple Futures MA
- Stochastic S&C
- Support-Resistance
- TFS Signal
- TRIX System S&C
- TSF System
- Thrust Retracement
- TrendLine BreakOut
- Weekly S&P System
All of the indicators and signals can be modified at any time and adapted to your needs.
Market Scanner
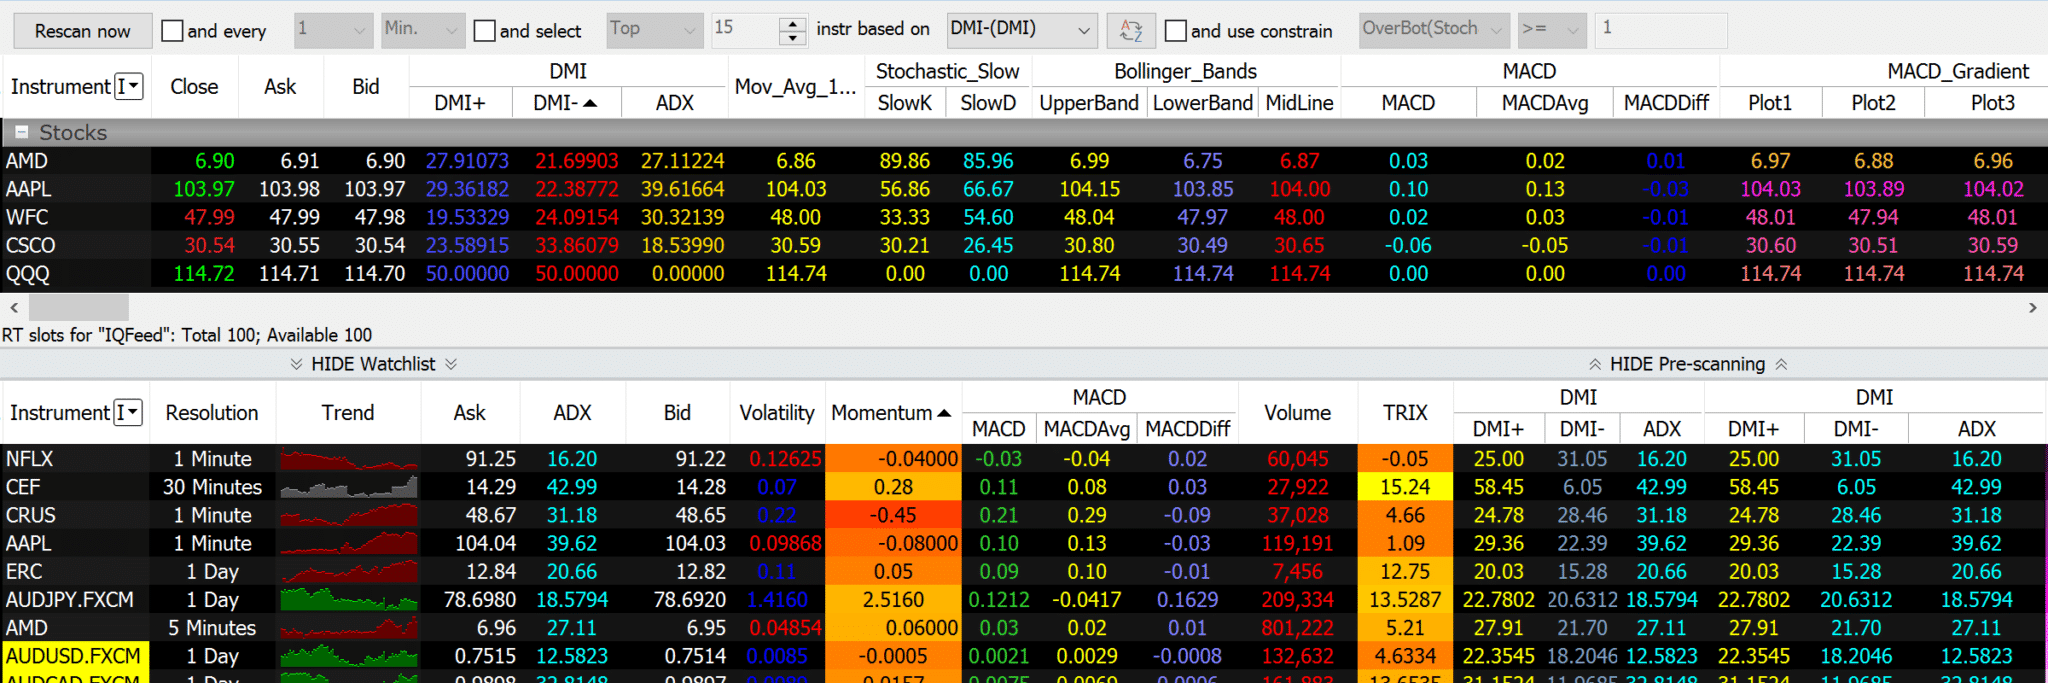
With the Market Scanner, you can screen and monitor a universe of securities according to specific criteria.
You can display interesting signals and criteria in real-time or create visual, sound, or email alerts for timely notifications.
There are a large number of scanning options and the full gamut of indicators. Detailed filters can be created for scans.
For example, you can screen stocks that have risen above their 20-day moving average in the last three trading days or are currently trading above this average.
You can add more than 20 data fields, including open, close, volume, and 52-week high. The columns can be customized by color.
You can display charts to help you recognize trends.
It is also possible to use different data feeds. All data can be exported to Excel.
Market Data Playback
Using this feature, you can recreate market developments in real-time. You can replay past days live and rewatch as the market action unfolds.
This tool is ideal for discretionary traders who use price patterns and other difficult-to-program methods or who simply want to improve their performance.
MultiCharts is one of the few providers to offer tick-by-tick replay, which presents an accurate picture of the market. It also recalculates indicators on every tick.
There are different playback speeds, so you have complete control over how quickly market changes are displayed. In addition, you can replay several instruments or sections of the chart at the same time. Finally, you can combine Playback with the Scanner window in order to practice finding and implementing trading opportunities. This can help you improve your trading.
Strategy Backtesting
Backtesting allows you to test strategies on historical data and see how they would have worked in real life. Accurate, reliable data are essential. With this in mind, MultiCharts supports a large amount of tick-by-tick data.
The backtesting software provides a comprehensive report that includes all your parameters and results.
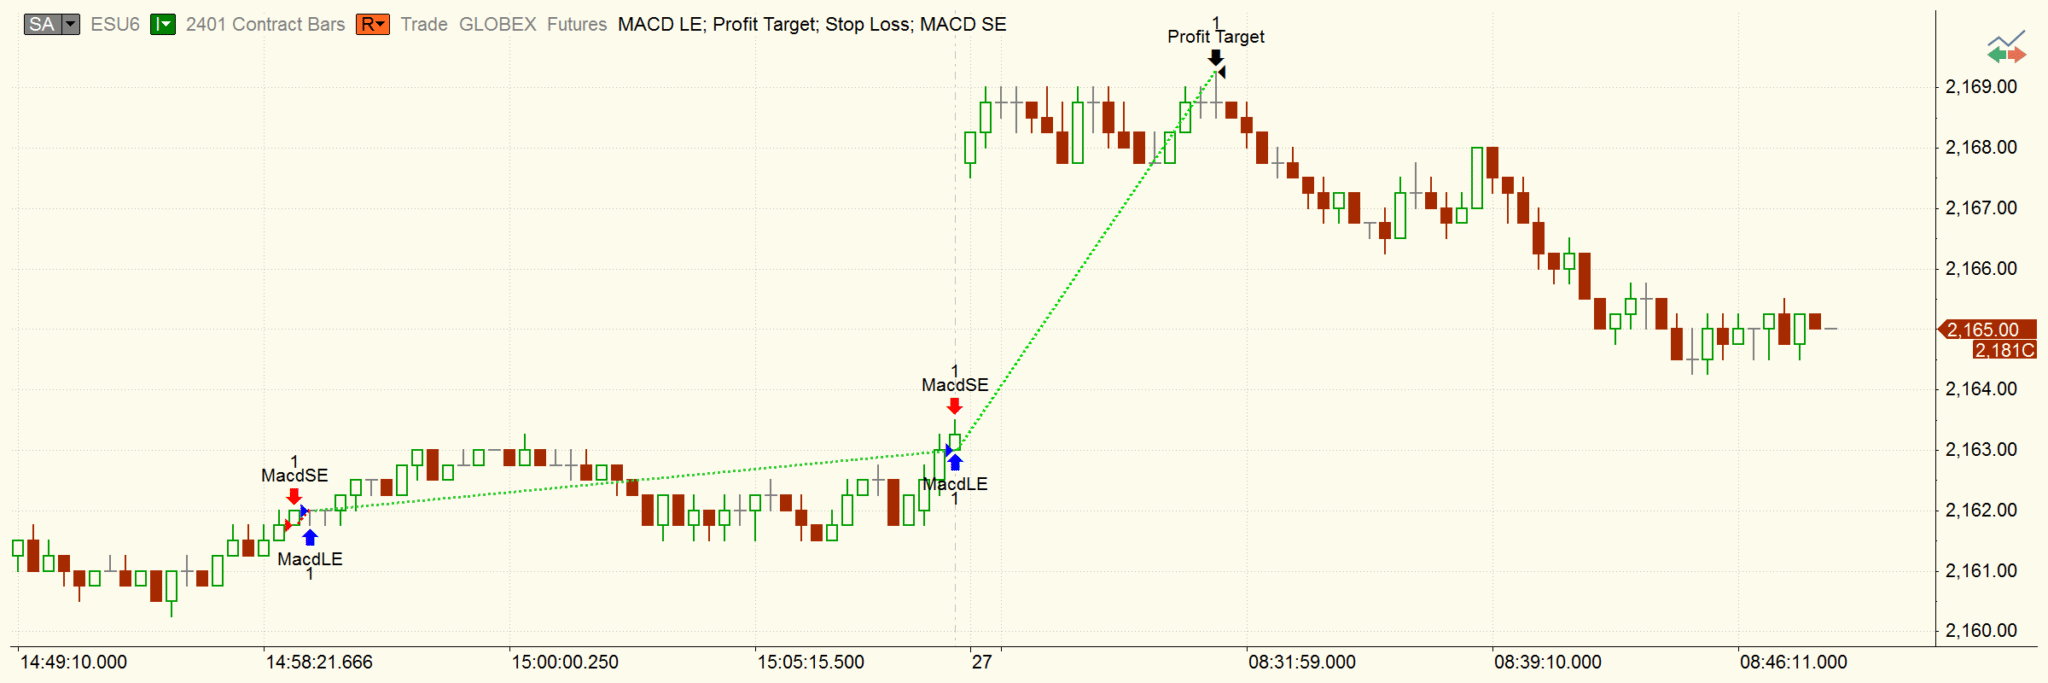
In addition, you can display your strategy on a chart and quickly see your entries and exits. The entry and exit orders are connected by a green line if trades were profitable, or by a red line if they were unprofitable.
The software takes all the most important factors into account, including liquidity, tick-by-tick price changes, ask-bid price differences, commissions, slippage, initial capital, interest rates, and trade size.
It simulates market, stop, limit, stop limit, and one-cancels-other (OCO) orders. In addition, you can practice backtesting using more than 80 predefined strategies.
Strategy Development
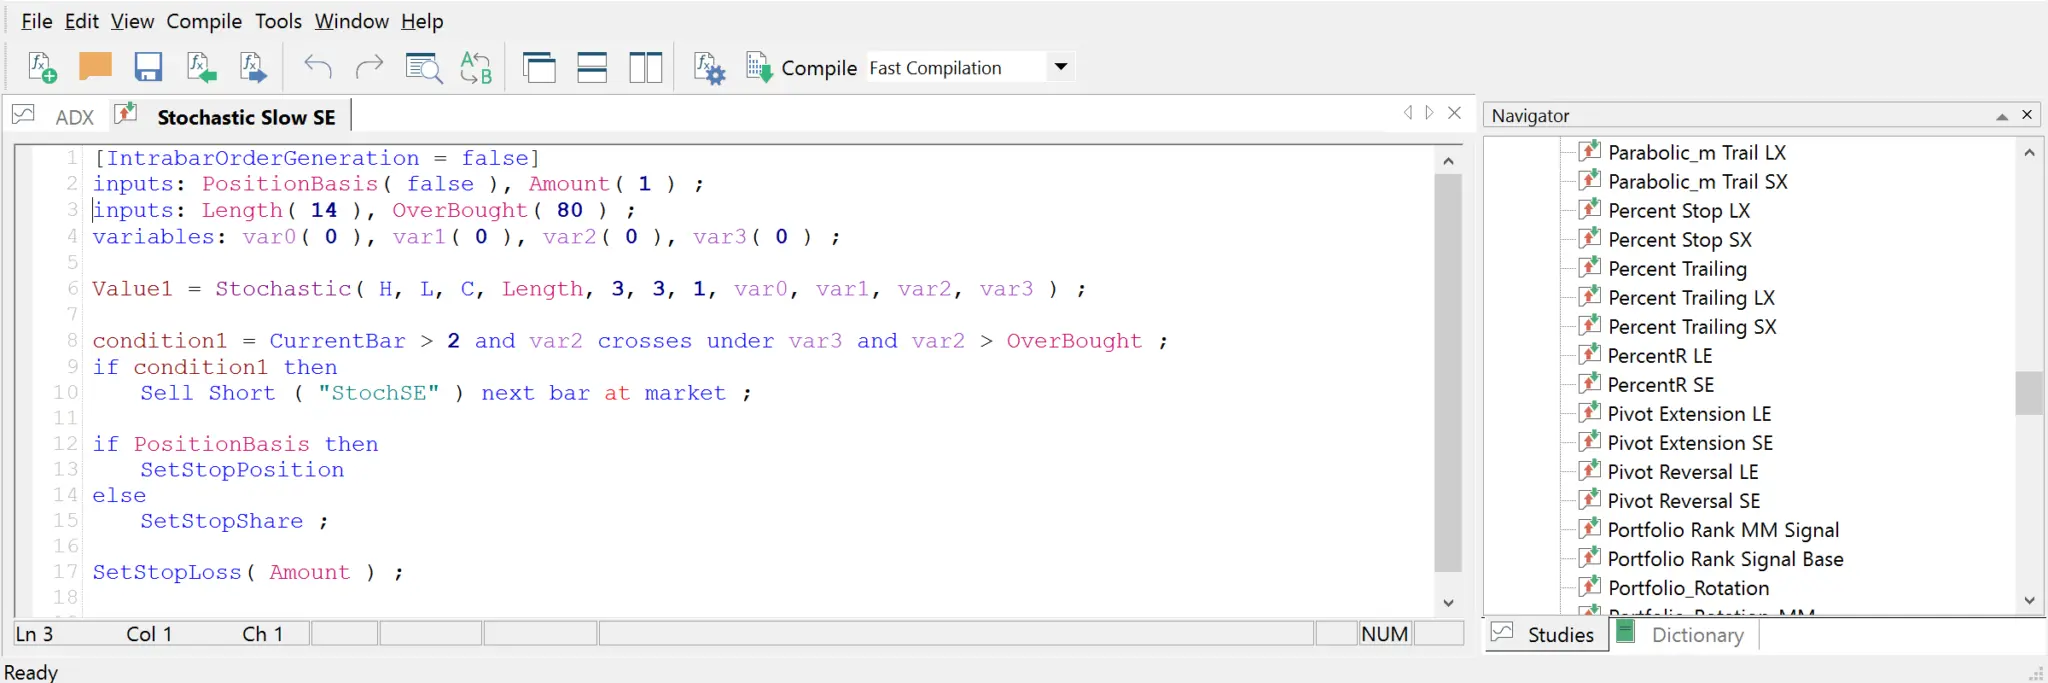
MultiCharts uses PowerLanguage, an evolution of EasyLanguage. Up to 99 percent of EasyLanguage strategies and indicators are fully compatible with MultiCharts and can be executed on it without modification. This means you can create strategies without programming expertise.
Script structure is simple and allows you to dive into strategy development right away. For example, strategies and components can be assembled from existing trading signals.
“IntelliSense” automatically completes or corrects syntax and displays suggestions. Your entire program can be checked for errors at any time.
It is even possible to program complex strategies.
You can use a DLL in another programming language if you require an unavailable function.
Trading System Analysis
Trading system analysis helps traders get a detailed overview of their trading systems.
MultiCharts provides more than 200 analysis options, including strategy performance, run-up and drawdown, and periodic analysis. You can also display a variety of key figures and ratios.
As a result, you can get a quick overview of the trading system in question. All of your trades are displayed in a detailed trade-by-trade report.
The platform also provides a statistical analysis of trades. These stats can help you make important decisions and gain insight into your trading systems.
More than 28 graphs (e.g. “Equity Curve to Close” and “Buy & Hold Return”) are available to visualize the analytical information about trading systems.
These graphs are useful for identifying ways to improve your systems.
For example, the Maximum Adverse Excursion graph can be selected to determine a money management strategy and define the best stops for a trading strategy. It depicts the realized profit/loss vs. drawdown for each trade in a scatter graph format. Or use the Maximum Favorable Excursion graph to determine the optimal trailing stop.
With just one click, you can filter and display trades in a chart, choosing from more than 16 parameters.
Trading Strategy Optimization
A trading strategy is created by taking trading concepts, ideas, and observations about historical market behavior and implementing them in a trading system.
Optimization helps you determine optimal parameters for your strategy. The goal is to adjust the trading system to make the system more effective.
Strategy optimization involves searching for the optimal parameters for predefined criteria. Based on historical data, you arrive at the optimal combinations to generate the best possible strategy performance.
MultiCharts offers a comprehensive range of optimization options and different optimization types.
These are:
- Genetic optimization
- Walk-forward testing
- Brute-force optimization
Each optimization method has its advantages and disadvantages. They can be used individually or combined.
MultiCharts uses a technology called multi-threading that distributes optimization cycles over all available CPUs and considerably accelerates the optimization process.
Every optimization run is documented in a comprehensive report that shows the optimization results and includes a detailed display of the individual parameters. The results can be filtered by different criteria.
The optimization process and the results can be depicted in various graphs – even 3D visualizations are available. Here, too, different filtering criteria can be used.

Automated Trading
Automated trading is one of the most popular features on MultiCharts, alongside strategy and trading system development.
In an automated trading system, orders and strategies are implemented automatically. Thanks to the wide range of brokers that MultiCharts supports, you can choose from a large number of trading gateways to run your system.
There is also a paper trading option to make sure your trading system functions well and can be implemented without errors.
Your strategy accesses all attributes of your account in real-time, including account number, number of open positions, and position average price. All the usual order types are supported, and visual and sound alerts can be set up to help you monitor your system.
MultiCharts offers two auto-trading modes:
- Synchronous
- Asynchronous
Each has its advantages and disadvantages.
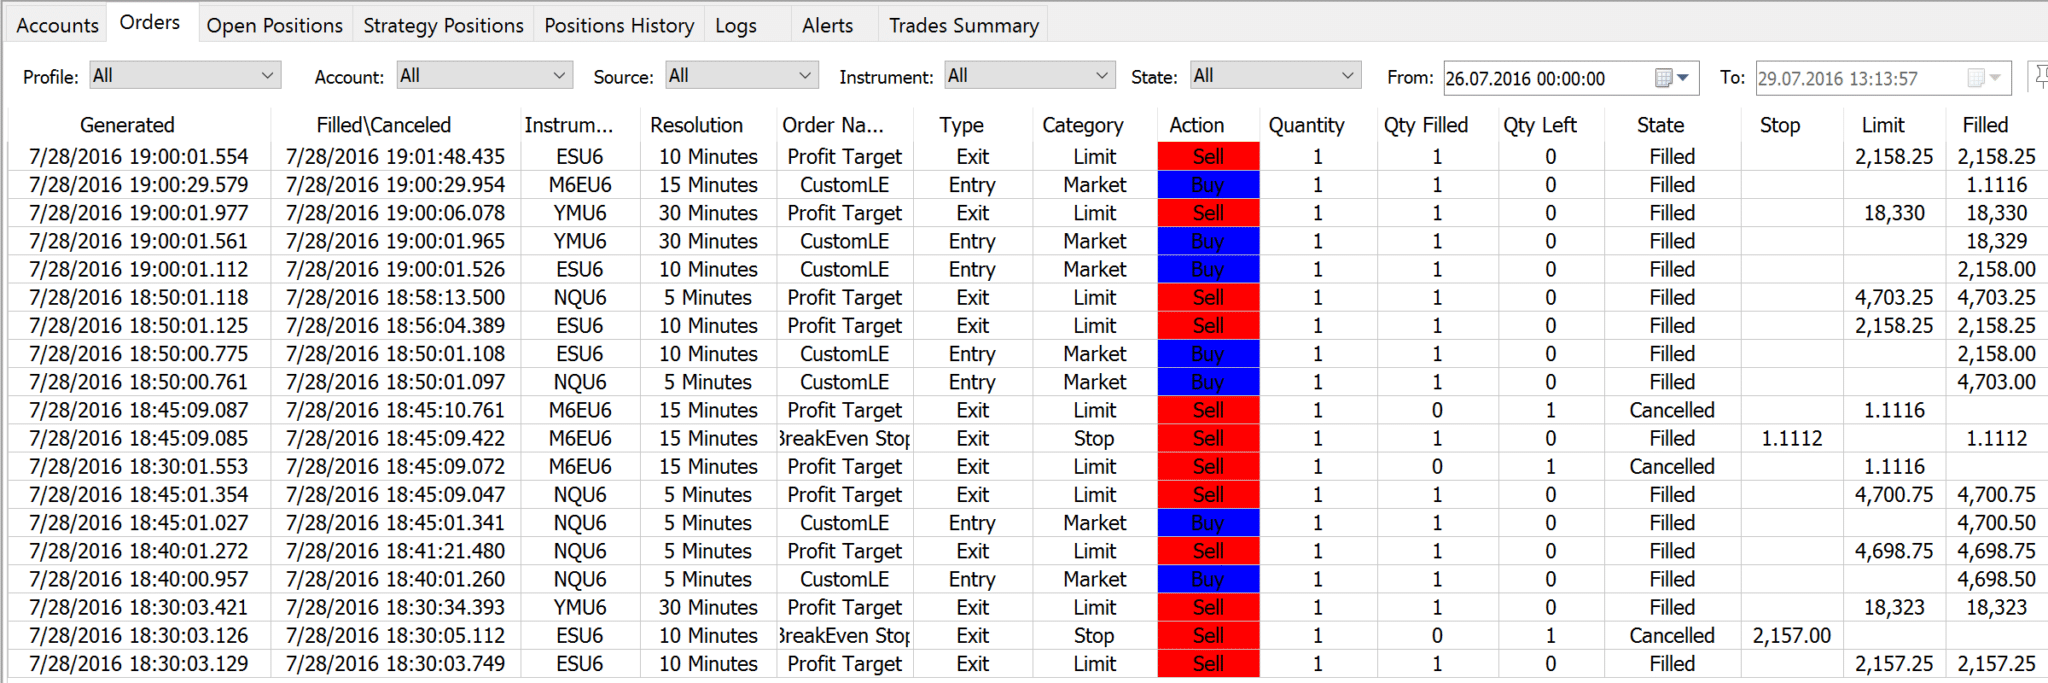
You can display and track orders and strategy positions in real-time in a separate window called the Order and Position Tracker.
A display of automatic trading reports is also possible.
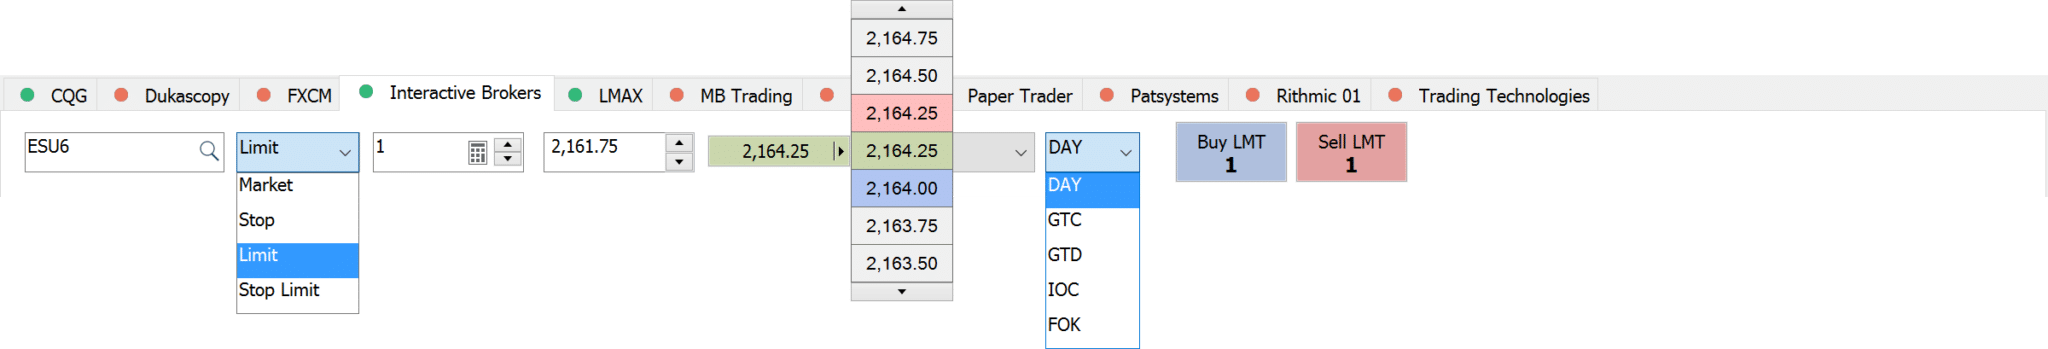
Manual and Semi-Automatic Trading
In addition to automated trading, you can of course trade manually. Or you can automate part of your trading strategy and trade semi-automatically.
Trading is supported by the following tools:
- Chart Trading
- Trade Bar
- Depth of Market (DOM)
- Automated Entries and Exits
- Order and Position Tracker
- Alarms
- Hotkeys (can also be used for additional features such as drawing tools, etc.)
- Forex Board with one-click trading
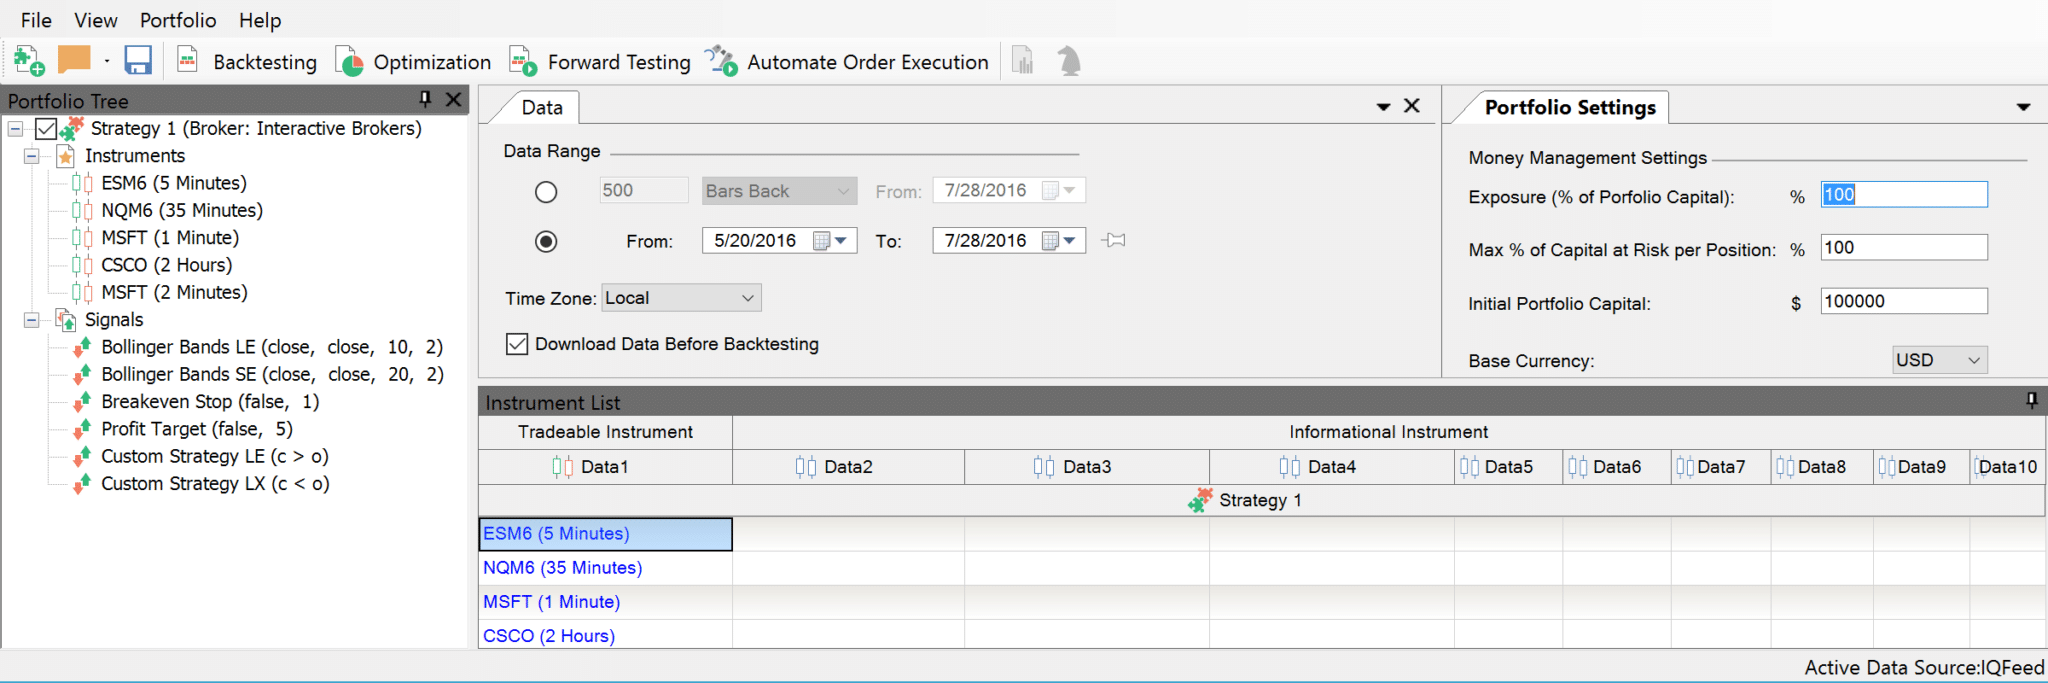
Portfolio Trader
Portfolio Trader is an advanced feature for simulating and automatically trading entire portfolios containing hundreds of stocks, futures, or other instruments.
These types of tools are usually sold separately, but with MultiCharts you get one as part of your package.
With it, you can test and optimize entire portfolios. All optimization options are available in the Portfolio Trader, and you can adjust portfolio settings individually.
Automated portfolio trading is possible, and you can also trade different strategies and instruments individually.
As with all the platform’s features, you can display a comprehensive report and even show a correlation matrix.
What data providers does MultiCharts support?
You can connect more than 29 data providers to MultiCharts. Simply select the vendor that’s right for you and integrate it into the trading platform.
Currently you can use the following data providers:
- Interactive Brokers
- CQG
- Rithmic
- IQ Feed
- eSignal
- TradeStation
- Trading Technologies
- Bloomberg
- Yahoo
- Barchart
- LMAX
- GAIN Capital
- Dukascopy
- Oanda
- Patsystems
- MetaStock
- Ava Trade
- IW Bank
- MB Trading
- Commodity Systems Inc.
- Global Server
- TradeNote
- Universal DDE
- Webankit
- Quik
- Poloniex
- Bittrex
- Bitfinex
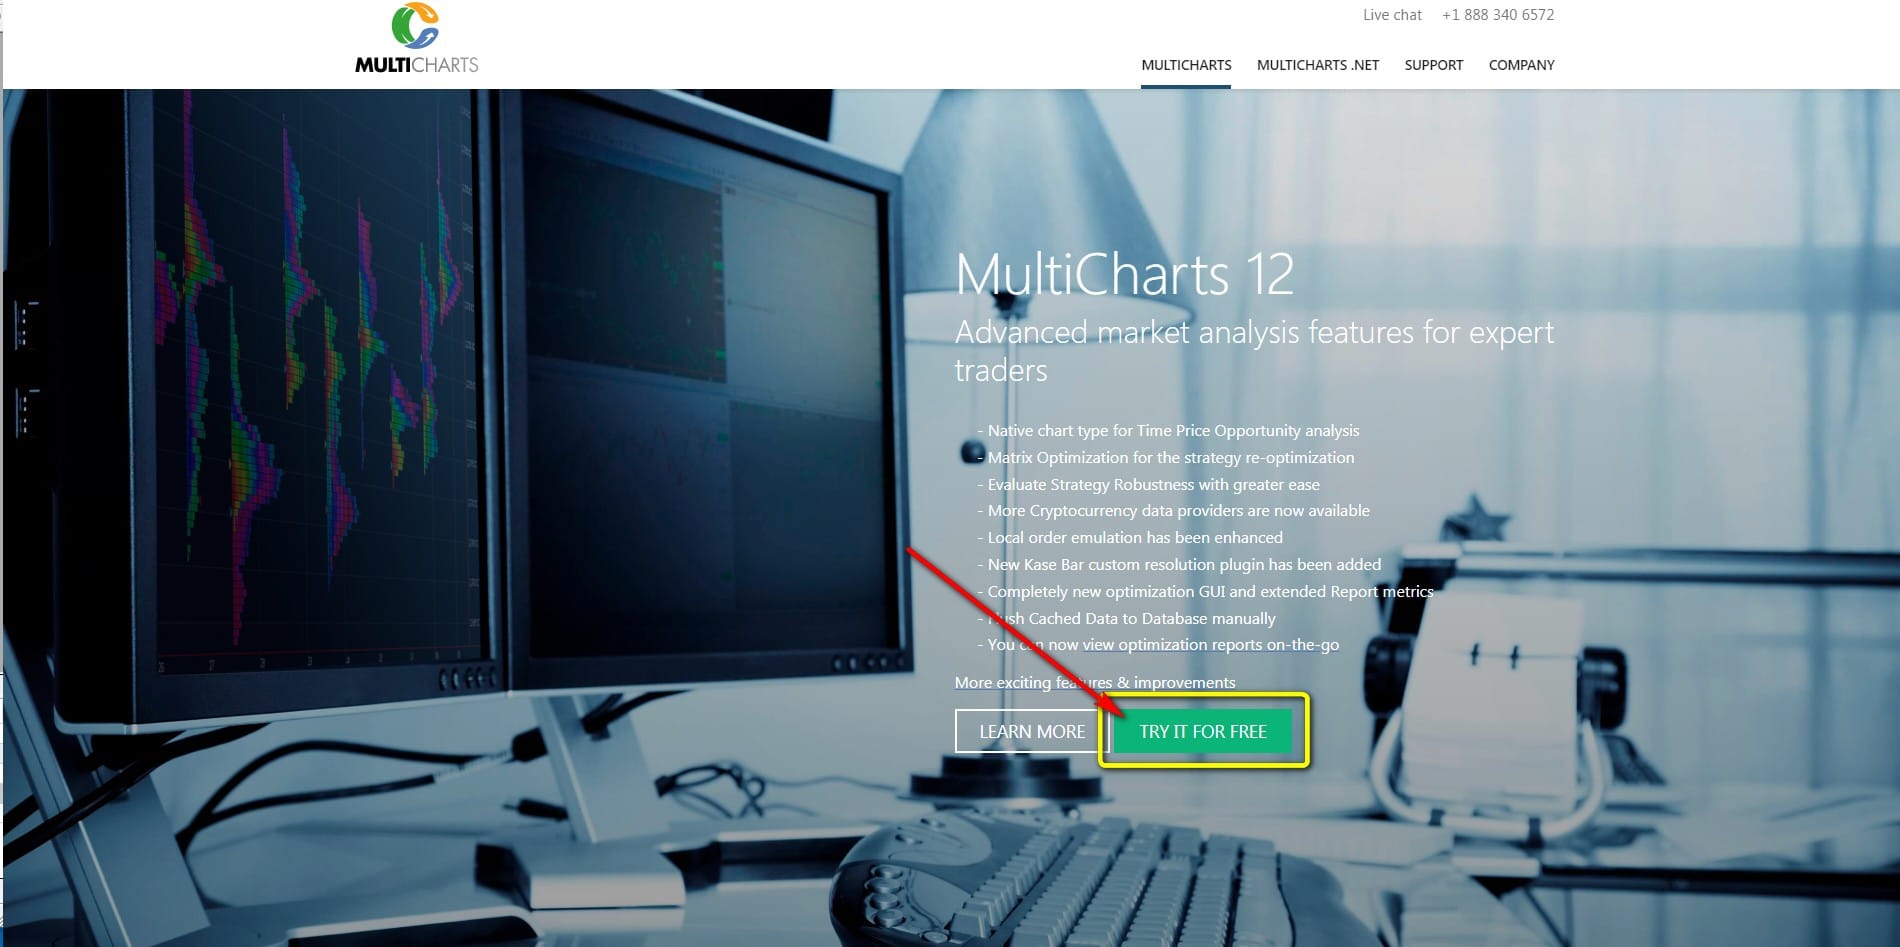
Where do I find the demo version?
The 30-day demo version can be found directly on the MultiCharts website or by clicking one of the following links:
Where can I download MultiCharts or MultiCharts.NET?
You can download MultiCharts or MultiCharts.NET from the website or by clicking one of the following links:
How much does MultiCharts cost?
There are four price models, depending on duration:
- Three months for 297 USD
- Six months for 497 USD
- One year for 797 USD
- Lifetime version for 1,497 USD
There is an additional charge of 199 USD to switch from MultiCharts to MultiCharts.NET. MultiCharts and MultiCharts.NET cost the same.
When you purchase a lifetime license, you get free forex data for a year, including two years of historical tick data, eleven years of minute and daily bars (bid and ask data), and more than 30 currency pairs.
What charting functions does MultiCharts offer?
MultiCharts offers all the most common chart types and features, including trend lines, Fibonacci analysis, and channels. Volume analysis tools are also available, and the platforms comes with various predefined indicators and trading signals.
Is there an education section?
Yes MultiCharts has an education section on its website, under Help & video tutorials.
It describes how to set up the platform with different brokers and data providers.
In addition, MultiCharts operates its own YouTube channel.
Finally, there is an extensive online library that describes all the aspects of the MultiCharts platform. It’s called MultiCharts Wiki. It explains all of the features and options in great detail, from chart setup and the use of different tools to backtesting.
What awards has MultiCharts won?
MultiCharts has won numerous awards.
Among other things, it has received several Members’ Choice Awards:
- Best software for mechanical system traders
- Best software for technical analysis
- Best software for professional traders
- Best software for UK EOD traders
- Best software for UK intraday traders
- Best software for US EOD traders
- Best software for US intraday traders
- Best software for forex traders
In 2011, MultiCharts won the Technical Analysis of Stocks and Commodities Readers’ Choice Award.
Prestigious trading magazines have regularly published articles about MultiCharts and recommended the platform.
Conclusion
MultiCharts is rightly considered one of the leading trading platforms.
Because of its numerous features, MultiCharts is suitable for every trader. It’s a great choice for traders who use automated trading systems and the associated features, including backtesting and optimization.
But MultiCharts is also ideal for discretionary traders and fans of chart analysis, offering an extensive range of features in this area as well.
Due to the large number of brokers and data providers it supports, you can put together optimal combinations for your needs.
You get great value for your money and customer support is easy to reach.
This makes MultiCharts one of the leading all-in-one trading platforms on the market, as has been confirmed by numerous awards.
Read more: