Software comparison – which one is the best? In this article we introduce ProRealTime
In this article I’d like to present an excellent trading platform, ProRealTime. I’ve known and used ProRealTime for years. It’s free of charge if you only work with end-of-day data, which is all many traders need. This review will provide a detailed overview.
Inhaltsverzeichnis
Introduction to the ProRealTime trading software
ProRealtime is a platform for technical analysis and trading. It covers almost all the major stock markets in the world plus the most important futures markets and 47 currency pairs.
For many markets, price data goes back 20 years.
The following features convinced me to use the software myself:
- Powerful tools for identifying trading opportunities and analyzing markets
- Automated trading and backtesting
- A wide range of markets
- Competent customer support
- Free version with end-of-day data or paid version with real-time data
- Trading from the platform (with the added advantage of free real-time data for active trading)
- Two reputable brokers to choose from (Interactive Brokers and IG)
- Easy access and good usability
- Regular updates and new features
- High-quality market data, including extensive historical data
The following image provides an overview of ProRealTime trading software.

Charting and technical analysis
Because I don’t trade with indicators, I’m more interested in the options for chart analysis. ProRealTime leaves nothing to be desired.
You can display quarterly or yearly charts, which is important if you want to get an impression of long-term price movements. For extremely short-term traders, there are tick and one-second charts.
To display a chart, you simply enter the instrument in the search function.
You can use the available predefined lists or create lists of your own. If you click an instrument in the list, it automatically displays the corresponding chart.
You can switch between different instruments quickly and easily by using the dropdown menu.
Multiple charts can be opened and charts can be copied and linked to one another. In the premium version, you also have the option to create chart groups.
The settings allow you to modify the charts any way you like and adapt them to all your needs.
You can make the following selections in the charts:
- Histogram, Line + Points, Invisible, Bar Chart, Candlestick, Mountain, CandleVolume, EquiVolume, Kagi, Point and Figure, Renko, Three Line Break, Range Bars, Range Candles, Heikin-Ashi
The drawing tools include:
- Cursor, Ruler, Alarm Mode, Zoom Mode, Lines (Line, Horizontal Line, Vertical Line, Segment, Horizontal Segment, Vertical Segment), Advanced Lines (Speed Lines, Line by Angle, Line by Percentage, Linear Regression), Shapes (Rectangle, Oblique Rectangle, Eclipse, Oblique Eclipse, Triangle), Icons (Buy Signal, Sell Signal, Check, Cross), Channels (Andrews Pitchfork, Schiff Pitchfork, Standard Error Channel, Standard Deviation Channel, Raff Channel, Simple Channel), Fibonacci (Fibonacci Retracement, Fibonacci Expansion, Fibonacci Time Zone, Fibonacci Arc, Fibonacci Fan, Fibonacci Channel, Fibonacci Eclipse, Fibonacci Spiral), Gann (Gann Line, Gann Fan, Gann Grid, Gann Square), Text (Bubble Text, Anchored Text), Move Object, Duplicate Object, Configure Object, Delete Object
The software offers all the basic drawing tools, but lacks more specialized options such as Elliott waves and other interesting formations. For the majority of traders, though, the integrated drawing tools are perfectly adequate.
The software currently contains around 115 indicators, including:
- Adaptive Moving Average, Advance Decline Line, Advance Decline Net Difference, Advance Decline Ratio, ADX, Accumulation Distribution, ARMS Index (TRIN), Aroon, Average True Range, Awesome Oscillator (AO), Bid Ask Band, Bollinger, Bollinger Bandwidth, Bollinger%b, CCI Divergence, Chaikin Money Flow, Chaikin Oscillator, Chaikin Volatility, Chande Kroll Stop, Chande Momentum Oscillator, Commodity Channel Index, Coppock Curve, Cycle, DEMA, Detrended Price Oscillator, Directional Movement, Donchian Channel, Dynamic Horizontal Line, Dynamic Zone RSI, Dynamic Zone Stochastic, Ease of Movement, Elastic Volume Weighted MA, Elder Ray, Envelopes, Force Index, Fractal Dimension Index, Weighted Moving Average, Smoothed Stochastic, Simple Moving Average, Moving Average Ribbon, Historical Volatility, Horizontal Line, Ichimoku, KDJ, Keltner Channel, Correlation Coefficient (comparison), KST Oscillator, Price, Last Positions, Linear Regression Slope, Linear Regression, MACD, MACD Divergence, MACD Simplified, MACD Zero Lag, MACD Rainbow, Mansfield’s Relative Strength, Mass Index, Multiple Smoothing Moving Average, Momentum, Money Flow Index, Negative Volume Index, On Balance Volume, Orderbook Volume, Parabolic SAR, Pivot Points, Positive Volume Index, Price Oscillator, Volume by Price, Price, Price Rate of Change, R-Squared, Relative Strength (comparison), Relative Strength Index (RSI), Repulse, ROCnRoll, RSI Divergence, Schaff Trend Cycle, Smoothed Repulse, Spread (comparison), Standard Deviation, Standard Error, Stochastic Momentum Index, Stochastic, Stochastic RSI, SuperTrend, TEMA, TRIX, True Strength Index, Ulcer Index, Ultimate Oscillator, Upside Downside Line, Upside Downside Net Difference, Upside Downside Ratio, Vertical Line, Volume Rate of Change, Volume, Volume Oscillator, Vortex, VWAP, VWAP Bands, Williams %R, Williams Accumulation Distribution, Williams Alligator, ZigZag
You can also display spreads and compare different instruments/markets.
Finally, you can set the platform to send technical or price alerts to your cell phone.
Lists
The software contains predefined lists, but you can also create lists of your own. There are advantages to both.
The predefined lists include:
- Forex, World Indices, Commodities, Gold & Silver, DAX, MDAX1, MDAX2, SDAX1, SDAX2, TecDAX, US Tech, US Tech A–C, US Tech C–K, US Tech K–Q, US Tech Q–Z, US NonTech, US NonTech A–C, US NonTech C–H, US NonTech H–R, US NonTech R–Z, US Regionals, Austria, Switzerland, France, Great Britain, Netherlands, Belgium, Finland, Sweden, Denmark, Norway, Italy, Spain, Portugal, Ireland, Australia, Germany, Indices Dow Jones, Indices S&P, Indices STOXX, Indices Euronext, Indices FTSE, Futures Eurex, Futures CME E-mini, Futures CME Globex, Futures CBOT E-mini, Futures CBOT, Futures NYMEX E-mini, Futures NYMEX, Futures COMEX E-mini, Futures COMEX, Futures Netherlands, Futures France, Futures Italy, Futures Spain
In the lists, you can select the following criteria for columns and display and sort the results accordingly:
- Last, %Chg, Chg, Volume, Capital, Tick Time, Open, High, Low, Prev, Bid, Bid Vol, Bid Nbr, Ask, Ask Vol, Ask Nbr, Name, ISIN, Ticker, Exchange
Trading
One of the advantages of ProRealTime is that you can trade directly from the software.
In addition to paper trading, you can of course trade live.
ProRealTime offers two brokers: Interactive Brokers (which I use myself) and IG. Because I don’t use IG, I don’t have detailed knowledge of them, but I consider Interactive Brokers to be an excellent choice, particularly for CFD and forex trading.
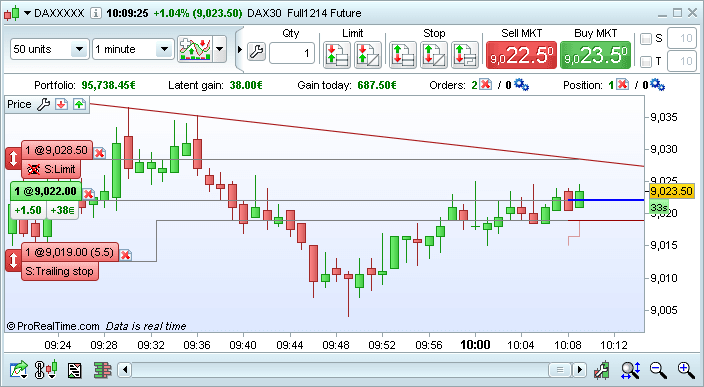
You can place orders directly from the chart or the Order Book. You can also combine alerts and orders, which I find very practical. Basically, this is the same as a limit stop order. An additional option is to place orders from lists or order tickets.
Order interfaces are integrated into most of the windows in the ProRealTime workstation, including price charts, ProScreener, ProRealTrend Detection, Top Movers, etc.
With just a click, you can quickly change or cancel an order or close a position. Target and stop orders are also possible.
An additional highlight is that you can link an order to lines in the chart and display current positions and order history in the chart.
The following order types and specifications are possible:
- Limit, Stop, At Market, Market If Touched, Trailing Stop (fixed or percentage), OCO, Stop OCO, OTO, Strategy, Target & Stop
You can configure the order templates yourself, which I find very helpful. This means you can create templates for different markets and/or trading strategies.
All orders are displayed in the Order List. There are several tabs to choose from:
- Executed, Pending Orders, Canceled/Rejected, Multiple-Leg, Automatic Trading, All
You can arrange the columns in the Order List yourself. The following selections are available:
- Side, Qty, Qty Exec, Price, Status, Type, Gain, Pos. Chg, Limit, Stop, Trail.stop, %Trail.stop, %Gap, Order ID, Portfolio
It’s also possible to display trading activities and open positions in the Portfolio windows.
The following columns can be selected:
- Qty, %Latent P, Unit Cost, Total Cost, Today Buy, Today Sell, Pending Buy, Pending Sell
Order Book & Tick by Tick List
You can open the Order Book either from the main window, the instrument search tool, or a chart.
The display is very clear and the Order Book can be set and modified to meet your needs. You can even change fonts, colors, and window size.
You can place orders quickly and easily.
To speed up the process, it’s best to work with the predefined settings. I use these quite often, especially when trading smaller timeframes.
In addition to the Order Book, I recommend displaying the Tick by Tick window (Time & Sales). This is also possible in ProRealTime, and the display clearly laid out.
ProRealTrend
ProRealTrend is one of the best tools offered by ProRealTime. It automatically recognizes and draws horizontal support, horizontal resistance, and trend lines.
This feature is available in all timeframes.
I find it very useful when examining a large number of charts.
It can also be combined with alerts.
With the help of ProRealTrend Detection, you can receive an alert if the price approaches ProRealTrend levels. This is very useful if you can’t or don’t want to monitor your open positions all the time. If, on the other hand, you’re planning to open a position, It’s helpful to receive an alert when the price approaches interesting zones.
ProScreener and Top Movers
ProScreener is ProRealTime’s market scanner.
With it, you can scan any market you want according to interesting criteria and display the results.
Compared to other scanners, ProScreener’s advantage is that you can program it according to your own criteria. The Assisted Creation Wizard is available for assistance if you need it. Because many scanners don’t allow you to do your own programming, ProScreener is one of the most useful tools available.
Top Movers 1 and Top Movers 2 are basically the same as the screener, but contain different filter criteria for the lists.
The criteria are as follows:
- Up, Down, Volume (Unit), Volume (Cash), Opening Gap Up, Opening Gap Down, Abnormal Volume.
ProScreener covers all chart formations.
I also like using this list. It’s helpful for getting a quick overview of interesting trading opportunities. When you click the respective instrument, a chart is displayed that you can link to other charts. As a result, you can examine a large number of instruments in a very short time and filter them any way you like.
Automated trading
With the automated trading tool, you can create and backtest your own trading strategies.
Programming your own strategies is easy.
An additional advantage is that it’s based on 100-percent server-side technology. This means that once your trading system has started, you can turn off your computer because your system will be executed on ProRealTime’s servers. This provides additional security in case of technical problems, such as temporary loss of Internet access or power outages. You also have greater computing power than your computer can offer, which is especially advantageous for complex calculations in smaller timeframes.
Finally, your codes are encrypted by encryption keys before being sent to the ProOrder server. This makes it impossible for ProRealTime to read your codes. Nothing else would make sense.
The platform contains a few predefined trading strategies for learning and practice.
You can also import and export your own program codes.
Stock exchange data & history
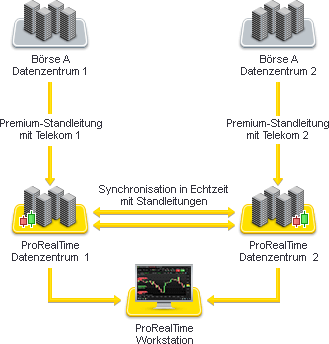
The quality of ProRealTime data is excellent. The following six data quality criteria are met:
- Ultralow latency real-time push data feeds (directly from exchanges)
- High-availability data feed service
- Reliable data and maintenance services
- Extensive historical data (including intraday)
- Limitless possibilities in timeframe selection
- Adaptation of data display according to user requirements
In addition, data can be easily exported at any time using the DDE data export tool.
Data history is extensive.
For example, daily EUR/USD data is available from June 1979, and hourly EUR/USD data goes back 16 years (5 years in the Complete Version). Daily Dax data is available from January 1997, and hourly Dax data goes back 15 years (5 years in the Complete Version).
ProCommunity
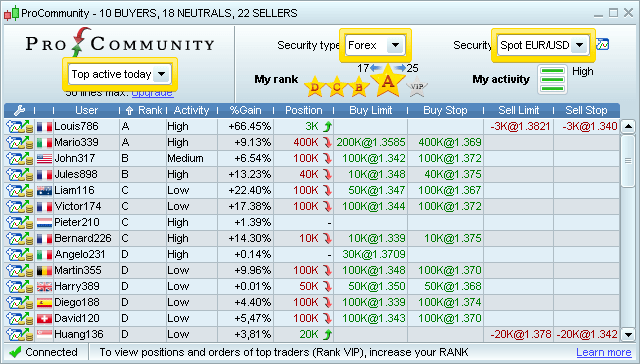
ProCommunity allows you to exchange ideas with friends and other traders.
You can see the positions and orders placed by friends and anonymous users directly in the chart.
You can also follow other traders and view their trades, ranks, activities, etc.
Nowadays few traders go to the trouble of developing their own strategies and merely copy strategies from traders they see as professionals. For this reason, the community is certainly helpful to many traders.

Premium version with real-time data
Most of the features can be used for free and are all you really need if you only work with end-of-day prices.
If you want to use real-time data, you need the Premium version.
It starts at 29.99 EUR a month (without real-time data).
There’s no commitment – you can cancel at any time on a monthly basis.
If you want to use ProRealTime more extensively, we recommend the Premium version for 79.99 EUR a month.
With this version, you get a lot more historical data and can display a larger number of lists and charts at the same time. You can also run up to 100 trading systems simultaneously on ProRealTime’s servers.
In addition, this plan comes with Premium customer support and greater scanning capability. That translates into more scanning tools and more results with faster speed, multi-market scans.
You can have alerts sent to your cell phone and profit from significantly more storage space (you can save up to 2,000 indicators, trading systems, and screeners in your workstation).
With the Premium version, you can also see the positions held by anonymous traders who are one rank above you in ProCommunity, and you can follow up to 100 friends in real-time.
The ProRealTime trading software – summary
ProRealTime is a technical analysis and trading program that meets the highest standards.
It offers good value for your money and high-quality data. Comparable software costs considerably more. Ease of use is excellent, and the software is robust and runs error-free. I highly recommend it for automated trading because of the option of using ProRealTime’s servers. It covers all markets, a feature that isn’t easy to find in other comparably priced systems. The only feature that could be improved on is the charting tools, which don’t offer enough options for special trading strategies.
However, ProRealTime is perfectly adequate for 90 percent of all technical traders, which is why I can wholeheartedly recommend it.
Additional pluses are the discounts for real-time data for active trading and the possibility of canceling your subscription on a monthly basis. In addition to the competent customer support, ProRealTime offers numerous videos and a comprehensive manual. Finally, you can test the software with real-time data for two weeks for free.
If you have any questions about ProRealTime trading software or would like additional information, please leave a comment below.
Read more:


