Software comparison – which is the best? In this article I’d like to introduce you to the platform ATAS – Advanced Times & Sales. ATAS is the leading trading and analytical platform for order flow and volume trading.
ATAS performs all the functions needed by order flow and volume traders. It leaves nothing to be desired, offering a wide range of exclusive tools and indicators. Using this platform, you can view market events from both the outside and inside, looking into the heart of markets.
Inhaltsverzeichnis
Overview of the ATAS trading platform
Very few private (retail) traders are familiar with ATAS, but it’s very popular among professional traders, hedge funds, and prop shops.
ATAS is a professional trading and analytical platform designed for order flow and volume trading. It offers a wide range of features for quick and convenient market analyses: Time & Sales, Level II data (market depth), as well as current and historical volume levels.
ATAS processes raw order flow data and visualizes it in an intuitive form. It provides a broad range of functions, including outstanding filters and extensive settings. Its analytical instruments enhance the information value of market data, offering a comprehensive view of market events and leading to better trading performance.
Top features:
- Smart Tape
- Spread Tape
- Tick Cluster
- All Price
- Smart DOM with HFT algorithm tracking, spoofing, etc.
- Specially developed indicators, such as the Cluster Search and Big Trades
- Cluster charts with 25 footprint options
- Classic charting with special time units such as range, reversal, delta, etc.
- DOM with freely configurable functions and design
Smart Tape
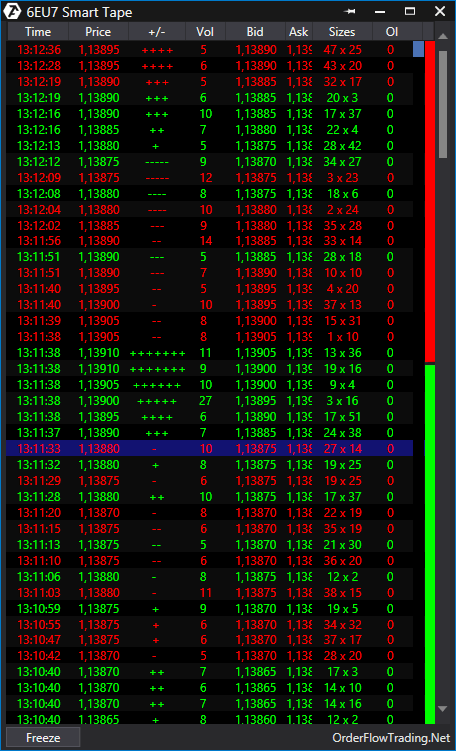
Using the Smart Tape, you can analyze the real depth of the market. Due to regulatory changes in 2009, this isn’t possible with other platforms.
On ATAS, a market transaction of 100 contracts can be aggregated into a single transaction. In a normal order book, by contrast, these 100 transactions are displayed individually.
ATAS has developed internal algorithms that allow you to see the original composition of transactions – just like in the old good days :-).
In addition, the Smart Tape offers individual filters and settings that finally make it possible to see the transactions of small and big players in real time.
You can also detect iceberg orders in this way.
The Smart Tape is a unique feature of ATAS.
The Smart Tape combines fragmented market transactions to show the original market transaction.
Spread Tape
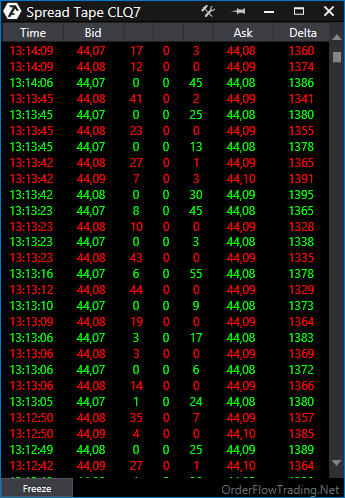
With the Spread Tape, you can see the volume of trades that are settled on the basis of bid and ask during a price movement.
This information is useful for analyzing the transaction behavior of other market participants when a certain price level is approached. You can also see the volume within the spread and the cumulative delta (which shows whether buyers or sellers predominate).
The Spread Tape lets you see the volume of trades that are settled on the basis of bid and ask during a price movement.
Tick Cluster
The Tick Cluster is another way of representing the Spread Tape. It is calculated in a similar manner, with the information displayed in clusters. This makes it even easier to interpret the data.
You can also view the transactions of other market participants executed with slippage, as well as Level 2 data and the volume traded on the current day.
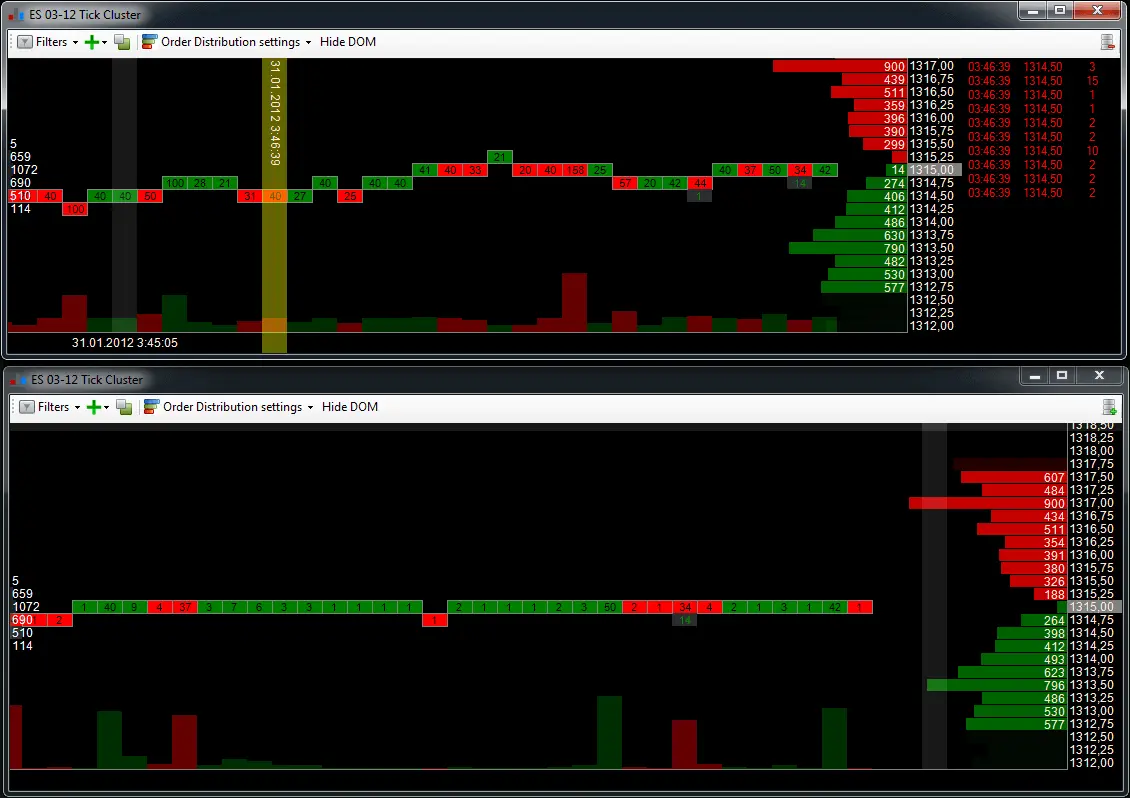
This innovative feature makes it easier to understand information on transaction volumes.
All Price
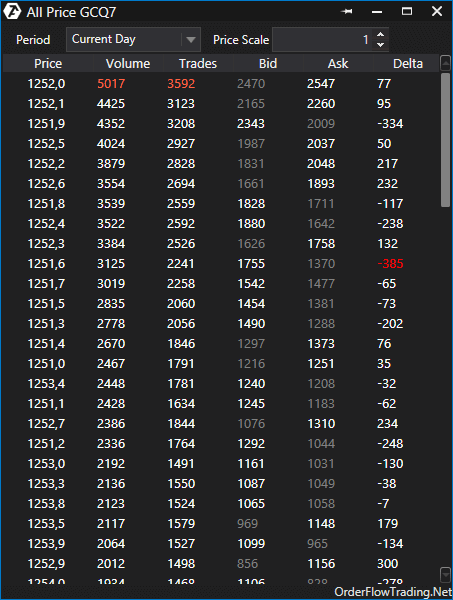
With this module, you can calculate the volume traded at any price level. You can thus identify price levels with maximum volume, bid/ask, delta, and iceberg orders in a given period. Many volume traders base their trades on these levels.
With the help of this module, you can calculate the volume traded at any price.
Smart DOM
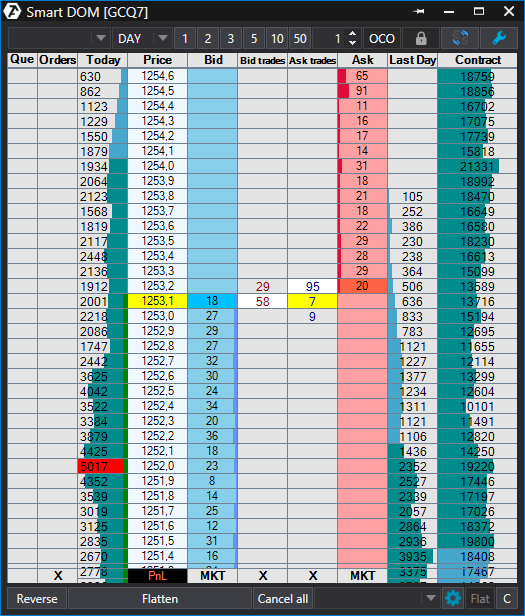
Algorithms, especially high-frequency algorithms (HFTs), are the biggest enemies of order flow traders. The Smart Dom was developed specially by ATAS to detect and analyze them. This tool is another unique feature of ATAS.
Using the Smart Dom, you can:
- Highlight large transactions
- Find iceberg or DND (“do not display”) transactions
- Detect unauthorized activities such as spoofing algorithms
- Absorb limit orders
- Change limit orders in real-time
The Smart DOM was developed to detect and analyze high-frequency algorithms (HFTs).
Charting & indicators
Charting
ATAS offers extensive charting options and a broad spectrum of chart types.
The available chart types are:
- Bars
- Candles
- Transparent Candes
- Line Chart
- Clusters
- Market Profile
- Range
- Delta
- Renko
- Seconds
- Tick
- Volume
- BTK
The platform also features the most common drawing tools, such as trend lines, Fibonacci retracements, rays, and channels. You can create a Market Profile individually for specific segments and analyze the volume horizontally and vertically.
The platform is freely configurable.
In addition, you can “cluster” data. This means that you can view each candle from the “inside” by displaying the volume, bid/ask, and deltas for each candle and price.
Indicators – ATAS goes one step further
In addition to all the common indicators such as Bollinger Bands, SMAs, and Stochastic, ATAS offers a number of specially developed, innovative tools as an additional exclusive feature. These let you convert complex order flow and volume data into simple, clear visualizations. With ATAS performing complex calculations in the background, the software displays the data in a clear, comprehensible manner on the platform.
The specially developed ATAS indicators are:
- Cluster Search
- Dynamic Levels
- Maximum Levels
- Big Trades
- Market Power
- Multi Market Powers
- Order Flow Indicator
- Speed of Tape
- Spread Volume Indicator
- Tape Patterns
- RT Indicator
Each indicator comes with a wide range of settings and parameters.
Cluster Search
This indicator displays large volume inflows in a cluster (total, bid & ask, delta, time, trades). It is an extremely helpful indicator.
You can display large volume inflows in clusters.
Dynamic Levels
This indicator shows Value Areas and Dynamic Levels. You can use it to visualize the shift in maximum volume in a given time period.
Maximum Levels
With the help of Maximum Levels, you can display the levels at which the maximum volume has been traded
Big Trades
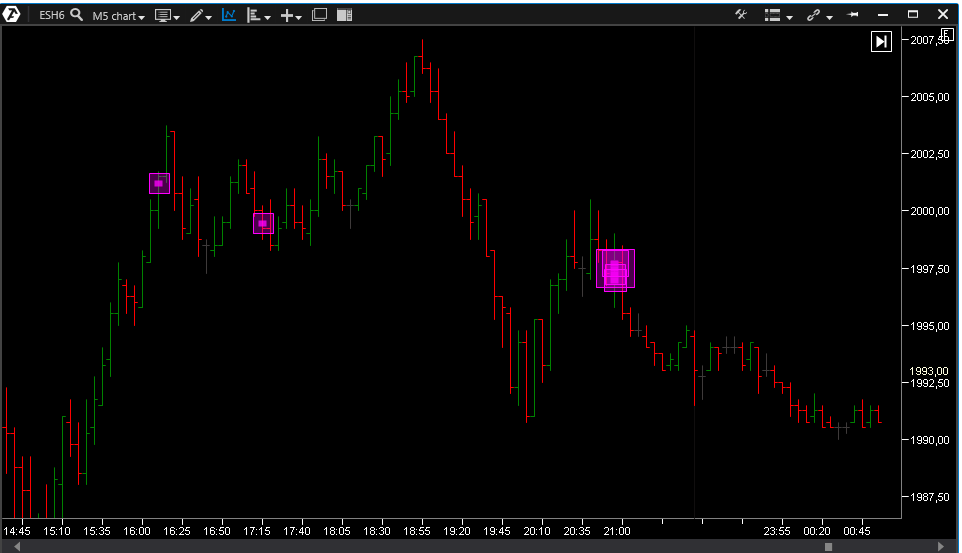
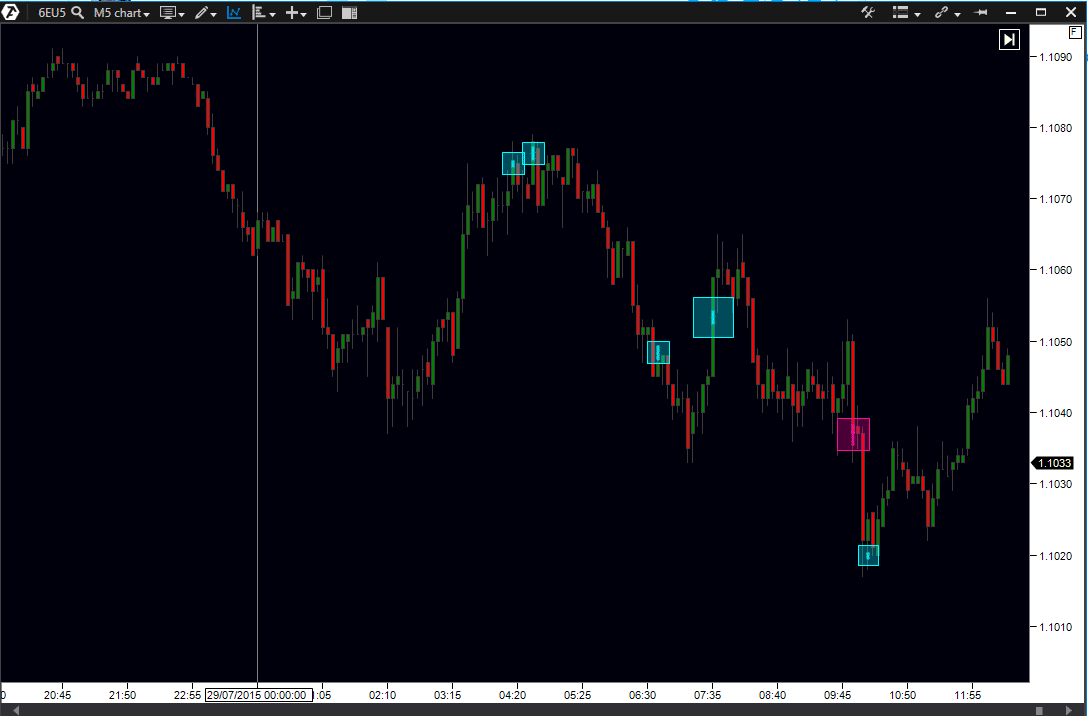
Big Trades is an ingenious, unique indicator. You can use it to identify large, executed market orders, which are merged based on the original time stamp.
The Big Trades indicator identifies large market purchases and sales.
Market Power
With this indicator, you can see how different groups are positioning themselves in the market. For example, most traders of 1 to 5 contracts may be short, while traders of 20 contracts or more may be long. The indicator is freely configurable, making it possible to separate large and small players.
Multi Market Powers
Multi Market Powers makes it possible to simultaneously display several Market Power indicators in a single window.
Order Flow Indicator
This indicator displays order flow directly in the chart.
Speed of Tape
With the Speed of Tape indicator, you can see changes in the speed of Time & Sales in the chart.
Spread Volume Indicator
This indicator functions like the Spread Tape but is displayed directly in the chart.
Tape Patterns
The indicator is used to process and filter “raw” order data flowing into the market.
RT Indicator
The RT Indicator combines market range (size) and trend (direction). You can use it to identify reversal points.
Trading
The platform provides all the necessary trading tools. Orders can be entered in the Smart DOM or the Chart Trader. With the Chart Trader, you can trade directly from the chart or from the panel next to it.
You also have the option to create automatic exits. This feature is available in both the Smart DOM and the Chart Trader. In addition to setting a stop loss or take profit, you can define the conditions for automatically trailing your stops.
Brokers & data feeds
ATAS can be used with all the popular brokers and data feeds.
Support
The support team is competent and responds quickly. You can contact support via email, Skype, or Facebook. An extensive manual and many videos are available on the Internet. There is also a special support team for Germany.
Price
You can purchase either a subscription plan or a lifetime version.
There are four subscriptions plans:
- Monthly for 74 USD
- Three months for 195 USD
- Six months for 330 USD
- One year for 540 USD
The cost of the lifetime version is 1,990 USD.
If you take a look at the prices of similar platforms, you can see that you’re getting an excellent deal for your money.
Conclusion
ATAS is a must for anyone interested in professional order flow and volume trading. The specially developed tools and indicators alone are light years ahead of the competition.
With ATAS, you get the most comprehensive order and volume trading platform on the market at a great price.
The software gives you a trading edge and can increase the probability of further improvements to your performance.
Read more:

