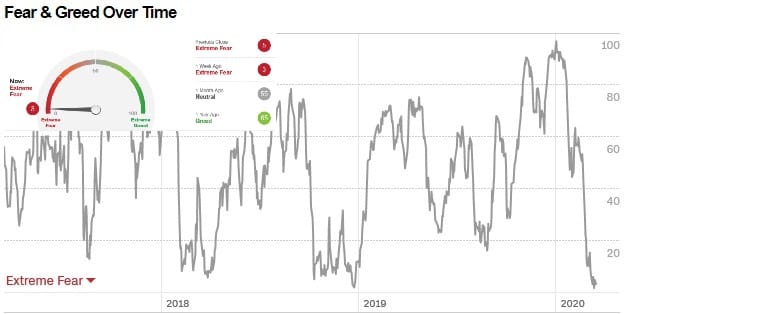
This index measures current market sentiment and attracts a great deal of attention worldwide. It’s calculated by the US broadcaster CNN Business. If you’d like to learn more about the Fear & Greed Index or check the current status, please click here (source: CNN Business).
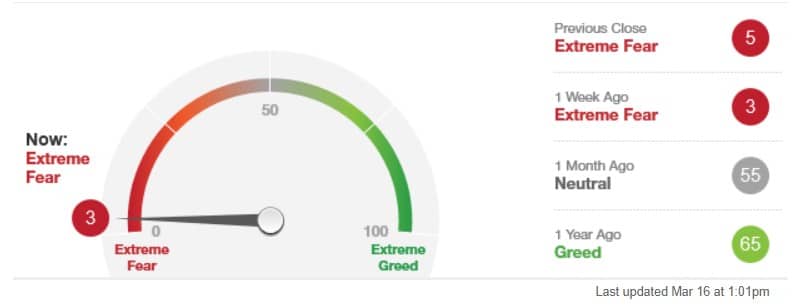
On March 16, 2020, the Fear & Greed Index stood at 3 and was thus in the extreme fear range. On the previous trading day, it was at 5. The week before, the index also showed a reading of 3.
As you can see in the image below, the index was at 55 a month earlier, which is a neutral reading. Neither fear nor greed dominated the market. A year earlier, the index showed a value of 65, implying greed.
Inhaltsverzeichnis
Fear and greed in trading
Investors are known to be driven by two emotions:
- Fear
- Greed
These emotions have a strong influence on stock market prices. An excessive amount of fear can cause stocks worldwide to fall below levels at which they’re fairly priced from a fundamental or economic perspective. Excessive greed leads to the exact opposite, driving stock prices to unsustainable levels.
Every day, these two emotions are shown on a scale from 0 (extreme fear) to 100 (extreme greed).
Sentiment can also be represented as a cycle of regularly recurring market phases.
As prices rise and a trend sets in, investors become greedy, which in turn causes prices to continue their ascent. The reason is that what is considered normal changes and investors become braver. Their courage is followed by euphoria, when everyone wants a piece of the pie. This is the final phase of the trend, when even taxi drivers are giving tips and have increased their positions for the umpteenth time. It is followed by disappointment: the trend doesn’t continue and the first selloffs begin. These accelerate, fear sets in, and there is widespread pessimism just when the market bottoms, with the last investors selling their shares. Now the cycle can begin anew . . .
Calculating the Fear & Greed Index
Seven indicators are used to calculate the Fear & Greed Index.
CNN examines how far each has veered from its average relative to the normal divergence. The results are shown on a scale from 0 to 100. The higher the reading, the greedier investors are being. A reading of 50 is neutral.
Then, CNN puts all the indicators together – weighted equally – to get a final index reading.
The seven indicators are:
- Put and Call Options
- Market Volatility
- Stock Price Strength
- Safe Haven Demand
- Market Momentum
- Stock Price Breadth
- Junk Bond Demand
Put and Call Options
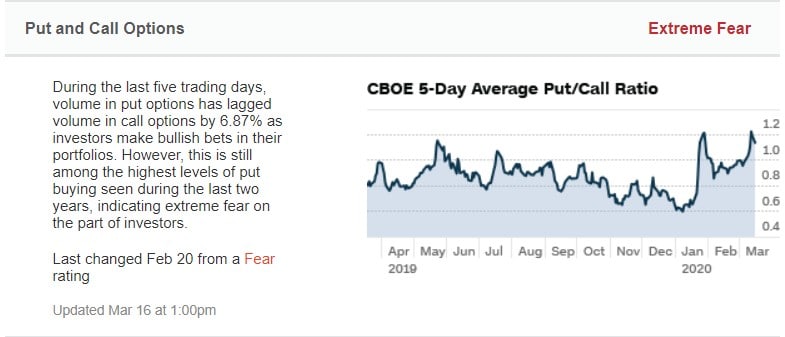
This indicator compares the trading volume of put options relative to the trading volume of call options. The result is the put/call ratio.
In recent weeks, this ratio has risen to one of its highest levels in the past two years, revealing extreme fear.
On February 20, 2020, sentiment changed from “fear” to “extreme fear.”
You can view the history of the put/call ratio here.
Market Volatility
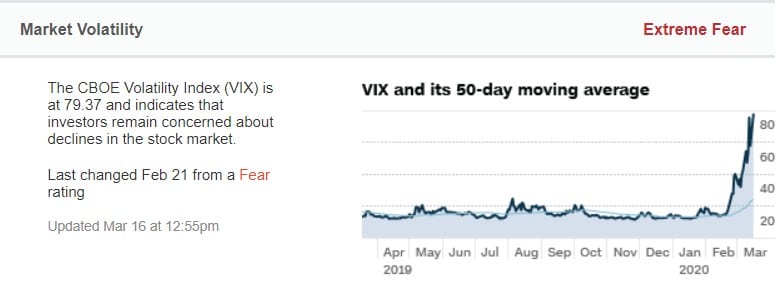
This indicator measures the volatility of the market – i.e. the degree of change in prices. It draws on the Volatility Index (VIX), which shows the expected volatility of the S&P 500 stock index.
The VIX is at the time of writing at 79.37 and shows that investors continue to be concerned about stock market declines. On February 21, 2020, the “fear” reading changed to “extreme fear.”
Investors in Germany use the DAX Volatility Index (VDAX) to measure market volatility. It shows the volatility of the DAX stock index anticipated in the derivatives market.
Stock Price Strength
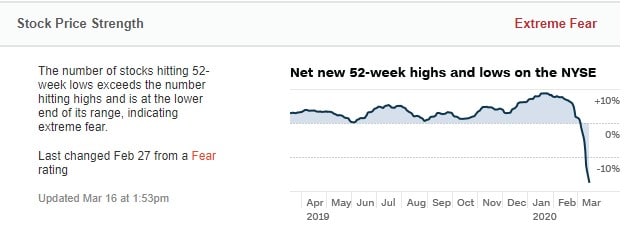
The Stock Market Strength indicator is based on the New York Stock Exchange (NYSE) and shows the ratio of stocks hitting 52-week highs versus those hitting 52-week lows.
This indicator is currently pointing to extreme fear in the market: the number of shares reaching a fresh 52-week low exceeds the number reaching a new high. In addition, the indicator is at the bottom of its range.
On February 27, 2020, the indicator moved from “fear” to “extreme fear.”
Safe Haven Demand
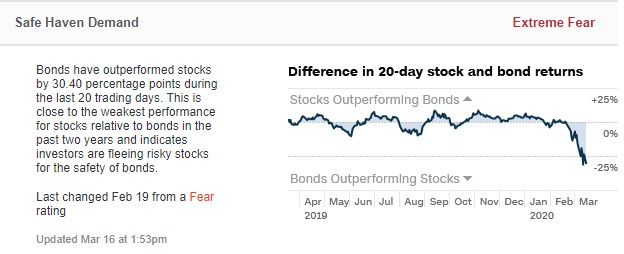
This indicator calculates the difference between returns for stocks versus returns for Treasuries.
Over the last 20 trading days, bonds have outperformed stocks by 30.4 percentage points. This is close to the weakest performance for stocks relative to bonds in the last two years. It indicates that investors are fleeing stocks for the safety of bonds.
On February 19, 2020, the reading changed from “fear” to “extreme fear.”
Market Momentum
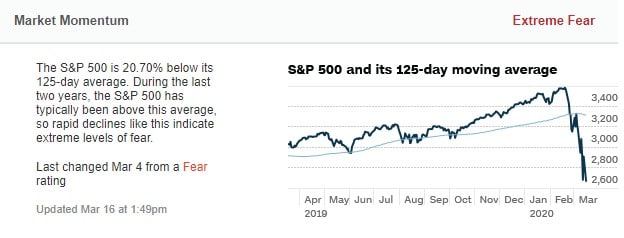
This indicator measures the momentum of stocks in the S&P 500 Index (SPX) versus its 125-day moving average.
Currently, the S&P 500 is 20.70 percent below its 125-day moving average – the level that it has usually traded above during the last two years. Rapid declines like this indicate an extreme level of fear.
On March 4, 2020, the indicator went from “fear” to “extreme fear.”
Stock Price Breadth
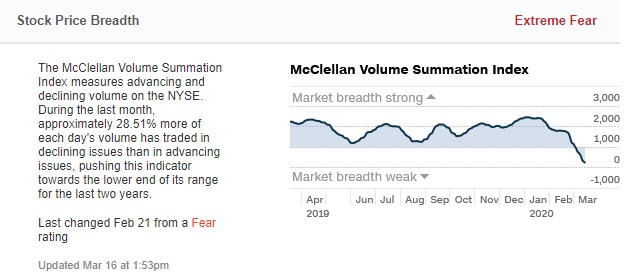
This indicator shows the volume of shares traded in advancing versus declining stocks. It is based on the McClellan Volume Summation Index. You can find more information about this indicator here.
During the last month, daily volume in declining stocks was 28.51 percent higher than in advancing stocks. The indicator is currently at the lower end of its two-year range.
On February 21, 2020, the “fear” reading was replaced by “extreme fear.”
Junk Bond Demand
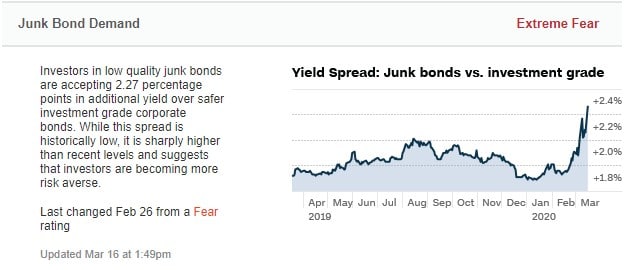
This indicator measures the spread between yields on investment grade bonds and junk bonds.
Currently, junk bond investors are requiring an additional yield of 2.27 percentage points over investment grade bonds, which are issued by companies with medium to good credit ratings. Historically, this spread has been low, but it has risen sharply from recent levels, indicating that investors have become more risk averse.
On February 26, 2020, the “fear” reading was replaced by “extreme fear.”
Development of the Fear & Greed Index over time
On September 17, 2008 – the height of the financial crisis – the S&P 500 Index fell to a three-year low and the Fear & Greed Index followed suit, plummeting to 12. The Fear & Greed Index then gained some ground and reached a reading of 28. Stocks eventually bottomed out on March 9, 2009, and the most recent bull market began.
This shows that the index is a good indicator of the highs and lows of the S&P Index.
When did the Fear & Greed Index last fall to 1?
The Fear & Greed Index last fell to the extreme level of 1 on March 12, 2020.
On that day, due to the coronavirus crisis, the Dow Jones dropped almost 10 percent, or 2,350 points, closing at 21,200. This was the heaviest loss since the stock market crash 33 years earlier, in October 1987. The Nasdaq technology index and the much-followed S&P 500 suffered similar losses.
On March 12, 2020, the coronavirus crisis caused the Fear & Greed Index to fall to its lowest possible reading of 1.

The Fear & Greed Index: conclusion
The Fear & Greed Index is closely watched for good reason, as it provides a quick, comprehensive overview of current market sentiment.
Read more:
