Time, price and volume are the three factors governing price formation in markets. The Market Profile is a graphic that links them.
Inhaltsverzeichnis
Development of the Market Profile
The Market Profile was developed by Peter Steidlmayer, a trader at the Chicago Board of Trade (CBOT), in the 1980s.
Steidlmayer was looking for a way to gain deeper insight into markets than was possible with classical charting. The result was the Market Profile.
At first, the Market Profile was only used by traders at the CBOT. Gradually, though, it was introduced to the general public.
It’s still relatively unknown in Germany despite its long existence.
Structure of the Market Profile chart
Whereas most charts plot price, the Market Profile plots time frames (e.g. 30 minutes). It allows you to quickly and easily determine the most important levels of the trading day. You can see where prices settled during the day and which levels the market considered “fair.”
Price distribution is calculated with the help of the normal distribution, with roughly 70 percent of values falling within one standard deviation from the average.
At first glance, a Market Profile chart looks somewhat confusing, but on closer inspection, it can help you make quick, useful conclusions about the market you’re following.
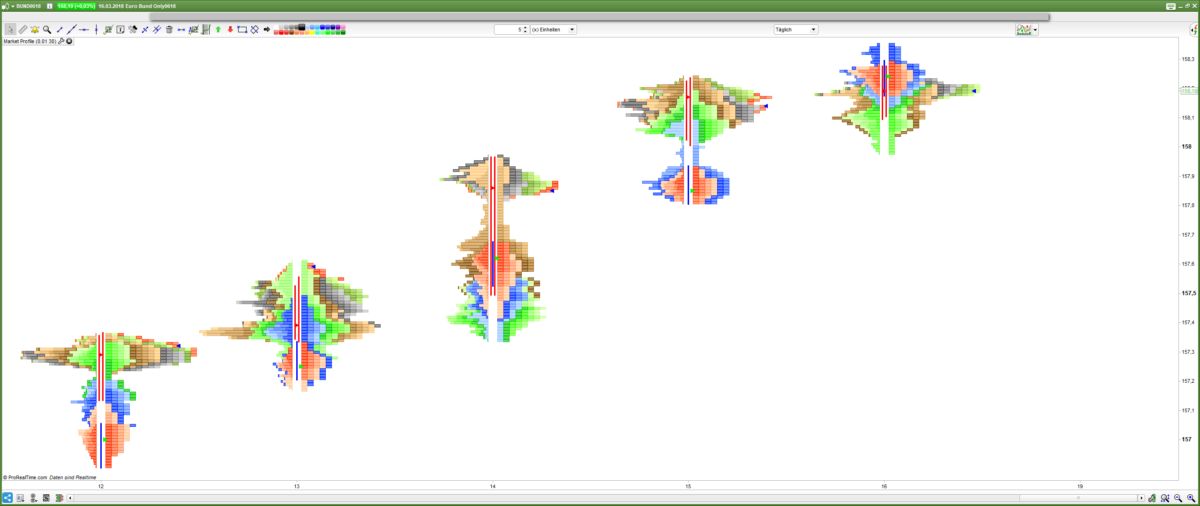
The following chart shows one week of trading in the Bund Future.

Note: The Market Profile charts in this article were generated by the ProRealTime charting software.
Each of the profiles represent one day of trading. In this example, they are divided into 30-minute time frames.
The most important Market Profile concepts are:
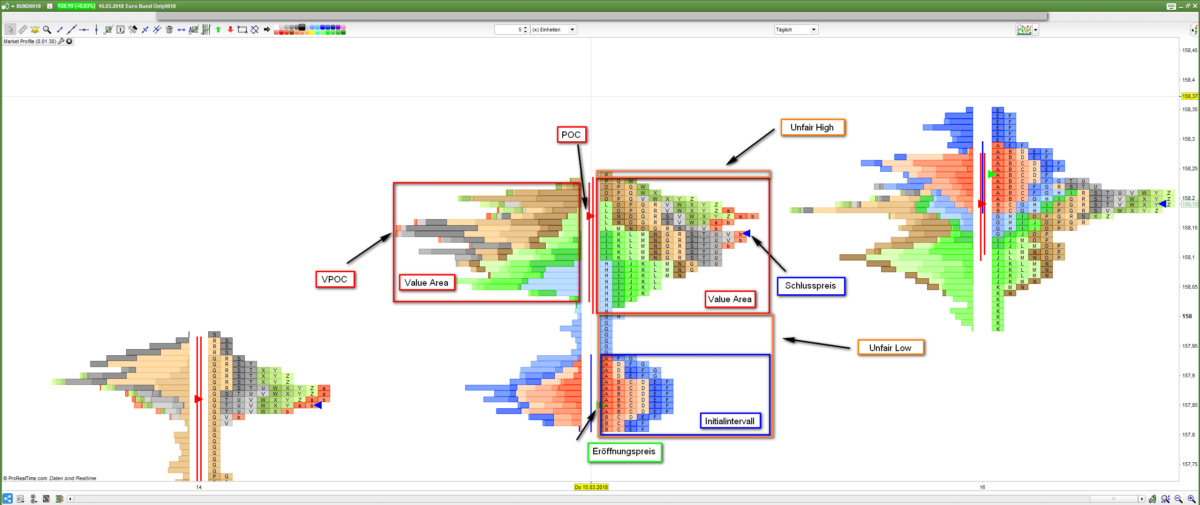
- The Point of Control (POC) shows the level where prices stayed for the longest time.
- The Volume Point of Control (VPOC) shows the level where the most volume was traded.
- The Value Area (VA) shows the price range in which at least 70 percent of trades took place. The value area for volume shows the range in which at least 70 percent of daily volume was traded.
- The Initial Range (vertical blue line) shows the price or price range in which trading occurred during the first two periods of the profile (A and B). This is also called the Opening Balance (OB).
- Unfair High is the overvalued price area.
- Unfair Low is the undervalued price area.
- Opening price (green triangle)
- Closing price (blue triangle)
Here is a detailed look at a daily profile:
The trading days are divided into time periods – in this example, 30 minutes each.
The letters displayed in the boxes are so-called Time Price Opportunities (TPOs). These are graphic representations combining time period and price range. Each TPO represents a trading opportunity at a given price.
The first period (representing the first 30 minutes of trading after the opening) is marked with an A, the next 30-minute period, with a B, and so on. Taken together, the first and second periods are called the Initial Range or Opening Balance (OB). If a column contains many identical letters, it means that a large number of prices were traded in a period. Uppercase letters are supplemented by lowercase letters to chart markets that have longer trading times than was originally the case at the CBOT.
A basic assumption of the Market Profile is that the prices within the normal distribution of 70 percent are fair. This area of the chart is referred to as the Value Area, or VA. Here there is a balance between buyers and sellers. The concept of normal distribution can also be applied to trading volume in order to identify the VA for volume as well. This is where at least 70 percent of daily volume traded.
The area above the VA is called the unfair high. Because the market is out of balance here, it is sometimes also referred as the overvalued price zone. The opposite is the unfair low, which is the undervalued price zone. Like the unfair high, the market is out of whack here. Market participants tend to reject prices in these zones, pushing them to the VA.
The Point of Control (POC) is the price or price range that was most traded during the period. There is a second type of POC, the Volume Point of Control (VPOC), which is the level where the most volume was traded. These two points are often, though not always, the same. In our example, they lie very close together, but are not identical.
The highs and lows of a profile composed of one letter are called “single print buying tails” and “single print selling tails.”
Profile types
- Normal Day (D Profile)
On a Normal Day, the Value Area, as well as the Point of Control, are close to the center of the Market Profile. Due to the release of news at the opening or to highly positive or negative market sentiment, the daily range is often established here in the first two hours of trading. The Market Profile is in equilibrium, but there is a wide Opening Balance. Single prints are often found above and below the VA – levels where the price has stayed only for a very time. This type of market structure indicates that no one is in control. The risk/reward ratio for day traders is very good, especially at the extremes. The larger the range, the better the risk/reward ratio for day traders.
- Normal Variation Day (b or p profile)
On a Normal Variation Day, most of the dynamic action occurs later in the trading day. This generates a Market Profile that is out of balance. The trading day is dominated by long-term players (buyers or sellers) who wait for the market to settle down. Afterward they establish the price they see as fair and take control of the market. This leads to a breakout from the OB. Ideally, the range of the breakout is two times the OB.
- Trend Day (I or l profile)
A Trend Day is another unbalanced Market Profile. Here, trading is once again dominated by long-term players. On a perfect Trend Day, the sequence of letters in an uptrend looks like this: low of letter A > B > C > D. In a downtrend, the sequence is: high of the letter A < B < C < D. However, price overlaps in the individual letters may appear. The profile tends to be narrower with fewer price rotations at a price level. There are rarely more than five TPOs per row. The VA is often very large and it is here that day traders find the best risk/reward ratios.
- Double Distribution Day (B Profile)
This type of Market Profile is also unbalanced. The OB is small, and initially a balanced area emerges. Then long-term players take over once again, driving the price in a different direction than the current normal distribution. This movement often occurs with a few single prints per period. Afterward another balanced area and a second normal distribution form.
- Neutral Day
On a Neutral Day, the profile is balanced, and the OB is smaller than on a Normal Day. An extremely small trading range can often be observed before holidays or the release of important economic data.
If the price closes at the center (i.e. in a state of balance), it’s called a Neutral Profile Center.
If the price closes near one of the day’s extremes, it’s called a Neutral Day Extreme.
- P Profile
P Profiles occur on days on which shorts are covered. The letters A or B make up the bottom with single prints in the OB. Afterward the market forms a value area above the opening.
Proactive versus responsive behavior
For Market Profile analysis, market participants are divided into three general groups:
- Long-term players
- Short-term players
- Day traders
Long-term players have a certain opinion about the market and act on this opinion by implementing the corresponding trading decisions. They are the only market participants who are able to start new trends.
Day traders aren’t interested in longer-term positions and have no particular opinion about the market. They simply follow the trend or try to identify imbalances. When short-term players and day traders dominate the market, it often results in sideways phases.
You should always ask yourself the following questions:
- Who is currently in control?
- Are other players active in the market?
- What is the market trying to do? In what direction is the market trying to move?
- Is the market successful? Is it acting efficiently?
- What important levels will the market try to test?
It’s also important to distinguish between behavior that is proactive (with respect to both buying and selling) and action that is a response at a particular level. Normally, proactive behavior is more aggressive. It’s also important to determine whether the prevailing buying behavior takes place above or below the previous day’s VA. Initiative Buyers or Sellers typically become active above the previous day’s VA and show greater conviction than Responsive Buyers or Sellers, who merely wait for an opportunity to enter.
When the market is outside the previous day’s VA, the greatest challenge facing traders is to determine whether the instability will be resolved by a return to the VA or whether the trend will continue.
Conclusion on the use of the Market Profile
The Market Profile is not an indicator in the traditional sense. It provides sound insights into the market that you can’t necessarily glean from classical charts. Even if you can answer many of the questions raised above by looking at a normal chart, a closer examination of the Market Profile can often be useful. The charts look somewhat confusing at first, but after a short training period, you will be able to understand and apply them easily.
Read more
