The US Dollar to Swiss Franc (USD/CHF) exchange rate is a Forex major pair and one of the world’s most traded currency pairings.
In this article we make a US-Dollar / Swiss Franc price prediction and longterm forecast. We would like to give an assessment of the future price development of US-Dollar / Swiss Franc. We look at all important time frames like the daily, weekly and monthly chart, but also the long term charts for USD/CHF, which are the quarterly and yearly charts. The basis of our analysis is the Price Action and Technical Chart Analysis.
The charts used are from TradingView and the prices are from FXCM.
USD/CHF forecast: Daily chart
Last Update: July 25, 2021
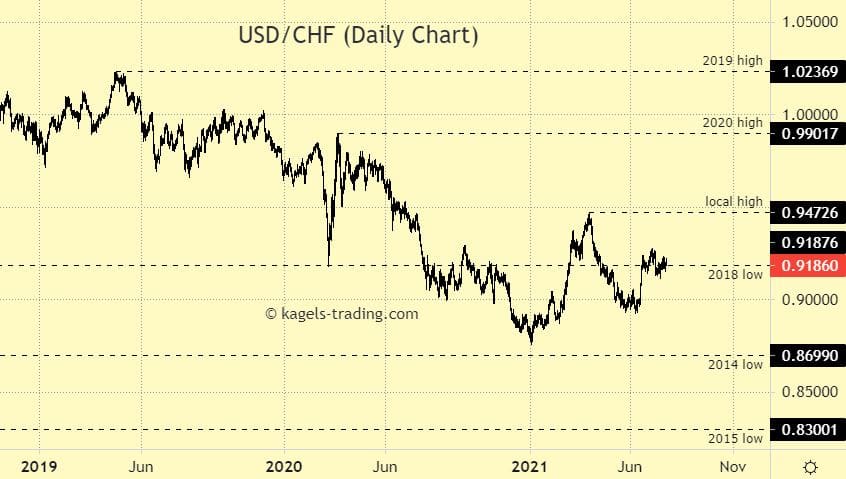
The daily chart of the USD/CHF currency pair shows an established downtrend. After a recovery near 0.9500, the price was rejected and created the June low at 0.8926. Recent candlesticks could regain the price levels at around 0.9100.
Resistance: 0.9187 | 0.9472
Support: 0.8699 | 0.8300
USD/CHF Forecast: The daily chart of USD/CHF looks neutral. If the local high can be overcome sustainably, a trend reversal could be imminent. A price advance above the 2020 high at 0.9901 would turn this chart to positive.
USD/CHF forecast: Weekly chart
Last Update: July 25, 2021
The weekly chart of the USD/CHF currency pair shows an established downtrend. The last price advance was rejected and is now quoted at around 0.9180.

Resistance: 0.9187 | 0.9472
Support: 0.8699 | 0.8300
USD/CHF Prediction: The weekly chart of USD/CHF looks neutral. If the local high can be overcome sustainably, a trend reversal could be imminent. A price advance above the 2020 high at 0.9901 could turn the outlook of this chart to positive.
USD/CHF forecast: Monthly chart
Last Update: July 25, 2021
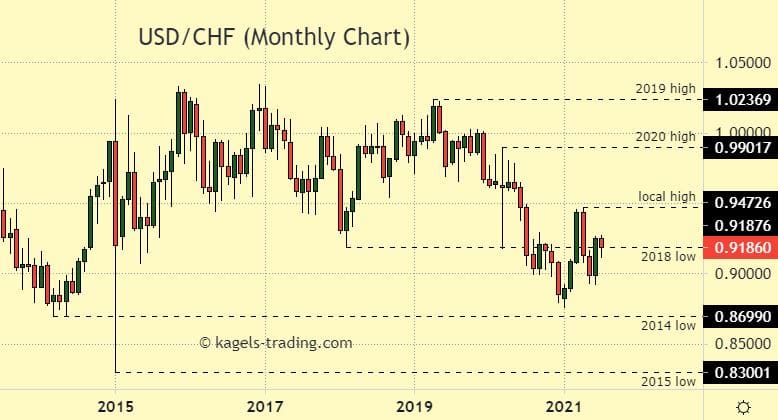
On the monthly chart of the USD/CHF, we see an established downtrend. The major currency pair is dealing with the 2018 low.

Resistance: 0.9187 | 0.9472
Support: 0.8699 | 0.8300
USD/CHF Prediction: The monthly chart of USD/CHF looks neutral. The recovery above the 2018 low could lead to sideways action. A price advance above the 2020 high at 0.9901 would turn the outlook of this chart to positive.
USD/CHF forecast: Quarterly chart
Last Update: July 25, 2021
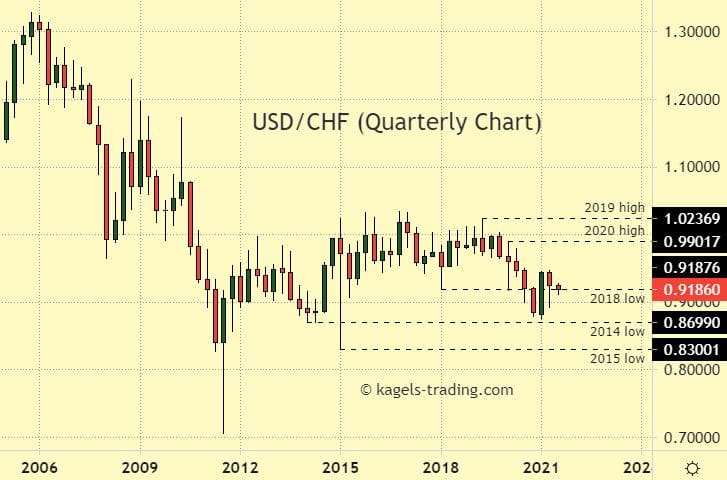
On the quarterly chart, USD/CHF is moving in an defined downtrend. After finding support at the 2014 low, the price recovered at areas around 0.9180.

Resistance: 0.9187 | 0.9901 | 1.0236
Support: 0.8699 | 0.8300
USD/CHF Prediction: The quarterly chart of USD/CHF looks neutral. The movement around the 2018 low could lead to sideways action. A price advance above the 2019 high at 1.0236 would turn the outlook of this chart to positive.
USD/CHF prediction: Yearly chart (Historical chart)
Last Update: July 25, 2021
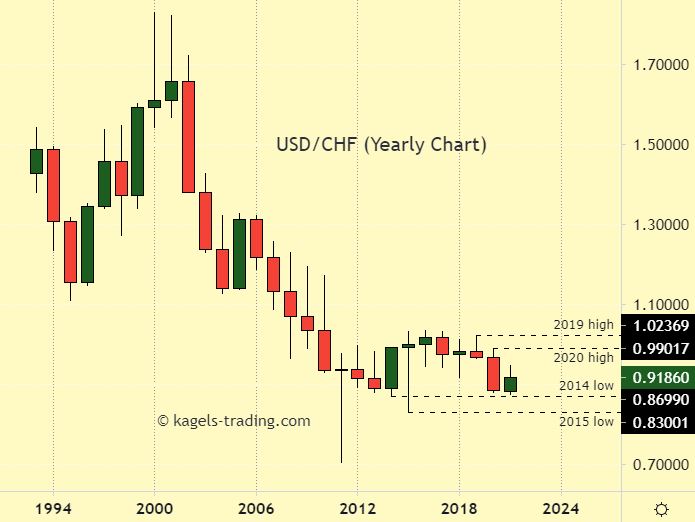
The last nine years USD/CHF is moving sideways in a big trading range below the psychological important level of 1.0000. In the year 2020 USD/CHF has shown weakness and has currently found support above the 2014 low at 0.8699.

Resistance: 0.9901 | 1.0236
Support: 0.8699 | 0.8300
USD/CHF Prediction: The yearly chart of USD/CHF looks negative with strong resistance above 1.000. We expect to see a continuation of the sideways movement above the 2015 low (0.8300).
What is the current price of USD/CHF ?
The current price of USD/CHF you can see here.
About USD/CHF
The Currency Pair USD/CHF is the shortened term for the US-Dollar against Swiss Franc, or cross for the currencies of the United States (USD) and Switzerland (CHF). … For example, if the pair is trading at 0.9780, it means it takes 0.9780 U.S. dollars to buy 1 Swiss Franc.
*This price prediction is based on the data collected from various sources. This should not be considered as an investing parameter and user should do their own research before investing.
Do you think our predictions are accurate? What are your thoughts on the methods used to reach our conclusions? Let us know in the comments below.
