The US Dollar to Canadian Dollar (USD/CAD) exchange rate is a Forex major pair and one of the world’s most traded currency pairings.
In this article we make a US-Dollar / Canadian Dollar price forecast and long-term prediction. We would like to give an assessment of the future price development of USD/CAD. We also look at the long term charts for USD/CAD, which are the yearly, quarterly or monthly chart. The basis of our analysis is the Price Action and Technical Chart Analysis.
The charts used are from TradingView and the prices are from FXCM.
USD/CAD Forecast: Daily chart can regain the 1.2600
Last update: November 21, 2021
In the daily chart we see USD/CAD Forex pair trading in an established downtrend. The the recent development was marked by an impressive recovery from support at the price mark of the low from 2017. Last candlesticks showing the attempt to break above 2019 low resistance, were rejected and slipped through possible support around the April high. Also, the low from September at 1.2493 was undercut.
Over the course of the past week, the price has been able to recover above the 1.2600 price mark and stays within reach for the April high.
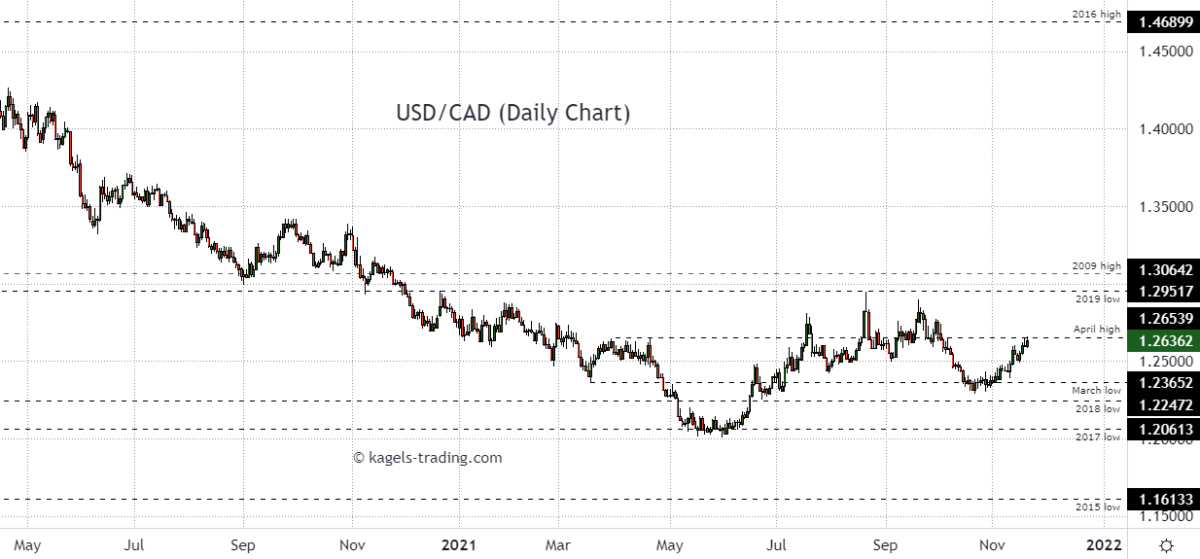
Resistance: 1.2653 | 1.295 | 1.3064
Support: 1.2365 | 1.2247 | 1.2061
USD/CAD Forecast: The daily chart of USD/CAD could form a trend reversal, but shows upcoming weakness. The development classifies the chart picture still as neutral, and a possible price advance above the key resistance zone around 1.3000 would turn the chart picture into positive. The last local low is located at 1.2007.
The recovery from the March low at 1.2365 might cause more upside potential as support could confirm now.
USD/CAD price prediction: Weekly chart heading for April high
Last update: November 21, 2021
USD/CAD on the weekly chart is moving in an established downtrend. The recent recovery showed a run-up against the 2019 low but was rejected. Prices quoted at 1.2636 are now challenging the resistance at the April high again.
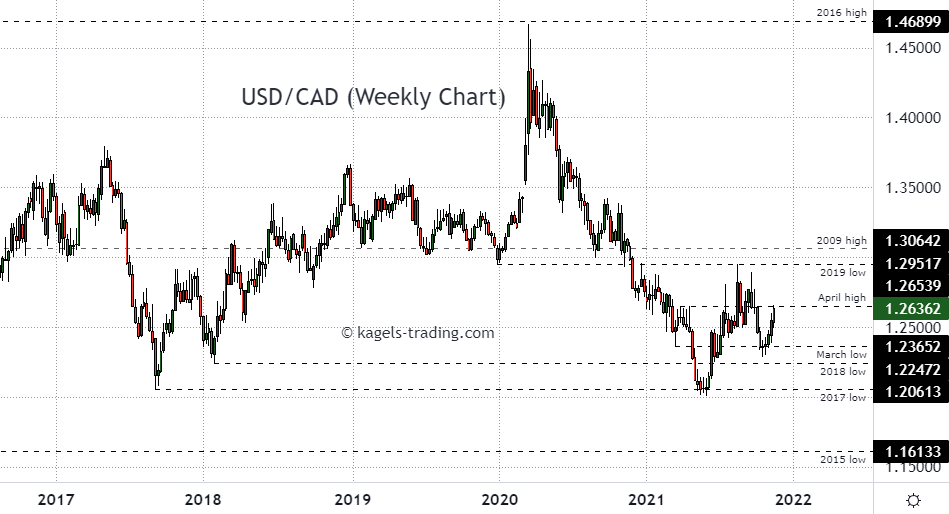
Resistance: 1.2653 | 1.295 | 1.3064
Support: 1.2365 | 1.2247 | 1.2061
USDCAD prediction: The weekly chart of USD/CAD looks neutral with a fading positive outlook. The rejected breakout attempt above the 2019 low could cause sideways action, and only a price advance above key resistance around 1.3064 would turn the chart picture into positive.
USD/CAD price prediction: Monthly chart
Last update: November 21, 2021
USD/CAD on the monthly chart was rejected at the 2019 low and is trading below the April high. We see a downward move from 2016 high level since March 2020 with a strong candlestick in June. The month of July tried to break above the resistance at the April high, but was rejected. August and September were also challenging this levels after a run-up against resistance at around 1,3000. October closed weak below the April high, the current month of November can regain the 1.2600 level.
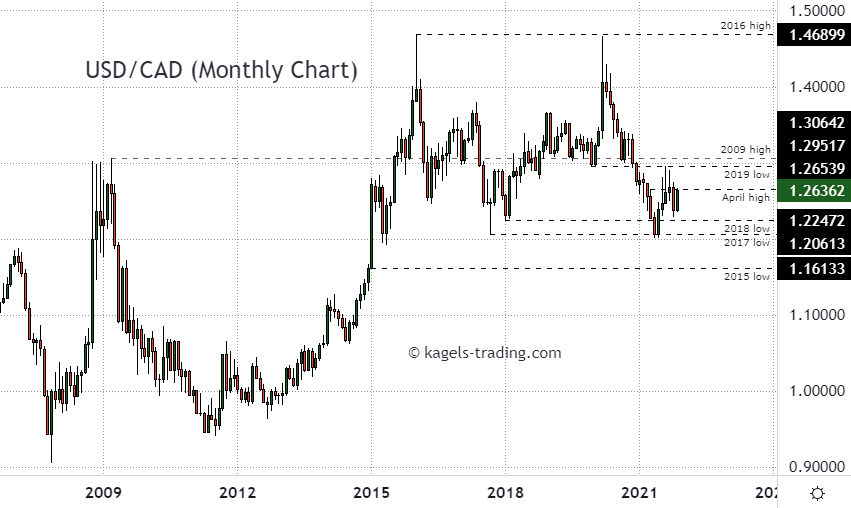
Resistance: 1.2653 | 1.2951 | 1.3064
Support: 1.2247 | 1.2061
USDCAD prediction: The monthly chart of USD/CAD looks negative to neutral. Prices could recover from support around the 2017 low. A further price advance above key resistance around 1.3064 could turn the chart picture to positive.
USD/CAD Forecast: Quarterly chart
Last update: November 21, 2021
On the quarterly chart of USD/CAD we can see a big trading range for the last six years. The major forex pair is moving sideways between 1.2000 and 1.4700 and possibly heading for resistance of the 2019 low again.
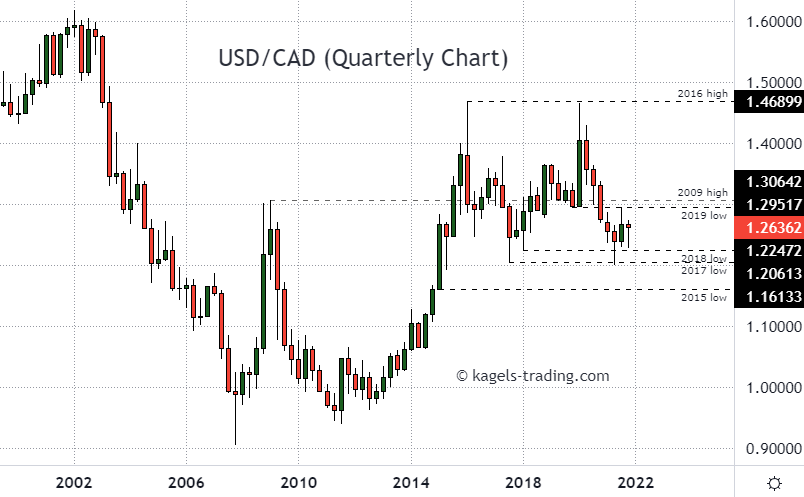
Resistance: 1.2951 | 1.3064
Support: 1.2247 | 1.2061 | 1,1613
USD/CAD outlook: The quarterly chart of USD/CAD looks negative to neutral. We expect a continuation of the big trading range. Only a price advance above key resistance around 1.3064 could turn the chart picture to positive.
USD/CAD Outlook: Yearly chart (Historical chart)
Last update: November 21, 2021
On the yearly chart of USD/CAD we can see a big trading range for the last six years. The major forex pair is moving sideways between 1.2000 and 1.4700.
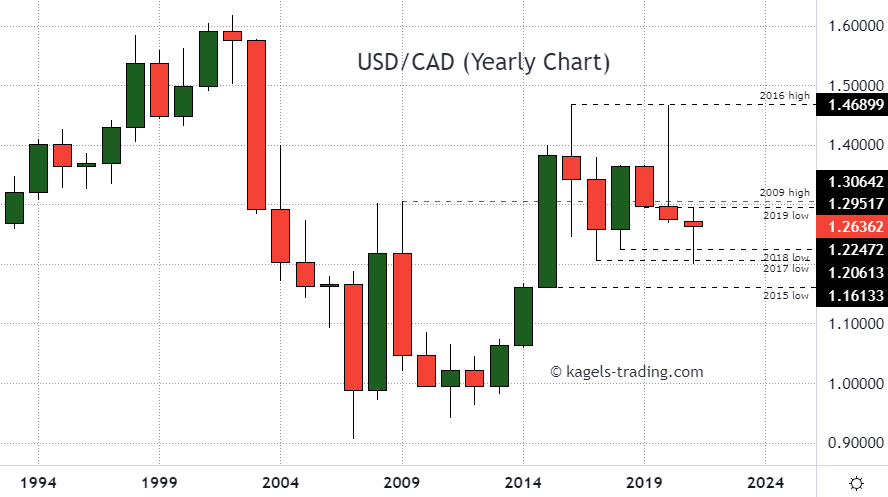
Resistance: 1.2951 | 1.3064
Support: 1.2247 | 1.2061 | 1,1613
USD/CAD Forecast: The yearly chart of USD/CAD looks negative to neutral. We expect a continuation of the big trading range.
What is the current price of USD/CAD ?
The current price of USD/CAD you can see here.
About USD/CAD
The Currency Pair USD/CAD is the shortened term for the US-Dollar against Canadian Dollar, or cross for the currencies of the United States (USD) and Canada (CAD). For example, if the pair is trading at 1.3300, it means it takes 1.3300 Canadian Dollar to buy 1 US-Dollar.
*This price prediction is based on the data collected from various sources. This should not be considered as an investing parameter and user should do their own research before investing.
Do you think our predictions are accurate? What are your thoughts on the methods used to reach our conclusions? Let us know in the comments below.