In this article and technical analysis we would like to a provide a 30 Year US Treasury Bond Forecast and long term prediction. We would like to give an assessment of the further price development of the US Treasury Bonds.
We look at the long term charts for Treasury Bond Futures (ZB), which are the yearly, quarterly and monthly charts . The basis of our analysis is Price Action and Technical Chart Analysis.
The charts used are from TradingView and the prices are from CBOT.
Last update: June 18, 2020
T-Bond Futures Yearly Chart (12-month-chart) in long term Uptrend
In the yearly chart of the T-Bond Future , we see a long-term upward trend with a low in 2000 at 89’07 and the all-time high at 191’22 in 2020.

Next let’s take a look on the quarterly chart.
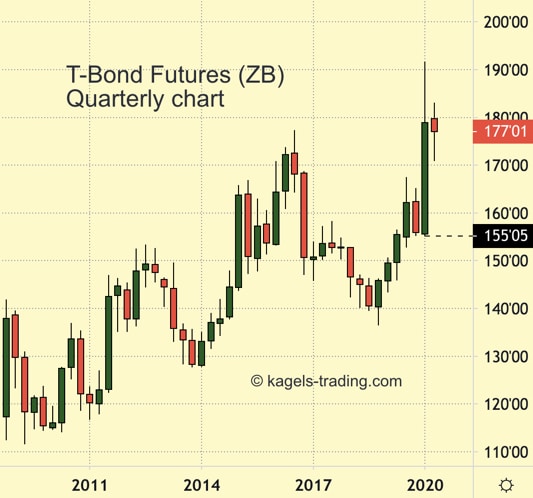
T-Bond Future Quarterly Chart (3-month chart)

In this quarterly chart of the T-Bond Futures we can see more details of the price movement. Prices reached a historic high at 191’22 in the first quarter of 2020. (Last update: June 16, 2020)
Treasury Bond price forecast and longterm prediction
We see a stable and intact uptrend, where prices may continue to rise. The next price target could be the alltime high at 199’22. The positive longterm outlook becomes obsolet when the low of 2020 at 155,05 will be reached.
What is the current price of Treasury Bond Future?
You could check the current price of Treasury Bond Futures here.
About T-Bond Futures
Treasury Bond Futures are trades on CME.
*This price prediction is based on the data collected from various sources. This should not be considered as an investing parameter and user should do their own research before investing.
Do you think our predictions are accurate? What are your thoughts on the methods used to reach our conclusions? Let us know in the comments below.
Disclaimer: This article is not trading advice and should not be construed as such. Always consult a trained financial professional before investing in T-Bond Futures, as the market is particularly volatile.