The Euro to US Dollar (EUR/USD) exchange rate is one of the world’s most traded currency pairings.
In this article we make a Euro/US-Dollar forecast and longterm price prediction. We would like to give an assessment of the future price development of EUR/USD. We look at all important time frames like the daily, weekly and monthly chart, but also the long term charts for EURUSD, which are the quarterly and yearly charts. The basis of our analysis is the Price Action and Technical Chart Analysis.
The charts used are from TradingView and the prices are from FXCM.
EUR/USD Forecast: New interim low
Last update: November 21, 2021
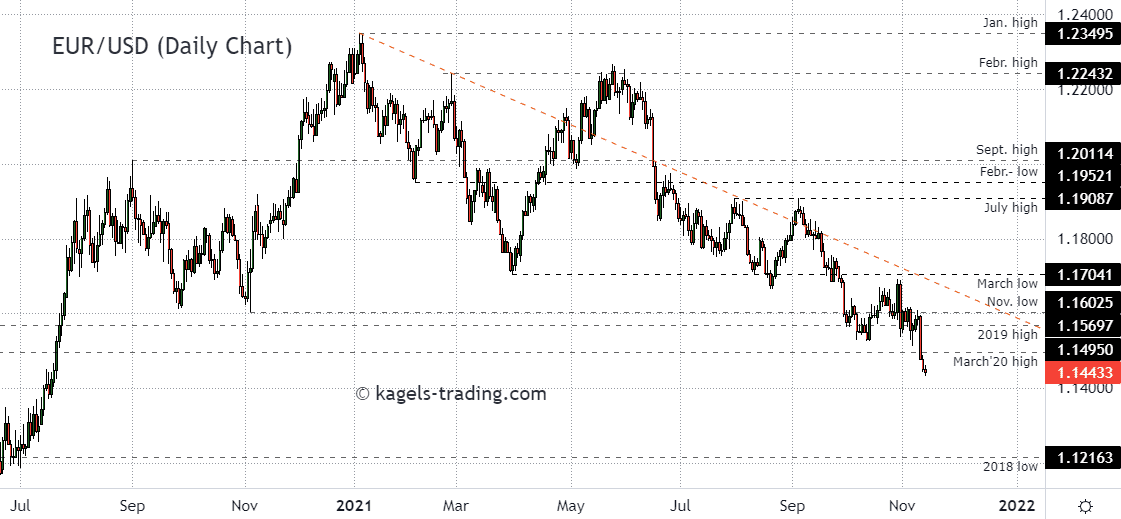
At the time of analysis, the EUR/USD was trading at 1.At the time of analysis, the EUR/USD was trading at 1.1289. Starting from a local high at the beginning of the year, a correction has formed to below 1.1750. The subsequent interim recovery was characterized by an almost constant upward movement. However, in the recent course, the EURUSD has lost the supports above 1.1900.
Since mid-September, the price has been correcting from a run-up to the July high. The support of the July low was broken, in the further course the low from November 2020 and most recently also the high from March 2020 were undercut.
In the course of last week, downward pressure generated a new local low at 1.1250 and could not regain 1.1300 for the time being.

Resistance Levels: 1.1495 | 1.1569 | 1.1602
Support Levels: 1,1216 | 1,0636
Forecast: With the current low at 1.1250, the downtrend structure remains active. After the sharp price losses, support could form here for a technical countermovement to the area between 1.1400 and 1.1500.
EUR/USD Forecast: Weekly chart breaks below 1,1300
Last update: November 21, 2021
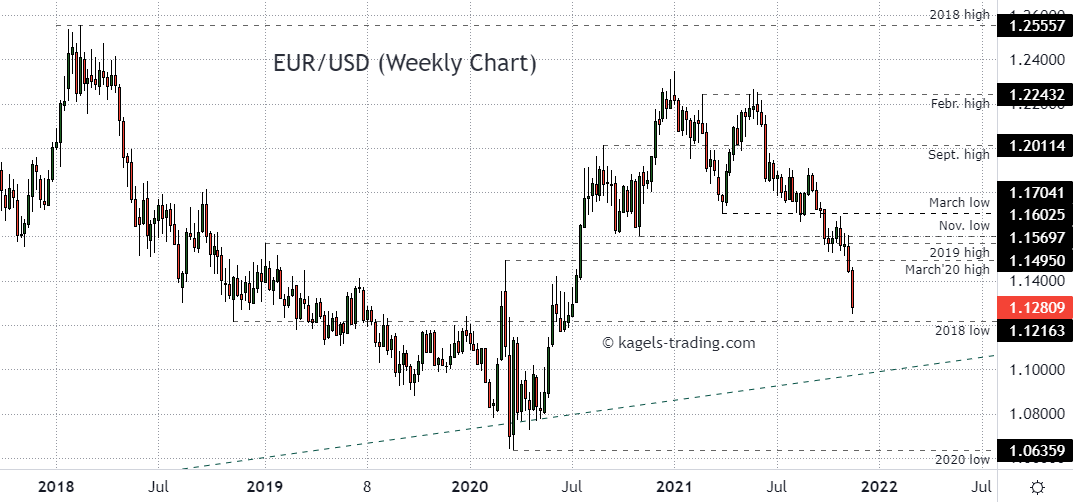
As a result of a progressive correction from the 2021 high, the EURUSD fell to a local low in March at 1.1704. After that, the price recovered and encountered resistance at the February high, from which it has fallen back sharply.
After the price slumped significantly and took out close supports, it failed to hold the 1.1600 level and was also rejected at the March low. After breaking the 2019 high, it also lost the supports of the next marks.

Resistance: 1.1495 | 1.1569 | 1.1602
Support: 1,1216 | 1,0636
Forecast: With the break below the high March 2020, the chart remains weak. The last weekly candlestick puts pressure on the 2018 low.
With a break below it, in the big picture, the low from last year at 1.0636 would be the overarching price target. The round marks form potential support, with 1.1200 the next likely target.
Euro-Dollar Forecast: November significantly weaker
Last update: November 21, 2021
Euro-Dollar forex pair shows a weak candlestick in March dropping below 1.1800 price levels. April was able to recover the losses. In the month of may, the strength could hold up reaching towards 1,2200 price levels. June has weakened and closed below the low from May.
The month of July initially continued this weakness, but then recovered from the monthly low to close at 1.1868. This slight recovery was eroded by August. After the month of September failed to stabilize above 1.1600, October also shows losses and closed at the low of the previous candle. The current November continues to give and breaks with the 1.1300 level.

Resistance Levels: 1.1569 | 1.1876 | 1.2349
Support: Levels: 1,1150 | 1,0636
Euro-Dollar Forecast: The downward trend line, which was previously considered overcome, is coming under pressure again with the current development. The attempt to reach the annual high from 2018 was aborted prematurely and the price has now fallen back below 1.1300. The next significant support could be found at the intersection of the trend lines at around 1.1150.
Should the price also fall below that, the focus will be on the low from 2020 as a price target. This is likely to be the threshold between sideways movement and downward trend.
EUR/USD Prediction: Long-term downward trend line remains under pressure
Last update: November 21, 2021
Euro-Dollar forex pair is breaking below the low of the previous candlestick at prices around 1.1280.

Resistance Levels: 1.1569 | 1.1876 | 1.2555
Support Levels: 1,1150 | 1,0636
EUR/USD Prediction: We are looking at a positive chart picture. However, the EUR/USD pair has turned down in the area of the 2018 high, which could currently be followed by another test of the long-term support line.
The cross of the trend lines should show whether the upward movement towards the long-term resistance line can be resumed.
Euro/Dollar Forecast: Yearly chart (Historical chart)
Last update: November 21, 2021
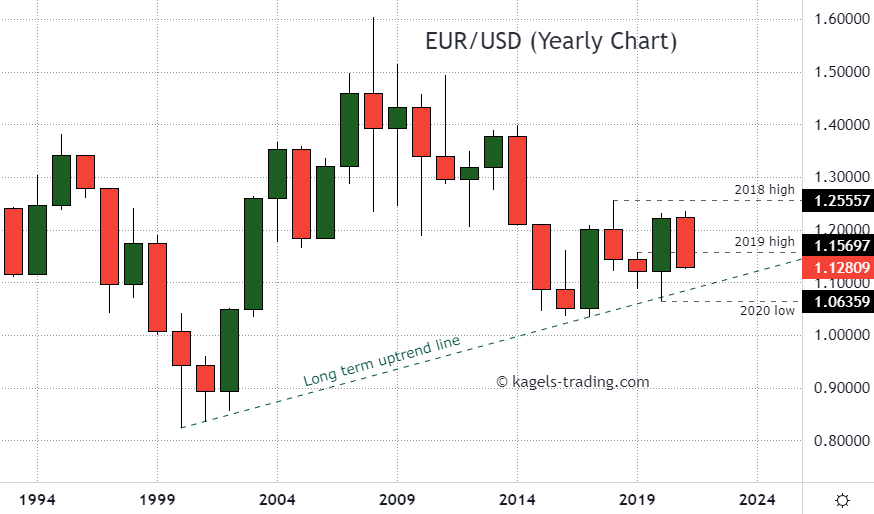
If we look at the yearly chart of the EURUSD currency pair, we see a long-term downtrend that originated at the 2008 high at 1.6038. This could be terminated, because in the last six years EUR/USD is moving sideways in a big trading range. The long term uptrend line is mayor support which was successfully testet with the 2020 low.

Resistance Levels: 1.1570 | 1.1876 | 1.2555
Support Levels: 1,1150 | 1,0636
EUR/USD Prediction: The yearly chart of EUR/USD looks neutral to slightly negative because the price has lost the strong support at 1.1570 (2019 high). The picture of the yearly chart would turn negative if the support line gets in trouble and the 2020 low at 1.0635 is breached.
What is the current price of EURUSD ?
The current price of EURUSD you can see here.
About EUR/USD
The Currency Pair EUR/USD is the shortened term for the euro against U.S. dollar pair, or cross for the currencies of the European Union (EU) and the United States (USD). … For example, if the pair is trading at 1.10, it means it takes 1.1 U.S. dollars to buy 1 euro.
Common European currency was introduced in 1999. Euro currency in cash entered into circulation 3 years later – in 2002. Before that, the non-cash Euro and German marks, French francs, and other European currencies in cash were in circulation simultaneously.
When introducing Euro in January, 1999, the European Central Bank fixed its exchange rate against the US Dollar as 1.1743 dollars for 1 Euro.
*This price prediction is based on the data collected from various sources. This should not be considered as an investing parameter and user should do their own research before investing.
Do you think our predictions are accurate? What are your thoughts on the methods used to reach our conclusions? Let us know in the comments below.