In this article we make a Crude Oil price forecast and longterm prediction. We would like to give an assessment of the future price development of the Light Crude Oil Futures (WT). We look at all important time frames like the daily, weekly and monthly chart, but also the long term charts for Crude Oil, which are the quarterly and yearly charts with logarithmic scale. The basis of our analysis is Price Action and Technical Chart Analysis.
The charts used are from TradingView and the prices are from the Gold Futures traded at NYMEX.
Crude Oil (WTI) Price Forecast: Daily Chart would like to overcome the high from 2018
Last update: July 25, 2021
The Crude Oil price on the daily chart shows an established uptrend. The market has climbed above important resistance level of 2010 low, where the recent correction found support after prices got rejected from resistance around 2018 high levels.

Resistance: 76.90
Support: 67.15 | 65.65
Crude Oil price forecast: We expect to see a continuation of the established uptrend. The current movement may last, as long as Crude Oil prices could hold above 67.15. Next important price target is now the 2018 high. Prices below $65 could lead back to broader sideways action.
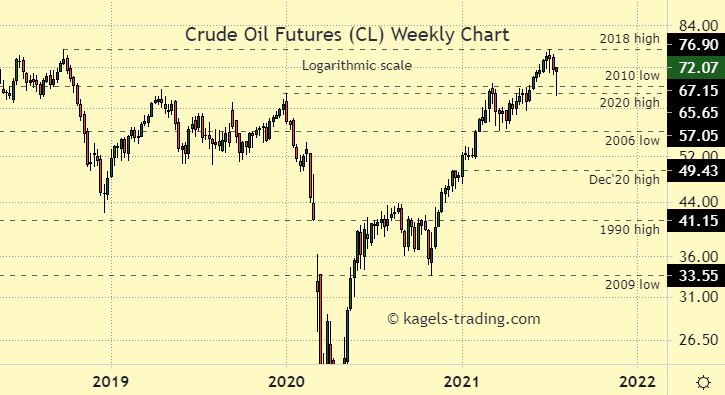
Crude Oil (WTI) Price Forecast: Weekly Chart showing support
Last update: July 25, 2021
The Crude Oil price on the weekly chart shows a defined short-term uptrend and could recover above important levels, heading towards 2018 high.

Resistance: 76.90
Support: 67.15 | 65.65
Crude Oil price forecast: We expect to see a continuation of the current uptrend. Prices above $67.15 could lead to more strength and price advance until $76.90. On the flip side, prices below $57 could lead to weakness and downside potential to the Dec’20 high at 49.43.
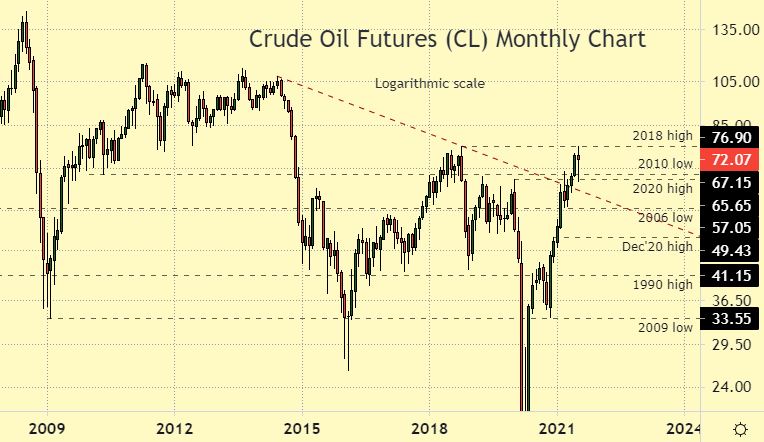
Crude Oil (WTI) Price Forecast: Monthly Chart
Last update: July 25, 2021
The Crude Oil price on the monthly chart seems to have found key support at the 2009 low around the 33.55 level. Since January, we have seen strong Crude Oil prices that could prevail against the emerging hurdles. Most recently, the price was able to regain the low from 2010. July had a first peek at the 2018 high levels.

Resistance: 76.90
Support: 67.15 | 65.65
Crude Oil price forecast: We expect to see more strength and price advance after breaking through the resistance line. Prices back below $67 would lead to sideways action or possible weakness.
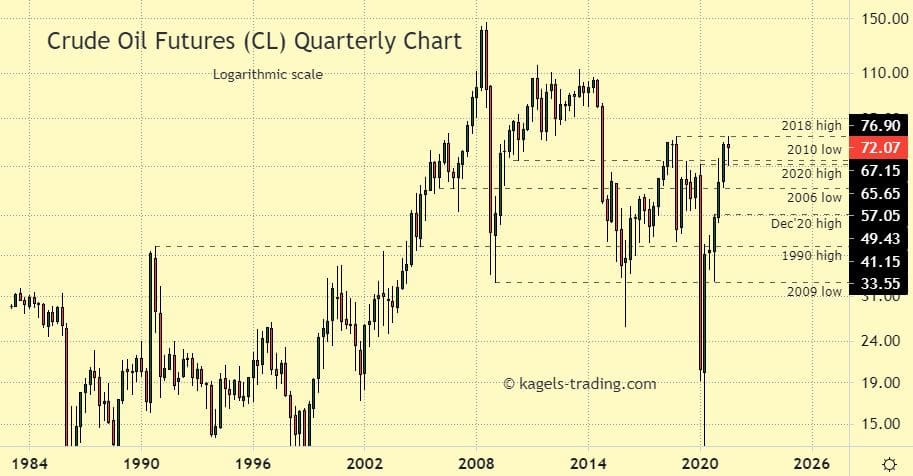
Crude Oil (WTI) Price Outlook: Quarterly Chart
Last update: July 25, 2021
The Crude Oil price shows a major support zone between the 2009 low at 33.55 and the 1990 high at 41.15. Currently, the price was rejected from the resistance at the 2018 high.

Resistance: 76.90
Support: 67.15 | 65.65
Crude Oil price outlook: After moving above the passed resistance levels, we expect a continuation of the price advance which we have seen in the first quarters of 2021. Next major hurdle could be the 2018 high at 76,90. On the flip side, prices below $57 could lead to weakness and downside potential to the 2009 low at 33.55.
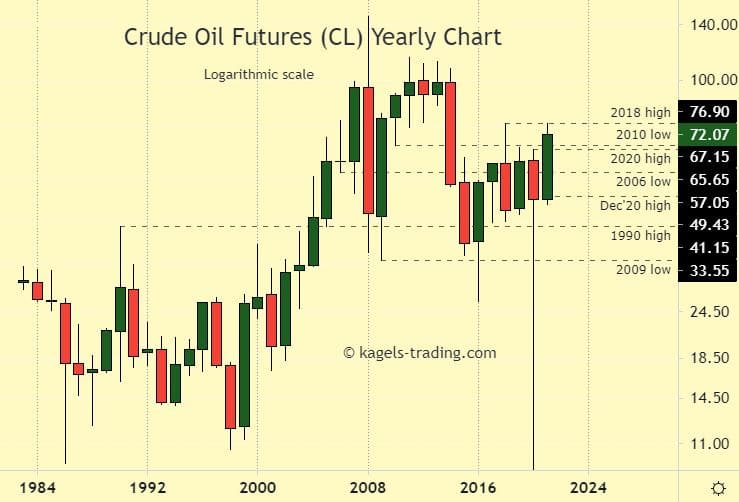
Crude Oil (WTI) Price Predictions: Historical Chart – Yearly Chart
Last update: July 25, 2021
The Crude Oil price on the yearly chart shows a trading range or sideways price action for the last six years. The panic low in 2020 was at (negative) $ -40.32 as a reaction to corona crash.

Resistance: 76.90
Support: 67.15 | 65.65
Crude Oil price predictions: We expect to see a continuation of trendless price action between $40 and $77. Prices below $40 could lead to more weakness and downside potential to the 2009 low at 33.55. On the flip side, a break above the 2018 high could unleash more strength.
What is the current price of Crude Oil (WTI) Futures ?
The current price of Crude Oil (WTI) Futures you can see here.
*This price prediction is based on the data collected from various sources. This should not be considered as an investing parameter and user should do their own research before investing.
Do you think our predictions are accurate? What are your thoughts on the methods used to reach our conclusions? Let us know in the comments below.