In this article you’ll learn all you need to know about the COT report and the COT data contained therein.
COT data are regularly published by the Commodity Futures Trading Commission (CFTC) in its Commitments of Traders (COT) report. The COT report is available on the CFTC’s website.
The COT data provide insight into the trading activities and open futures positions of market participants who are subject to reporting requirements. It is a popular tool for many traders, as it allows them to track the activities of these insiders.
The closely followed data cover open trading positions of the most important market players as of the close of trading every Tuesday. They are released every Friday at 3:30 pm Eastern Time (9:30 pm in Germany).
Inhaltsverzeichnis
The positioning of market participants in the COT report is a zero-sum game
The COT report lists all the open futures and options contracts of market participants, also known as open interest.
Because each buyer is matched by a seller, the sum of open interest across all market players is always zero. Although futures are thus a zero-sum game, the positioning of the various market players can provide important and useful information.
There are basically three major groups of participants whose open positions are covered by the COT data: commercials, non-commercials and non-reportables. But there is now an extended COT report that lists even more.
The market participants included in the COT report
Let’s take a more detailed look at the role played by these market participants.
Commercials
Commercial traders are the best-informed group of market participants, as they engage in the production, processing and marketing of the underlying commodities. They are mainly large traders who use futures contracts to hedge physical inventories and planned commodity deliveries and thus hold the corresponding counter-positions. These insiders are also referred to as “smart money.”
Non-Commercials
The non-commercials are often described as large speculators and include hedge funds and other traders that have a speculative motive for their activity in the futures market. In other words, they have an entirely different background than commercials. For the most part, non-commercials are profit-oriented – unlike the commercials, who generally hedge against business risks.
Non-reportables
Non-reportables are the group of market players who aren’t subject to reporting requirements because they don’t hold large enough positions. They usually consist of small investors who are sometimes called “dumb money.” The volume of contracts held by this group is equal to the difference between total open interest and the reportable positions of the commercials and non-commercials.
(Liste der Märkte im CoT-Report)
The extended COT report
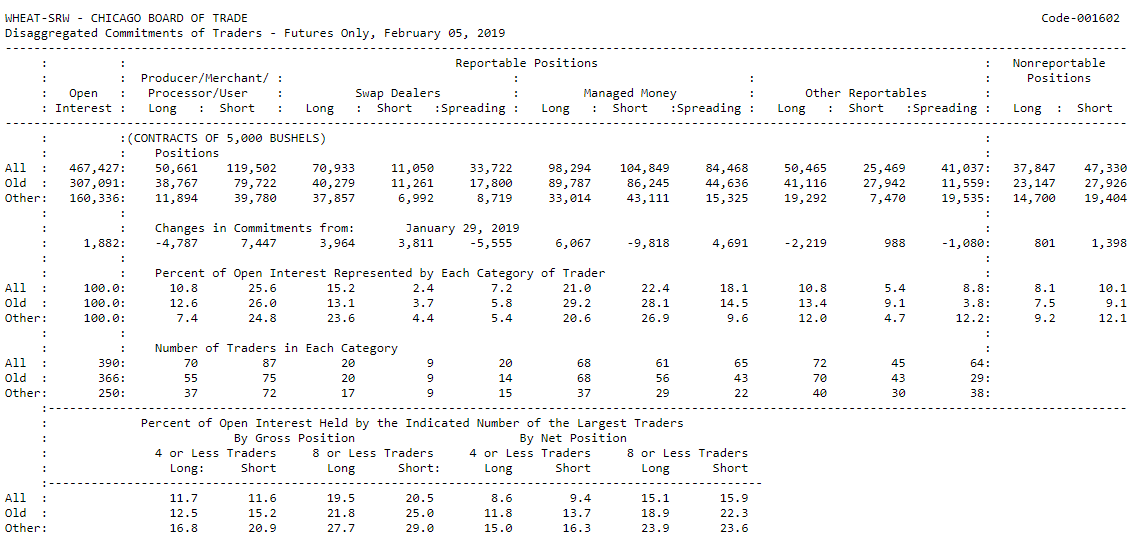
The CFTC began releasing an extended COT report on September 4, 2009. This more detailed publication includes data on 22 commodity markets and divides the reportable market participants into four groups:
- Producers
- Swap dealers
- Money managers
- Other reportables
Producers and swap dealers correspond to the commercials in the traditional report – both groups use the futures market for hedging purposes. The only difference is that producers hedge risks arising from business operations with physical commodities, whereas swap dealers hedge risks from swap transactions.
Money managers pursue speculative activities for their clients.
Another special feature of the extended COT report is that it no longer totals the counter-positions in the different markets but reports them separately.
Other types of COT reports
In addition to the traditional and extended versions of the COT reports, the CFTC releases COT data in other forms. TheTraders in Financial Futures report, for example, breaks down market participants into the following categories:
- Asset manager/institutional: institutional investors such as funds and insurance companies.
- Leveraged funds: hedge funds, including CTAs and proprietary traders.
- Other reportables: large traders don’t fit into any of the above categories, including corporate treasuries, central banks and smaller banks.
Another publication, the Commodity Index Traders (CIT) report, shows the positioning of index-tracking funds.
History of the COT report
The antecedents of the COT reports can be traced to 1924. That year the Grain Futures Administration of the US Department of Agriculture, which was the predecessor to the USDA Commodity Exchange Authority and the CFTC, published its first comprehensive annual report on hedging and speculation in the futures markets.
Starting June 30, 1962, COT data were released on a monthly basis. At the time, the COT report covered 13 agricultural commodities and was an additional instrument introduced by policymakers to increase transparency in the futures markets. It provided the public with basic up-to-date information about futures positions.
Over the years, the CFTC has continued to enhance transparency and improve publicly available information about the futures market. At first the COT reports were published on a monthly basis, from 1992, every two weeks, and since 2000, on a weekly basis.
In 1993 the CFTC moved from a subscription-based mailing list to fee-based electronic access. Beginning in 1995, the reports became freely available on its website.
In addition, over the years, the COT report has been continually expanded to include additional markets and more in-depth information on the positions of the respective market participants. New types of reports have also been added.
Reading the COT Report – a detailed explanation based on the example of gold.
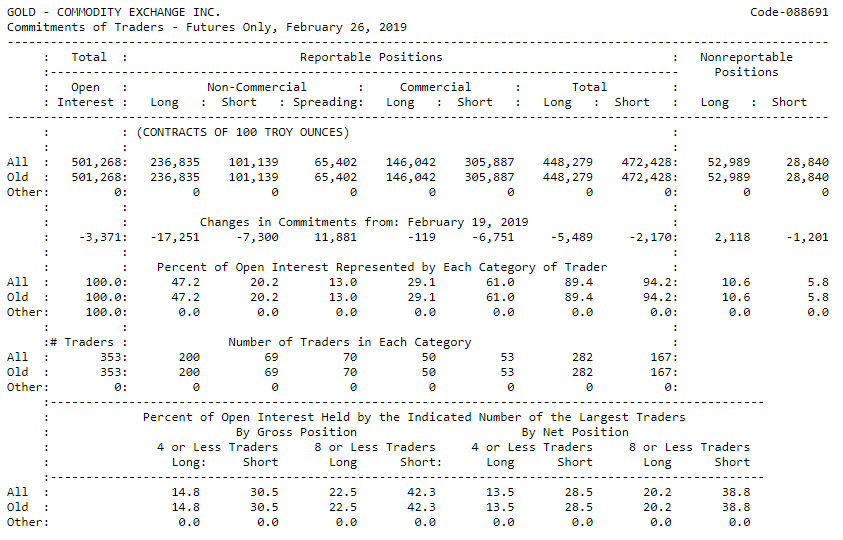
Here you can see a COT report on gold, which I will explain in greater detail below.
The first line identifies the market covered by the report – in this case, gold. Gold futures trade on the COMEX. The next line reads “COT Report Futures Only,” which means that the report only includes futures positions.
The CFTC also publishes a report called “Futures and Options Combined.” This and the “Futures Only” report are available in both long and short versions, with the long version providing a more granular view of the market. The report above is dated February 26, 2019.
The next line reports on the market participants and their positions. The categories are “Non-Commercial,” “Commercial” and “Nonreportable Positions.”
Open interest is the sum of all open futures contracts – in this report 501,268. The non-commercials hold 236,835 long, 101,139 short and 65,402 spreading positions. The commercials have considerably more short commitments than long commitments (305,887 versus 146,042). The total number of longs held by market participants subject to reporting requirements (“Reportable Positions”) is 448,279. The total number of their shorts is 472,428. The nonreportable positions show more long than short: 52,989 versus 28,840.
The next line shows the changes from the last report, which was published the previous week (February 19, 2019). It makes clear that the market participants subject to reporting requirements have reduced their positions in total, while those not subject to reporting requirements have increased their positions just slightly.
Below that you find information on open interest. The sums must always add up to 100, as the left-hand column makes clear. The open interest is broken down into percentages for each market participant.
Finally, the report lists the number of traders in each category.
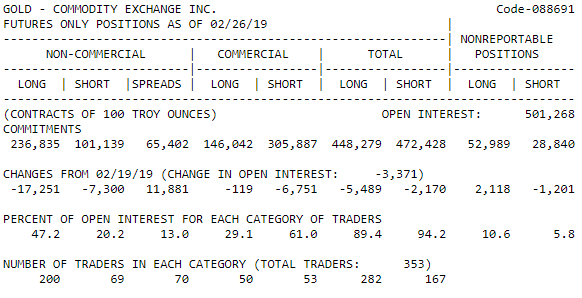
By way of comparison, here’s the short version of the COT report. It doesn’t show the changes from the previous report or list the previous positions. This makes the report much clearer and easier to understand.
COT report for the forex market and EUR/USD
COT data is also available for the forex market. You might be surprised to hear this and wonder how it is even possible – after all, forex is an over-the-counter (OTC) market, and most of the trading occurs off the official exchanges. These transactions are not included in the COT data, which cover the futures contracts traded in the US only. However, there are also futures in the forex market – for example, the futures contracts on the currency pairs EUR/USD (6E) and AUD/USD (6A). The positions in these contracts are indeed found in the COT reports.
But in my opinion, you shouldn’t attach as much importance to COT data for forex as to COT data for the commodity markets. As mentioned above, most forex trading takes place over-the-counter, and the volume of currency futures is very small. You can certainly use the data on these contracts as supplementary information, but I believe it would be reckless to trade the currency markets based on COT data alone.
The COT Index – an indicator based on the COT report
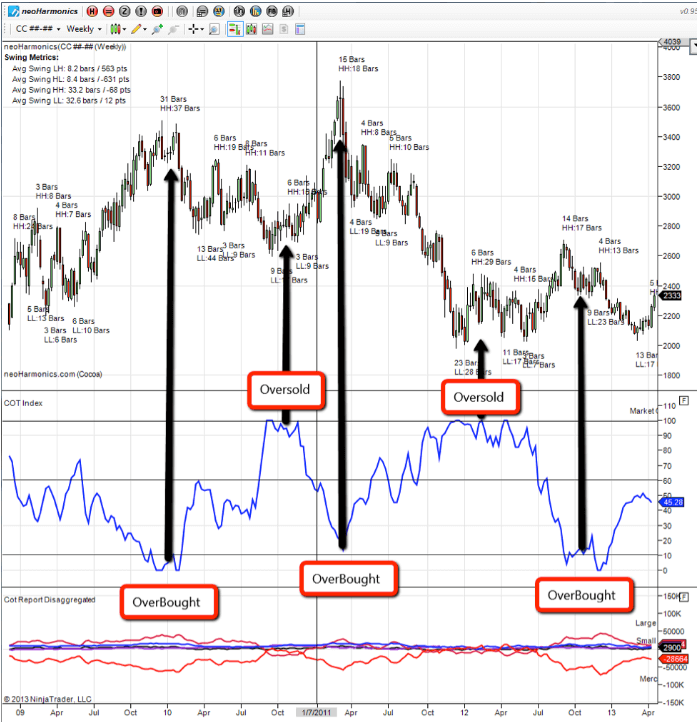
The COT Index links the net positions of the three groups of market players to the high or low of a selected period. It is calculated as follows:
COT Index = 100 x (current net – minimum net) / (maximum net – minimum net).
This results in an oscillator that swings above and below the zero line between two extreme zones.
In the chart below, you can see that the COT Index provided good buy and sell signals in the cocoa futures market. Generally speaking, when the index is in the overbought zone, there is a high probability of falling prices. When it is in the oversold zone, there is a high probability of rising prices. As in the case of all indicators, though, the COT Index can often give false signals. It shouldn’t be the only indicator you use to enter a trade, but it can provide you with useful supplementary information to confirm other signals.
My experience using COT data in trading
I’ve often applied COT data to my own trading, but due to the large number of possible uses and interpretations, it’s difficult to translate my experiences on a one-to-one basis into a general guide for others.
At one of the trading companies I worked for, we traded a lot of commodity options and futures and incorporated COT data into our strategies. Although we were a fairly small team of 17 proprietary traders, each of us interpreted and used the COT data in different ways.
I used the COT Index, which I described above, to get my bearings in the market, and I tended to supplement the COT data with seasonalities. For example, I would try to identify possible turning points by keeping an eye on extreme readings on market positions.
But you can’t simply assume that the market is about to reverse because positions are at a historical extreme. The data only become relevant if other factors are taken into account, such as additional fundamental data that confirm your interpretation, or the onset of a seasonal trend.
In addition to market positions and COT data, I always look at open interest.
Use of open interest, price and ratios when trading the COT data
Increases in open interest together with rising prices often signal that a bull market will continue. The opposite is true for bear markets. However, if open interest declines and prices continue to rise, it’s often a sign that an upward trend is coming to an end for the time being. Extreme data on open interest can also be helpful in trading. If open interest is at such an extreme, it can signal an imminent trend reversal.
I’ve come up with various ratios based on the COT data and have often been able to develop interesting trading ideas from them. With the help of these ratios, you can derive important information that goes beyond simply reading the COT report. It’s also interesting to observe the changes in these ratios and the subsequent market movements. Here, too, there are many approaches and possibilities, and in the end every trader needs to decide for themselves how to apply the COT data and what their goals are. I’ve had the best results using the COT data ratios in conjunction with open interest.
Larry Williams – the master of COT trading
Larry Williams is one of the world’s best-known traders. He has been actively trading the markets since 1966, and in 1987 he became famous by generating a return of 11,376 percent at the World Cup Trading Championship (WCTC). In just one year, he managed to turn a stake of 10,000 dollars into more than one million. The real-money WCTC is one of the best-known trading competitions in the world. In 1997 Larry’s daughter Michelle Williams also won the WCTC, achieving a return of 1,000 percent.
Because of Larry Wiliams’ record returns, many people have become interested in learning more about his trading approach. Since this approach is based on the COT report, Williams has played a key role in generating interest in COT data and popularizing them among retail traders. For this reason, he is sometimes called the master of COT trading. Many of the traders who have performed well in the WCTC are former students of his or were inspired by him. Two well-known German traders who excelled in the WCTC are Max Schulz and Adrian Kömel. They, too, use COT data in their trading and were trained by Larry Williams.
Tools for COT data
Many websites and internet sources present and visualize COT data. The following are useful:
- CFTC website with COT data
- https://www.suricate-trading.de/cot-daten/
- https://www.barchart.com/futures/commitment-of-traders
- https://freecotdata.com/
- https://www.tradingster.com/cot
- https://www.cotbase.com/
Trader education for COT data
There is wide range of excellent literature on this topic. In my view, the the three most important books are:
- The Commitments of Traders Bible: How to Profit from Insider Market Intelligence
- Trade Stocks and Commodities with the Insiders: Secrets of the COT Report
- Commitments of Traders : Strategies for Tracking the Market and Trading Profitably
Conclusion of this article about COT data and the COT report
Recently the COT data have been subject to a lot of hype, which has made them increasingly popular. Although their popularity is justified to some extent, you should always understand their limits.
To begin with, COT reports only show trades in futures contracts. OTC trades are not covered.
In addition, the data only cover futures contracts traded in the United States.
Finally, as the last budget US budget showdown made clear, data publication is not always reliable. During the showdown and for several weeks afterward, the CFTC didn’t release any data. As a result, many traders lacked important information on which to base their trading decisions.
However, it’s also worth emphasizing that the COT data work well, especially in commodity markets, enabling you to identify trends at an early stage. In addition, the data are available free of charge and are thus a great bargain. For this reason alone, every trader should be aware of them and know what they signify. And every trader should have studied them in depth at least once in their lives.
Read more:


