In this article we make a Bitcoin price forecast and long-term prediction. We would like to give an assessment of the future price development of the Bitcoin using the daily, weekly and monthly charts. We also look at the long-term chart for BTC/USD, which is the quarterly chart and yearly chart with a logarithmic scale. The basis of our analysis is the Price Action and Technical Chart Analysis.
The charts used are from TradingView and the prices are from Coinbase .
Bitcoin Forecast: Daily Chart showing established support zone
Last update: July 25, 2021
Bitcoin (BTC/USD) has shown weakness after reaching record high levels in April. The correction has fallen through the near supports and is now running sideways above the high from 2020
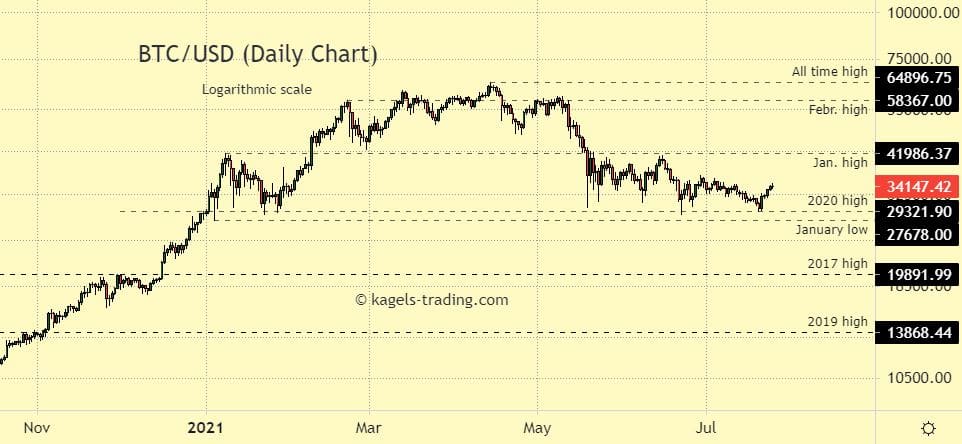
Resistance levels: 41 986 | 58 367 | 64 896.75
Support levels: 29 321 | 27 678 | 19 891
Bitcoin forecast: The daily chart of Bitcoin looks positive. As long as BTC/USD prices stay above the January low at around $ 28 000, we could expect a continuation of the current uptrend. Actually, the price is around 34K after getting support at $ 30 000.
Bitcoin Forecast: Weekly Chart is getting support at the 2020 high
Last update: July 25, 2021
Bitcoin (BTC/USD) on the weekly chart is moving in an established uptrend. At the moment, we see a correction that has dropped near above the January low. It looks like there may be strong support around this levels.
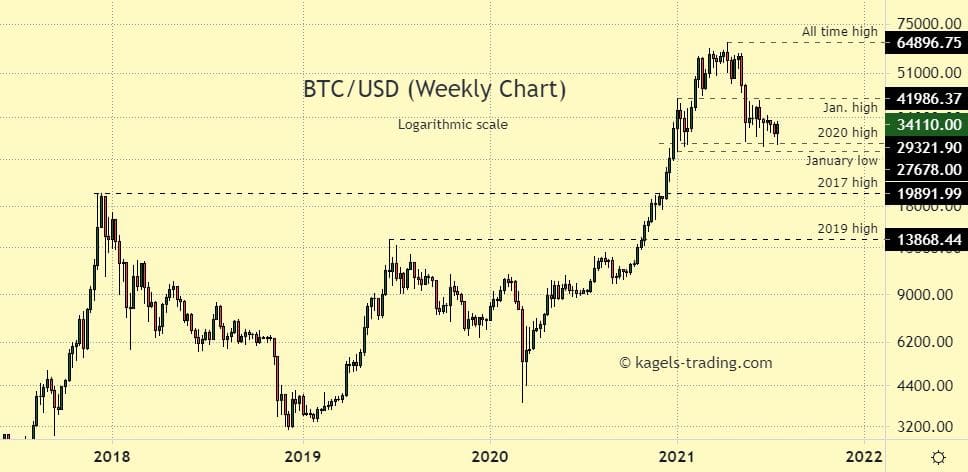
Resistance levels: 41 986 | 58 367 | 64 896.75
Support levels: 29 321 | 27 678 | 19 891
Bitcoin forecast: The weekly chart of Bitcoin still looks positive and more upside potential is probable. A break below $ 29 000 would turn the chart picture to neutral. Prices below the 2019 high would create a negative outlook.
Bitcoin price prediction: Monthly Chart also showing support
Last update: July 25, 2021
On the monthly chart BTC/USD is moving in an established uptrend and has printed a new all time high. In the month of May we see a strong correction, which was followed by June recovering from a low at $ 28 800. The lower shadows, also in July, could be an indication of willingness to buy at this price levels.
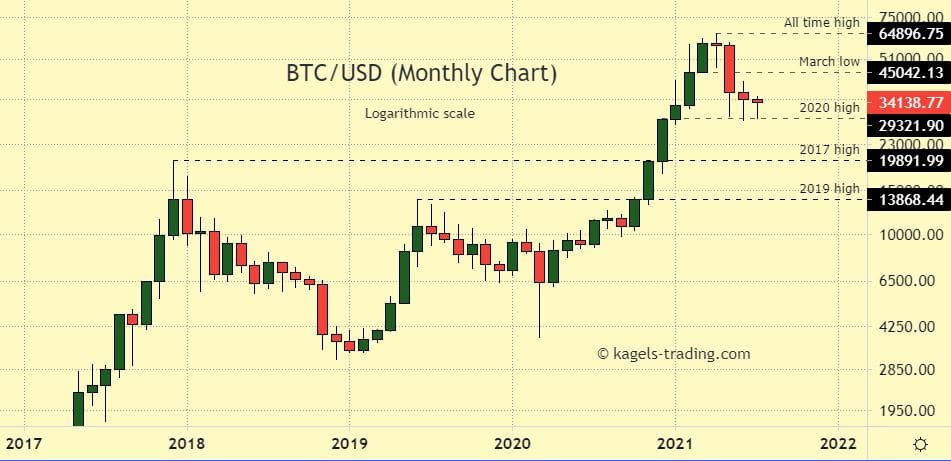
Resistance levels: 45 042 | 64 896.75 – All time high
Support levels: 29 321 | 19 892
Bitcoin forecast: The monthly chart of Bitcoin looks positive and more upside potential is possible. As long as BTC/USD prices stay above 2020 high, we could expect a continuation of the current uptrend.
Bitcoin Price Prediction: Quarterly Chart (3-months-chart)
Last update: July 25, 2021
In the 3-month chart shown here, we can see that BTC/USD is moving in an established uptrend and has printed a new all time high. The 2017 high at $ 19 892 has been passed and the 2020 high may grant support.
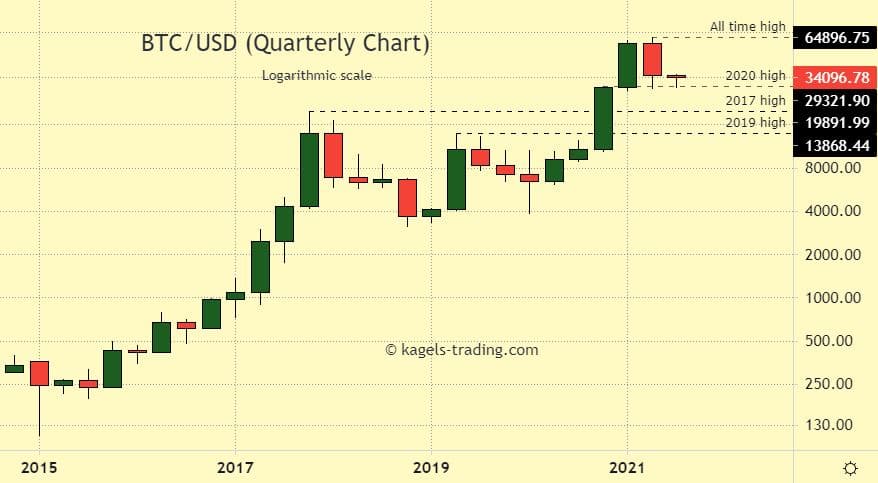
Resistance levels: 64 896.75 – All time high
Support levels: 29 321 | 19 892 | 13 868
Bitcoin Prediction: The quarterly chart of Bitcoin looks positive and more upside potential is possible. As long as BTC/USD prices stay above 2020 high, we could expect a continuation of the current uptrend.
BTC/USD Outlook: Historical Chart (12-month-chart)
Last update: July 25, 2021
In the yearly chart shown here, we can see that BTC/USD has passed the high of the year 2017. At the beginning of 2021, it started a strong move above $ 30 000 and created the current all time high.
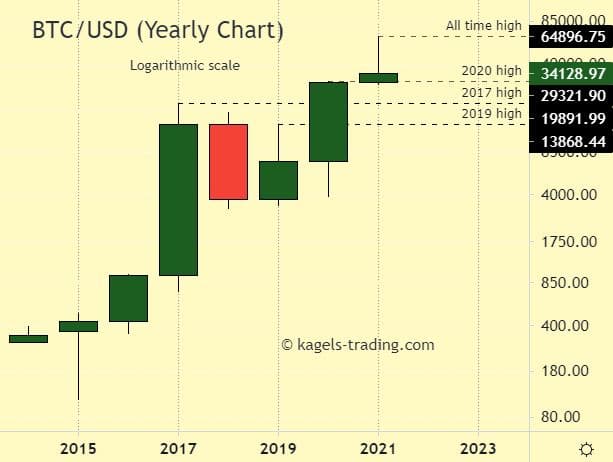
Long-term resistance levels: 64 896.75 – All time high
Long-term support levels: 29 321 | 19 892 | 13 868
Long-term Prediction: If we consider the stable and intact upward trend with strong upward momentum since the low of 2015, probability seems to favor a further increase in Bitcoin prices. As long as BTC/USD prices stay above $ 30.000, we could expect a continuation of the current uptrend.
What is the current price of Bitcoin (BTC) ?
You could check the current price of Bitcoin (BTC) here.
About Bitcoin
Bitcoin is the original cryptocurrency released in 2009 as open-source software. It is a digital currency predicated on cryptographically secure transactions, a proof-of-work consensus model, and a decentralized, P2P distributed ledger network. Bitcoin’s distributed ledger is the first blockchain — a shared and distributed timestamped ledger of data blocks connected through a chain of cryptographic hashes — and solved the double spend problem that had plagued previous iterations of digital currencies.
Disclaimer: This article is not trading advice and should not be construed as such. Always consult a trained financial professional before investing in cryptocurrencies, as the market is particularly volatile.
*This price prediction is based on the data collected from various sources. This should not be considered as an investing parameter and user should do their own research before investing.
Do you think our predictions are accurate? What are your thoughts on the methods used to reach our conclusions? Let us know in the comments below.